
Properties for sale in L27
Netherley
- Info
- Price Paid By Year
- Property Type Price
- Transport
House Prices in L27
Properties in L27 have an average house price of £147,993.00 and had 203 Property Transactions within the last 3 years.
The most expensive property was sold for £390,000.00.
Property Price Paid in L27 by Year
The average sold property price by year was:
| Year | Average Sold Price | Sold Properties |
|---|---|---|
| 2026 | £152,783.00 | 28 Properties |
| 2025 | £157,711.00 | 65 Properties |
| 2024 | £149,979.00 | 62 Properties |
| 2023 | £129,476.00 | 48 Properties |
| 2022 | £136,040.00 | 64 Properties |
| 2021 | £126,206.00 | 64 Properties |
| 2020 | £135,982.00 | 68 Properties |
| 2019 | £125,440.00 | 103 Properties |
| 2018 | £98,921.00 | 60 Properties |
| 2017 | £93,163.00 | 46 Properties |
| 2016 | £84,207.00 | 40 Properties |
| 2015 | £90,264.00 | 45 Properties |
| 2014 | £102,475.00 | 32 Properties |
| 2013 | £94,852.00 | 50 Properties |
| 2012 | £93,337.00 | 28 Properties |
| 2011 | £77,225.00 | 24 Properties |
| 2010 | £100,556.00 | 45 Properties |
| 2009 | £95,577.00 | 24 Properties |
| 2008 | £112,025.00 | 36 Properties |
| 2007 | £106,447.00 | 52 Properties |
| 2006 | £106,172.00 | 81 Properties |
| 2005 | £87,540.00 | 47 Properties |
| 2004 | £74,389.00 | 70 Properties |
| 2003 | £57,683.00 | 53 Properties |
| 2002 | £47,988.00 | 58 Properties |
| 2001 | £51,895.00 | 59 Properties |
| 2000 | £43,666.00 | 57 Properties |
| 1999 | £30,926.00 | 26 Properties |
| 1998 | £28,615.00 | 19 Properties |
| 1997 | £31,102.00 | 40 Properties |
| 1996 | £29,298.00 | 30 Properties |
| 1995 | £28,134.00 | 16 Properties |
Property Price per Property Type in L27
Here you can find historic sold price data in order to help with your property search.
The average Property Paid Price for specific property types in the last three years are:
| Property Type | Average Sold Price | Sold Properties |
|---|---|---|
| Semi Detached House | £184,936.00 | 55 Semi Detached Houses |
| Terraced House | £130,984.00 | 141 Terraced Houses |
| Detached House | £272,500.00 | 4 Detached Houses |
| Flat | £104,166.00 | 3 Flats |

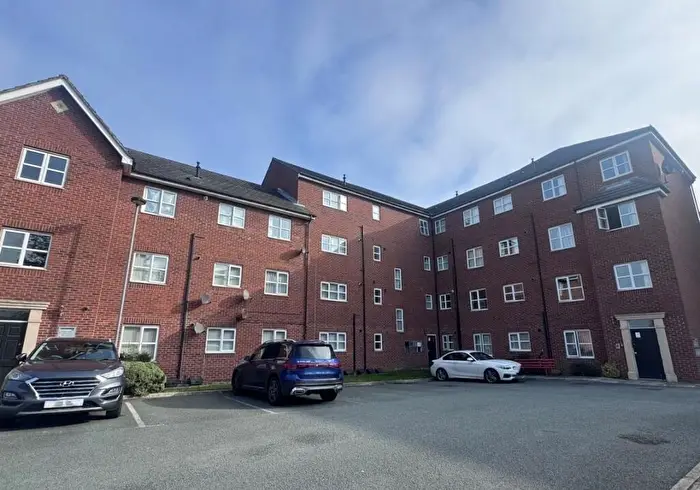
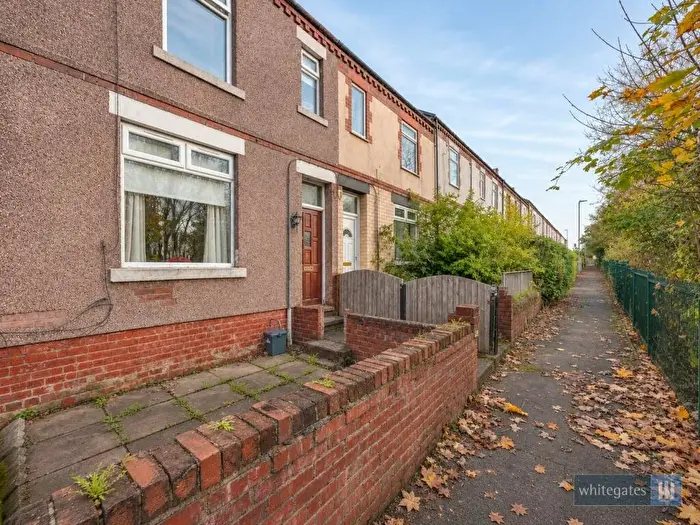
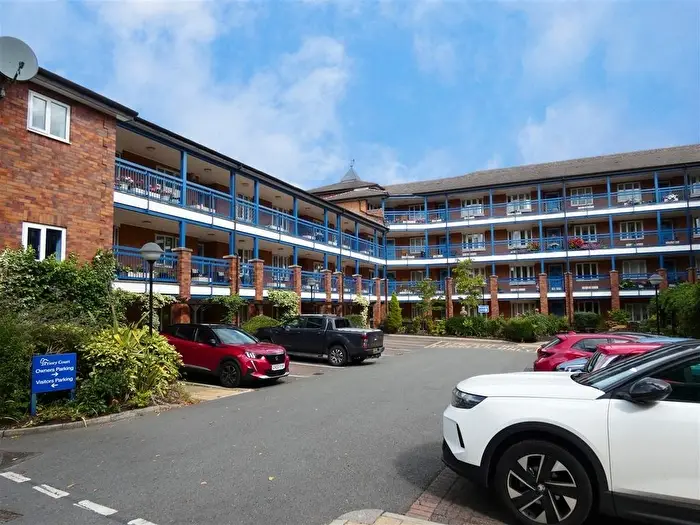
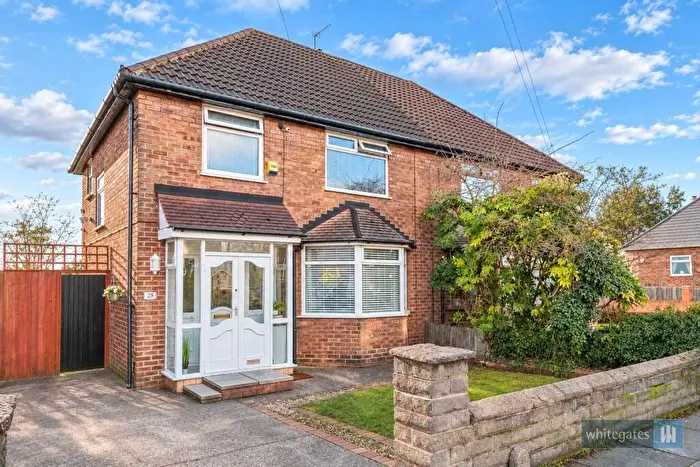
Houses and Flats for sale in L27, Netherley

There are 425 results. Property prices in L27 range from £85k to £230k with an average price of £161k.
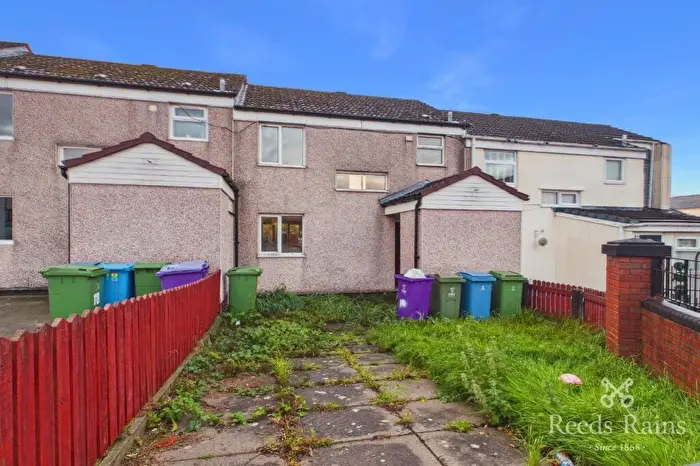

 3 Bedrooms
 1 Bathroom




If you are looking to sell your house, let it out, or receive a property valuation, an expert can help you.
Click the button below to get started.


Properties for sale near L27


If you are looking to sell your house, let it out, or receive a property valuation, an expert can help you.
Click the button below to get started.



Property market in L27
What's for sale
10 homes · share, count and typical priceHow many bedrooms
share, count and typical pricePrice bands
10 homesAsking prices over time
typical asking price of the homes first listed each quarter · +16.9% since 2024 Q4Prices in and around L27
typical asking price, cheapest firstSchools in L27
2 primary · 0 secondary · 100% rated good or outstanding- St Gregory's Catholic Primary School primary · Good
- Norman Pannell Primary School primary · Good
Based on 10 homes for sale on Houses now, 73 listings that left the market in the last 12 months, the asking prices of the homes listed over the last two years. Sold prices: HM Land Registry Price Paid Data, Sep 2025 to Aug 2026 (Crown copyright). Schools: Ofsted. Updated November 2026.
Frequently Asked Questions about L27
What is the average house price in L27?
The average home for sale in L27 is priced at £163,000. A typical home, the one in the middle of the range, is £175,000. This is based on the 10 homes for sale on Houses right now.
How much does a 2 or 3 bedroom home cost in L27?
A typical 2-bedroom home in L27 costs £150,000 and a 3-bedroom home £190,000. So the extra bedroom adds about £40,000.
How many homes are for sale in L27?
There are 9 homes for sale in L27 on Houses right now, plus 3 already under offer. 3 new listings came onto the market in the last 30 days.
Are house prices going up in L27?
Yes. Homes put up for sale in L27 over the last 12 months were advertised at a typical £170,000, 4.6% higher than the year before (£163,000). By size, 3-bedroom homes are up 3%.
How long does it take to sell a home in L27?
Homes usually sell or come off the market within about 5 weeks. About 44% go within the first month, and a quarter take longer than about 10 weeks. Houses go faster, in about 5 weeks against about 15 months for flats.
What rental yield can I get in L27?
About 8.3% gross for flats and 6.5% for houses. That compares typical rents with what flats and houses actually sold for in L27 over the last year. Running costs, voids and mortgage interest are not taken off.
What type of homes are for sale in L27?
Terraced houses are the most common, about 7 in 10 homes for sale in L27. Bungalows come next, followed by flats and apartments.
Where are the cheapest places to buy near L27?
Of the areas around L27, L14 is the cheapest, with a typical asking price of £195,000, followed by L36 (£210,000) and L35 (£277,000). L27 itself is £175,000.
Are homes in L27 freehold or leasehold?
About 7 in 10 homes for sale in L27 are freehold and the rest leasehold, which is mostly flats.
What are the schools like in L27?
There are 2 primary and 0 secondary schools in L27.
Which areas are included in the L27 postcode district?
The main area within L27 is Netherley.
What has been the average sold property price in L27 over the last three years?
Terraced Houses in L27 have an average sold price of £130,984, while Semi Detached Houses have an average of £184,936. Detached Houses have an average of £272,500 and Flats have an average of £104,166. The average sold property price in L27 over the last three years is approximately £153,491.