
Properties for sale in ME9
Sittingbourne
- Info
- Price Paid By Year
- Property Type Price
- Transport
House Prices in ME9
Properties in ME9 have an average house price of £390,975.00 and had 750 Property Transactions within the last 3 years.
The most expensive property was sold for £3,940,000.00.
Property Price Paid in ME9 by Year
The average sold property price by year was:
| Year | Average Sold Price | Sold Properties |
|---|---|---|
| 2025 | £376,224.00 | 243 Properties |
| 2024 | £400,434.00 | 286 Properties |
| 2023 | £394,953.00 | 221 Properties |
| 2022 | £431,194.00 | 347 Properties |
| 2021 | £390,072.00 | 474 Properties |
| 2020 | £361,925.00 | 341 Properties |
| 2019 | £349,680.00 | 336 Properties |
| 2018 | £352,561.00 | 294 Properties |
| 2017 | £320,662.00 | 349 Properties |
| 2016 | £294,697.00 | 427 Properties |
| 2015 | £266,746.00 | 401 Properties |
| 2014 | £254,628.00 | 417 Properties |
| 2013 | £250,670.00 | 309 Properties |
| 2012 | £234,188.00 | 276 Properties |
| 2011 | £241,454.00 | 219 Properties |
| 2010 | £243,004.00 | 245 Properties |
| 2009 | £226,260.00 | 193 Properties |
| 2008 | £242,655.00 | 208 Properties |
| 2007 | £246,368.00 | 410 Properties |
| 2006 | £239,122.00 | 496 Properties |
| 2005 | £231,485.00 | 430 Properties |
| 2004 | £213,808.00 | 540 Properties |
| 2003 | £185,712.00 | 497 Properties |
| 2002 | £169,905.00 | 521 Properties |
| 2001 | £144,797.00 | 463 Properties |
| 2000 | £139,005.00 | 376 Properties |
| 1999 | £126,301.00 | 334 Properties |
| 1998 | £96,870.00 | 356 Properties |
| 1997 | £95,148.00 | 334 Properties |
| 1996 | £80,923.00 | 313 Properties |
| 1995 | £88,801.00 | 217 Properties |
Property Price per Property Type in ME9
Here you can find historic sold price data in order to help with your property search.
The average Property Paid Price for specific property types in the last three years are:
| Property Type | Average Sold Price | Sold Properties |
|---|---|---|
| Semi Detached House | £338,257.00 | 259 Semi Detached Houses |
| Detached House | £591,382.00 | 233 Detached Houses |
| Terraced House | £281,057.00 | 212 Terraced Houses |
| Flat | £179,267.00 | 46 Flats |
Transport near ME9

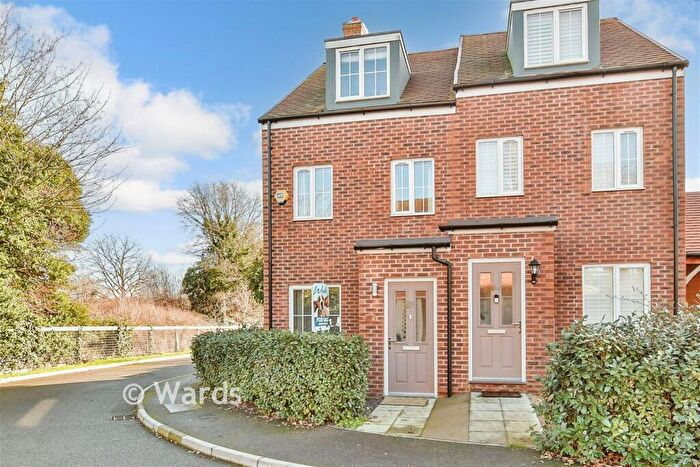
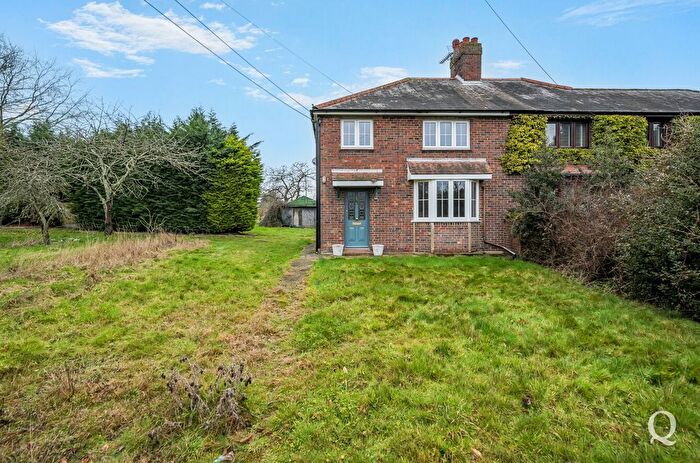
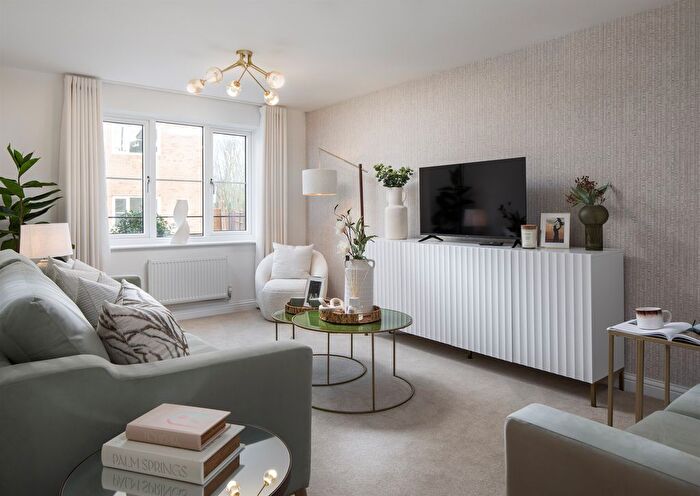
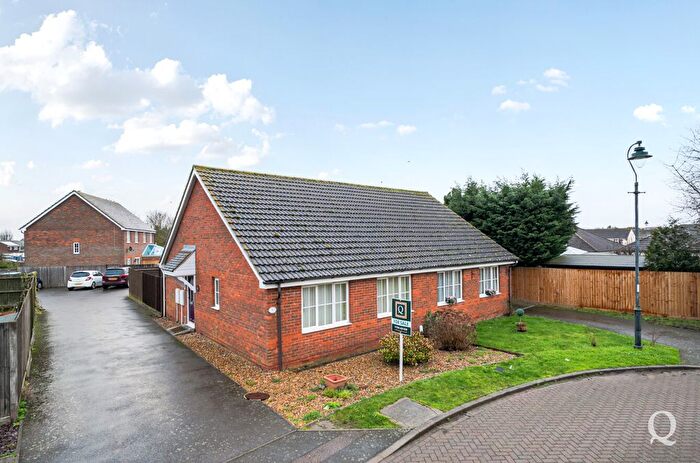
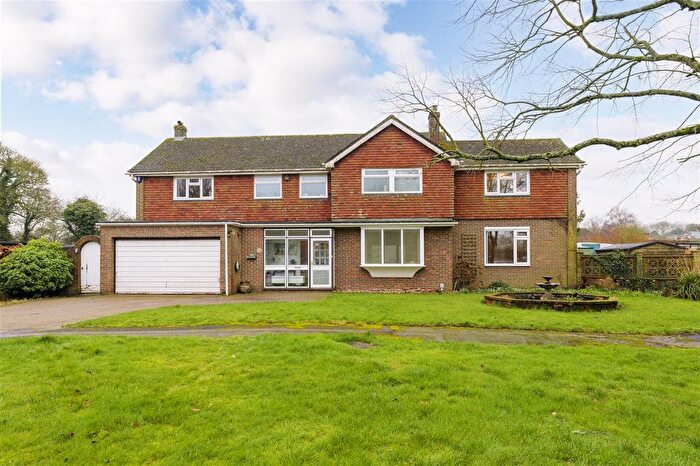
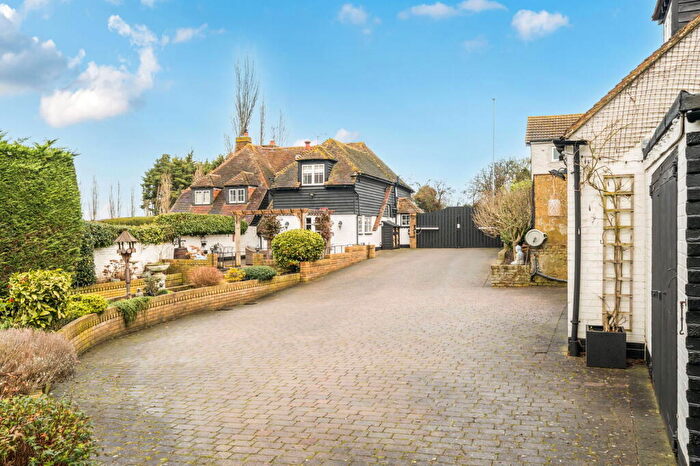
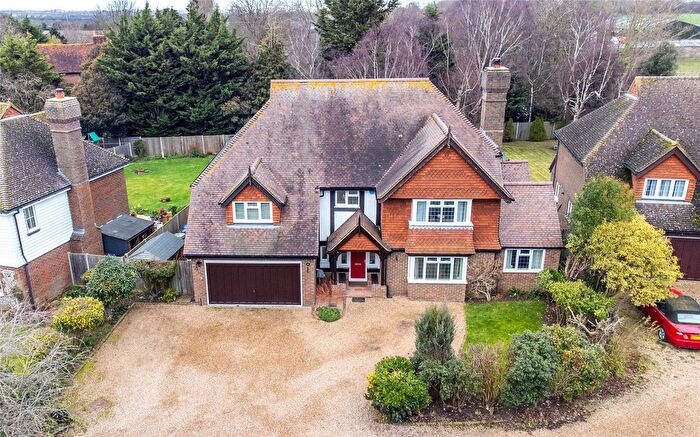
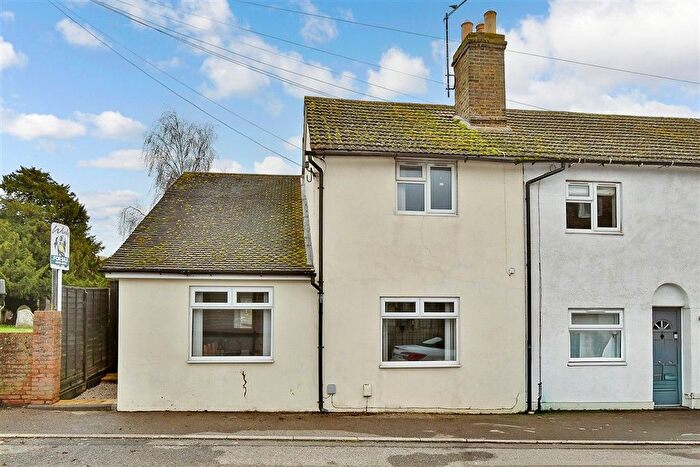
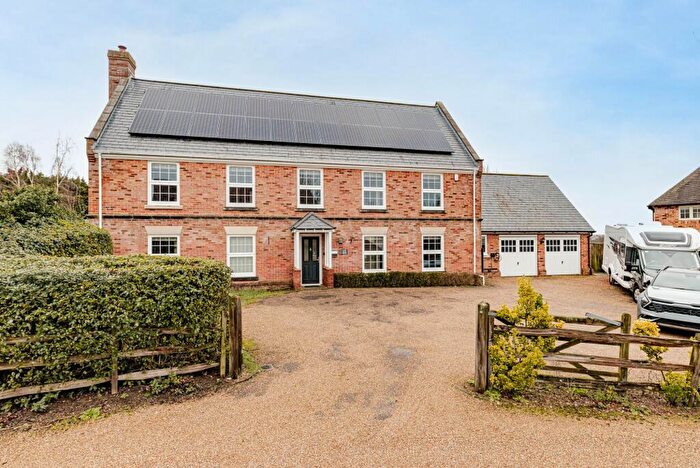
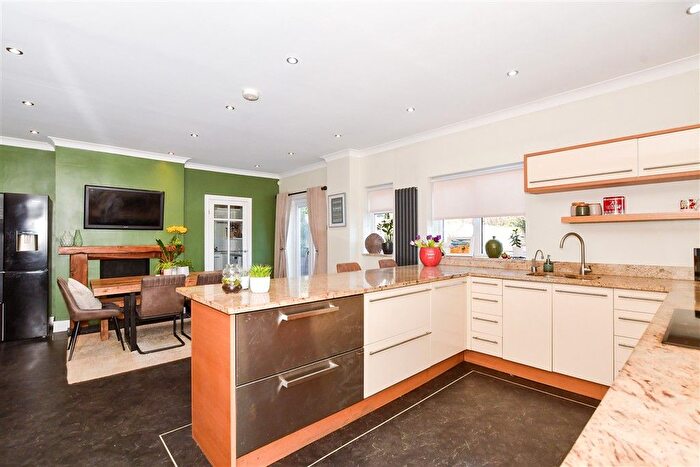
Houses and Flats for sale in ME9, Sittingbourne
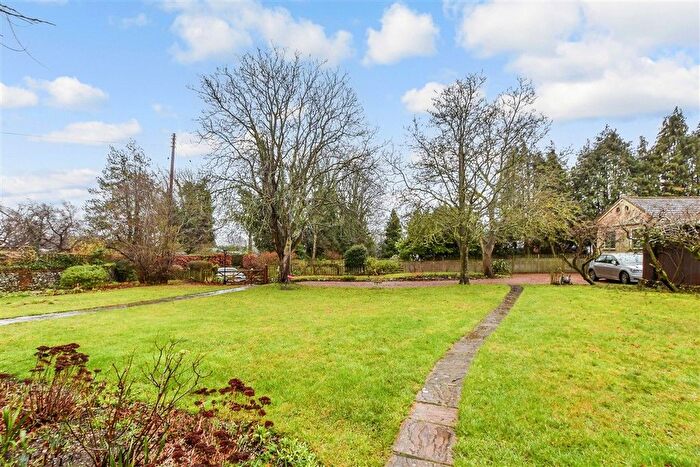
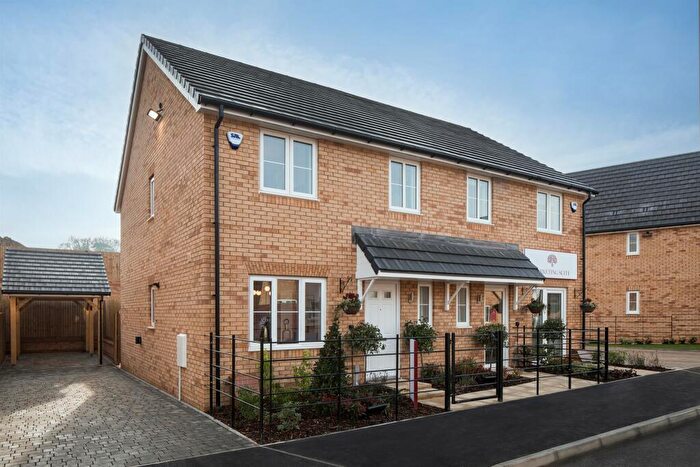
![]()
If you are looking to sell your house, let it out, or receive a property valuation, an expert can help you.
Click the button below to get started.

Frequently Asked Questions about ME9
What is the average price for a property for sale in ME9?
The average price for a property for sale in ME9 is £390,975. There are 126 property listings for sale in ME9.
Which areas are included in the ME9 postcode district?
The main area within ME9 is Sittingbourne.
What are the most common property types in ME9?
The most common property types in ME9 are Semi Detached Houses, Detached Houses, Terraced Houses and Flats.
What has been the average sold property price in ME9 over the last three years?
Semi Detached Houses in ME9 have an average sold price of £338,257, while Detached Houses have an average of £591,382. Terraced Houses have an average of £281,057 and Flats have an average of £179,267. The average sold property price in ME9 over the last three years is approximately £390,537.
Which train stations are available in ME9?
The train stations available in ME9 are Newington Station, Swale Station and Teynham Station..