
Properties for sale in ML1
Motherwell, Carfin, Cleland, Hareshaw, Holytown, New Stevenston, Newarthill, Newhouse
- Info
- Price Paid By Year
- Transport
House Prices in ML1
Properties in ML1 have an average house price of £154,259.00 and had 1814 Property Transactions within the last 3 years.
The most expensive property was sold for £727,333.00.
Property Price Paid in ML1 by Year
Loading ...
The average sold property price by year was:
| Year | Average Sold Price | Sold Properties |
|---|---|---|
| 2026 | £173,646.00 | 255 Properties |
| 2025 | £162,594.00 | 506 Properties |
| 2024 | £144,626.00 | 497 Properties |
| 2023 | £146,395.00 | 556 Properties |
| 2022 | £159,075.00 | 847 Properties |
| 2021 | £154,967.00 | 986 Properties |
| 2020 | £147,723.00 | 823 Properties |
| 2019 | £148,209.00 | 1,077 Properties |
| 2018 | £151,904.00 | 1,139 Properties |
| 2017 | £140,728.00 | 1,091 Properties |
| 2016 | £136,100.00 | 1,073 Properties |
| 2015 | £129,334.00 | 1,075 Properties |
| 2014 | £128,217.00 | 941 Properties |
| 2013 | £125,398.00 | 804 Properties |
| 2012 | £130,520.00 | 738 Properties |
| 2011 | £125,167.00 | 650 Properties |
| 2010 | £111,767.00 | 563 Properties |
| 2009 | £157,327.00 | 570 Properties |
| 2008 | £117,374.00 | 965 Properties |
| 2007 | £118,082.00 | 1,358 Properties |
| 2006 | £96,233.00 | 1,363 Properties |
| 2005 | £97,048.00 | 1,277 Properties |
| 2004 | £70,356.00 | 1,140 Properties |
| 2003 | £56,843.00 | 1,123 Properties |
| 2002 | £51,305.00 | 1,201 Properties |
| 2001 | £45,364.00 | 94 Properties |

Houses and Flats for sale in ML1, Motherwell, Carfin, Cleland, Hareshaw

There are 54 results. Property prices in ML1 range from £93k to £473k with an average price of £235k.
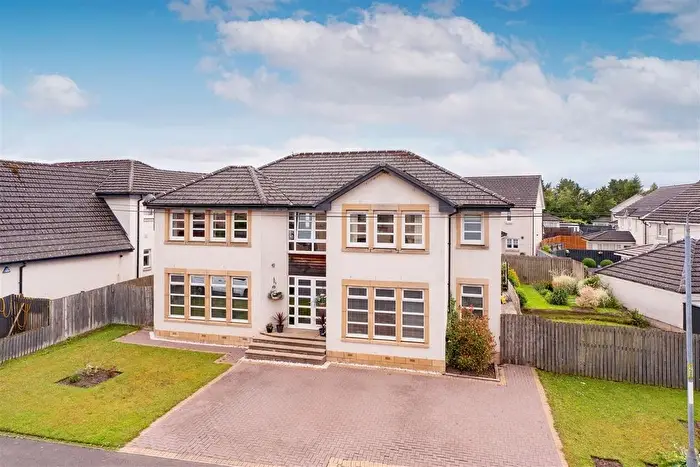

 5 Bedrooms
 4 Bathrooms


If you are looking to sell your house, let it out, or receive a property valuation, an expert can help you.
Click the button below to get started.