
Properties for sale in ML1
Motherwell, Carfin, Cleland, Hareshaw, Holytown, New Stevenston, Newarthill, Newhouse
- Info
- Price Paid By Year
- Transport
House Prices in ML1
Properties in ML1 have an average house price of £151,089.00 and had 1559 Property Transactions within the last 3 years.
The most expensive property was sold for £727,333.00.
Property Price Paid in ML1 by Year
The average sold property price by year was:
| Year | Average Sold Price | Sold Properties |
|---|---|---|
| 2025 | £162,594.00 | 506 Properties |
| 2024 | £144,626.00 | 497 Properties |
| 2023 | £146,395.00 | 556 Properties |
| 2022 | £159,075.00 | 847 Properties |
| 2021 | £154,967.00 | 986 Properties |
| 2020 | £147,723.00 | 823 Properties |
| 2019 | £148,209.00 | 1,077 Properties |
| 2018 | £151,904.00 | 1,139 Properties |
| 2017 | £140,728.00 | 1,091 Properties |
| 2016 | £136,100.00 | 1,073 Properties |
| 2015 | £129,334.00 | 1,075 Properties |
| 2014 | £128,217.00 | 941 Properties |
| 2013 | £125,398.00 | 804 Properties |
| 2012 | £130,520.00 | 738 Properties |
| 2011 | £125,167.00 | 650 Properties |
| 2010 | £111,767.00 | 563 Properties |
| 2009 | £157,327.00 | 570 Properties |
| 2008 | £117,374.00 | 965 Properties |
| 2007 | £118,082.00 | 1,358 Properties |
| 2006 | £96,233.00 | 1,363 Properties |
| 2005 | £97,048.00 | 1,277 Properties |
| 2004 | £70,356.00 | 1,140 Properties |
| 2003 | £56,843.00 | 1,123 Properties |
| 2002 | £51,305.00 | 1,201 Properties |
| 2001 | £45,364.00 | 94 Properties |

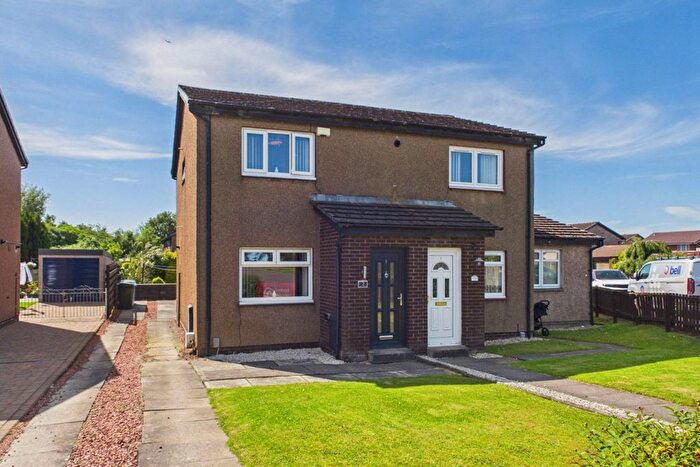
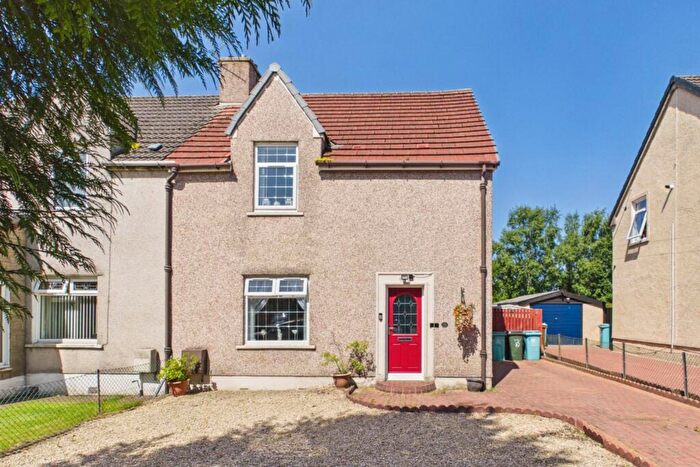
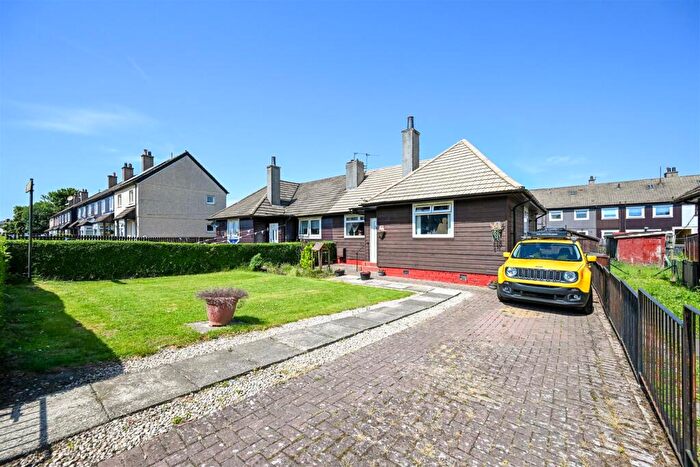
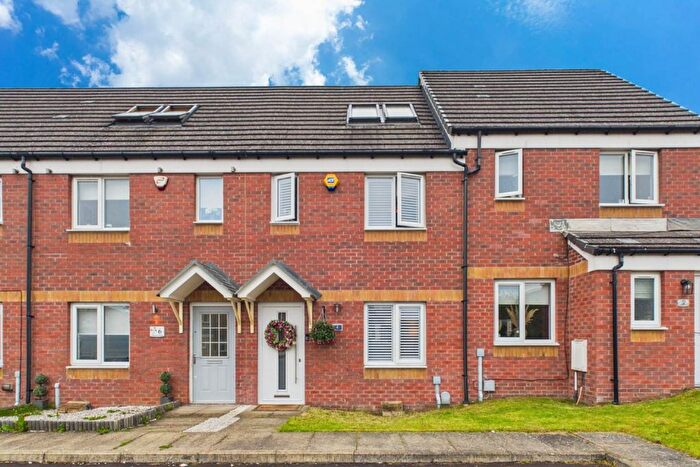
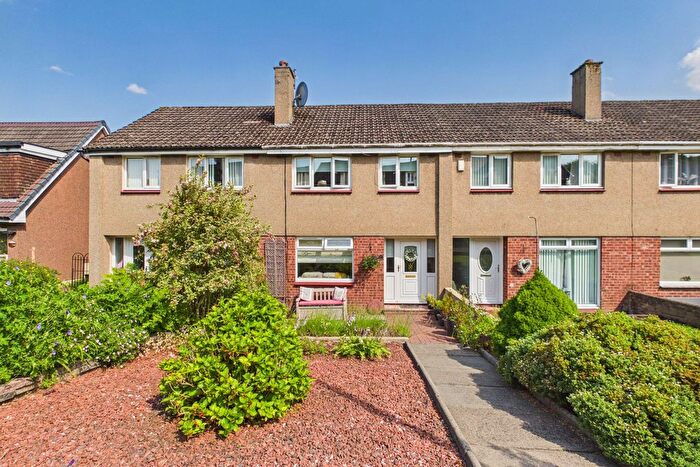
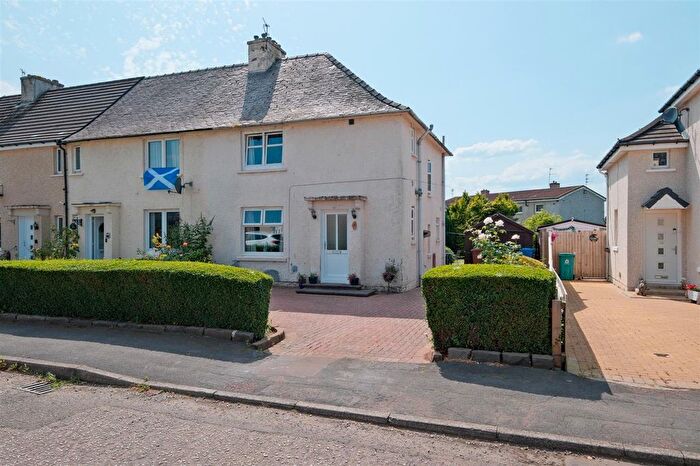
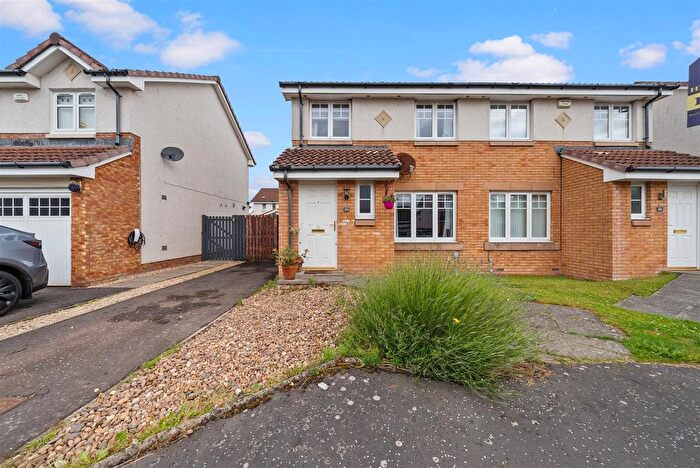
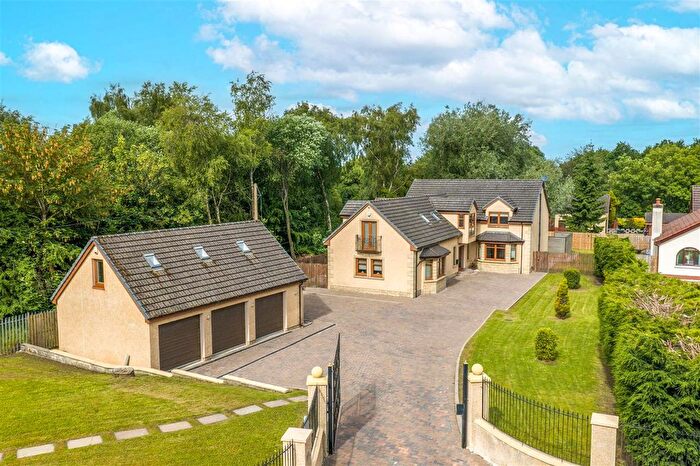
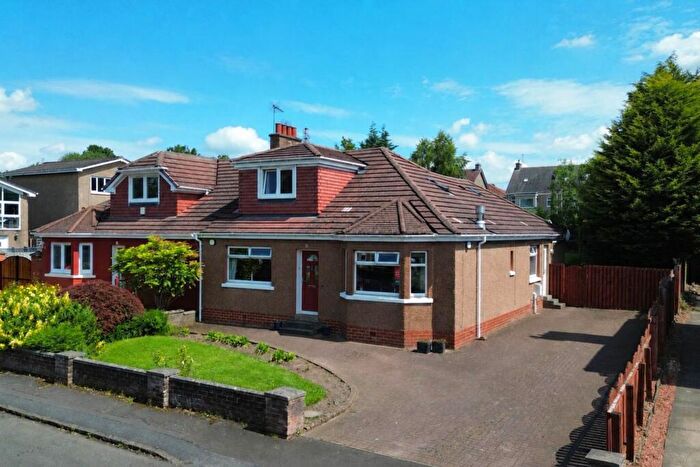
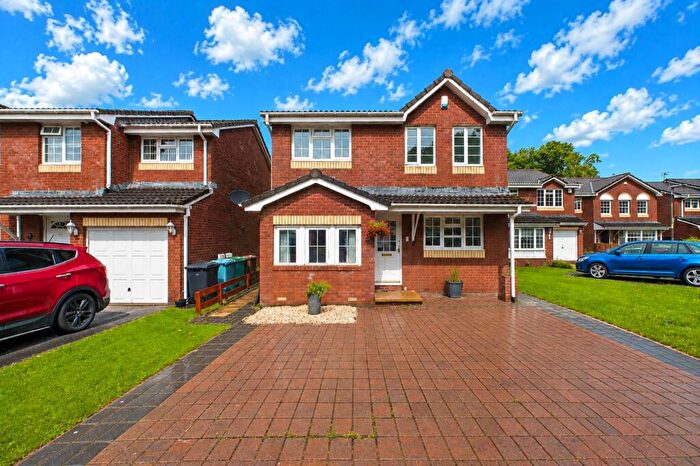
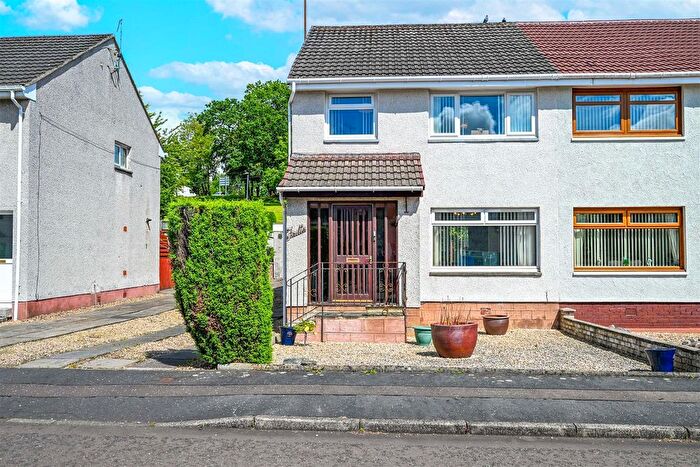
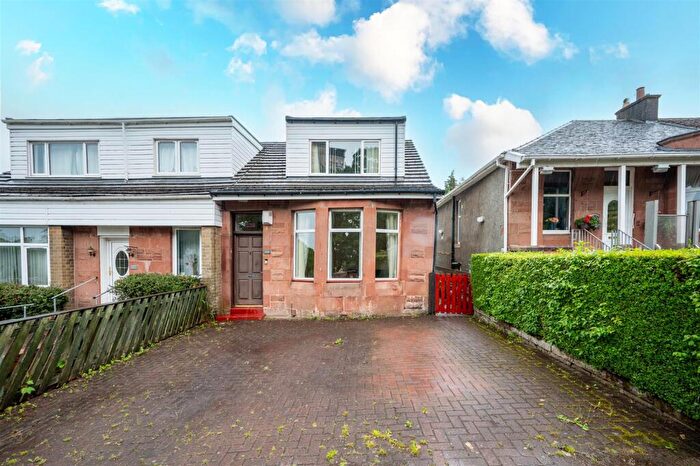
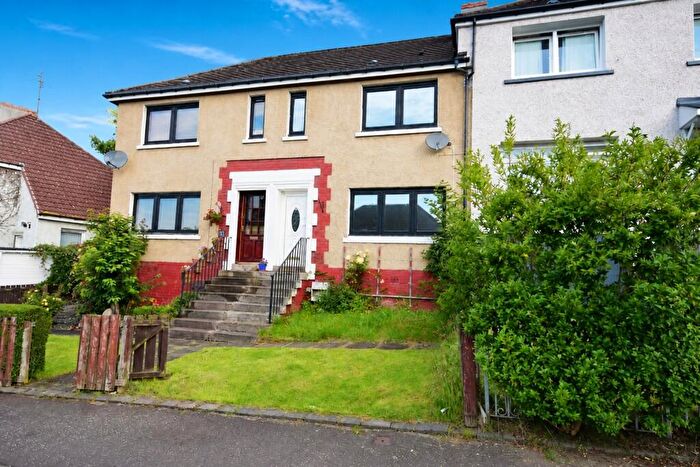
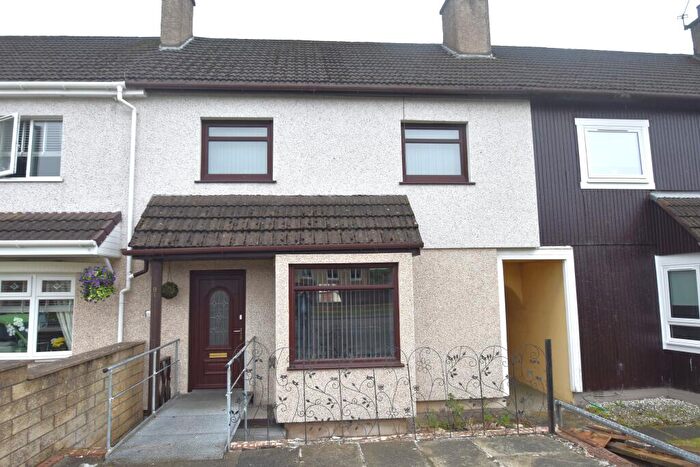
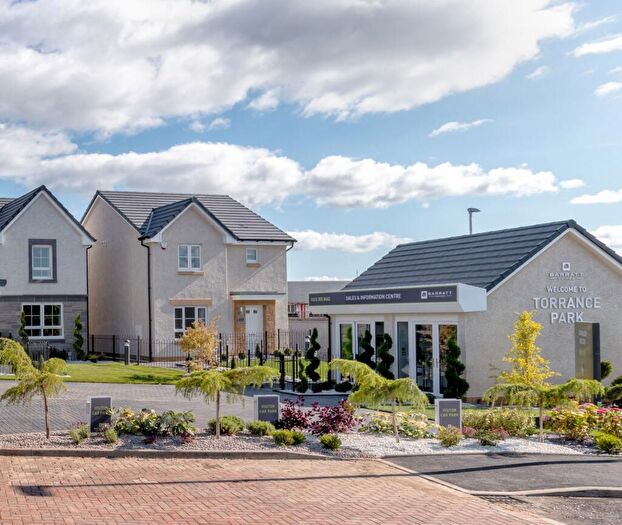
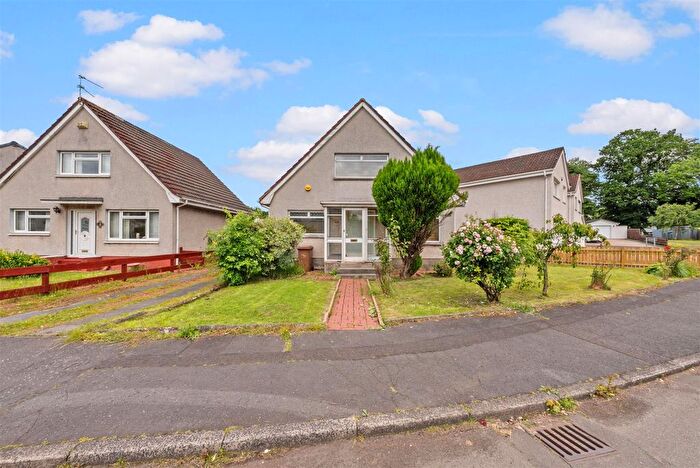
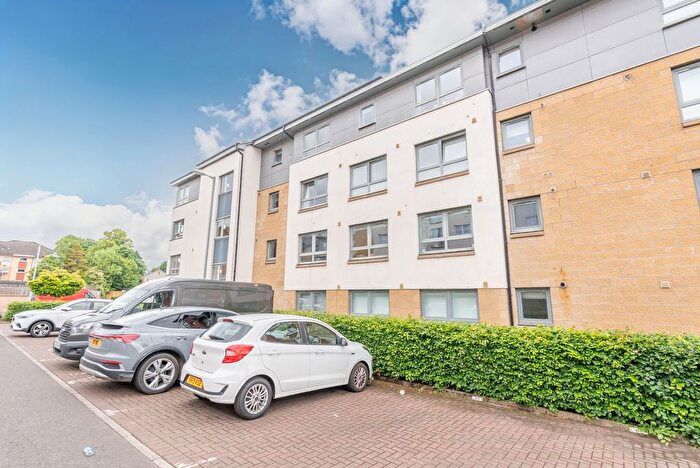
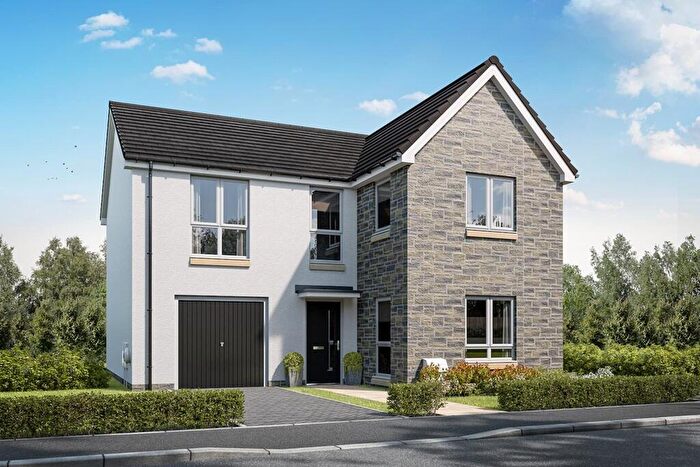
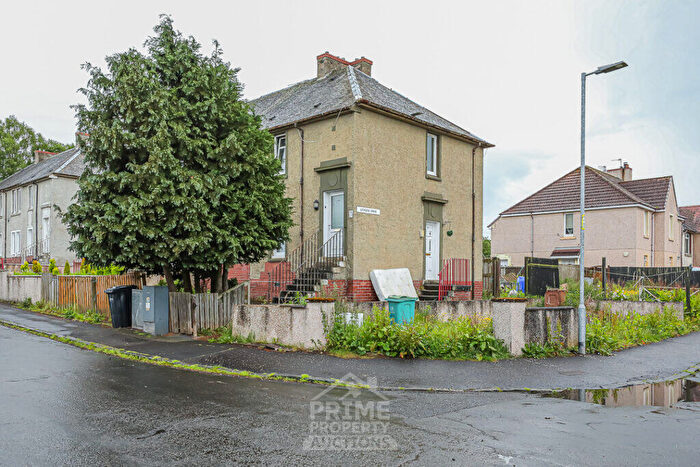
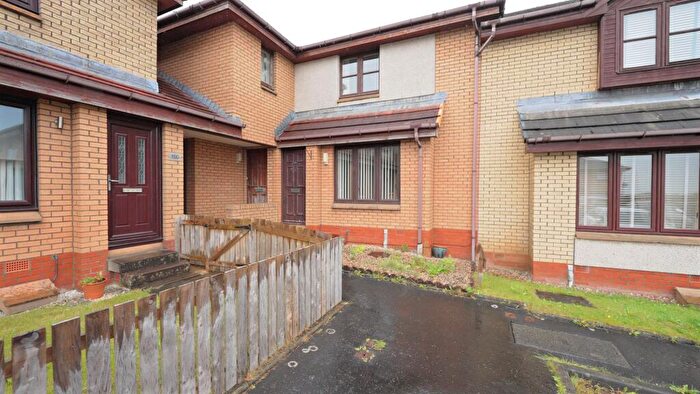
Houses and Flats for sale in ML1, Motherwell, Carfin, Cleland, Hareshaw
There are 43 results. Property prices in ML1 range from £45k to £650k with an average price of £245k.


![]()
If you are looking to sell your house, let it out, or receive a property valuation, an expert can help you.
Click the button below to get started.


Frequently Asked Questions about ML1
What is the average price for a property for sale in ML1?
The average price for a property for sale in ML1 is £151,089. There are 43 property listings for sale in ML1.
Which areas are included in the ML1 postcode district?
The main areas within ML1 include Motherwell, Carfin, Cleland, Hareshaw, Holytown, New Stevenston, Newarthill and Newhouse.
What are the most common property types in ML1?
The most common property types in ML1 are Unknowns.
What has been the average sold property price in ML1 over the last three years?
Unknowns in ML1 have an average sold price of £151,089. The average sold property price in ML1 over the last three years is approximately £151,205.
Which train stations are available in ML1?
The train stations available in ML1 are Airbles Station, Carfin Station, Carstairs Station, Cleland Station, Holytown Station, Lanark Station and Motherwell Station..