
Properties for sale in N10
Muswell Hill
- Info
- Price Paid By Year
- Property Type Price
- Transport
House Prices in N10
Properties in N10 have an average house price of £913,627.00 and had 900 Property Transactions within the last 3 years.
The most expensive property was sold for £4,390,000.00.
Property Price Paid in N10 by Year
The average sold property price by year was:
| Year | Average Sold Price | Sold Properties |
|---|---|---|
| 2026 | £721,577.00 | 4 Properties |
| 2025 | £887,516.00 | 290 Properties |
| 2024 | £910,012.00 | 301 Properties |
| 2023 | £944,539.00 | 305 Properties |
| 2022 | £927,695.00 | 368 Properties |
| 2021 | £871,282.00 | 408 Properties |
| 2020 | £875,742.00 | 266 Properties |
| 2019 | £822,164.00 | 331 Properties |
| 2018 | £817,644.00 | 328 Properties |
| 2017 | £793,030.00 | 380 Properties |
| 2016 | £744,223.00 | 305 Properties |
| 2015 | £714,673.00 | 346 Properties |
| 2014 | £661,169.00 | 446 Properties |
| 2013 | £607,532.00 | 437 Properties |
| 2012 | £573,259.00 | 319 Properties |
| 2011 | £534,474.00 | 325 Properties |
| 2010 | £493,361.00 | 369 Properties |
| 2009 | £452,636.00 | 288 Properties |
| 2008 | £439,547.00 | 268 Properties |
| 2007 | £502,732.00 | 526 Properties |
| 2006 | £408,166.00 | 632 Properties |
| 2005 | £355,201.00 | 455 Properties |
| 2004 | £330,392.00 | 553 Properties |
| 2003 | £315,645.00 | 515 Properties |
| 2002 | £294,088.00 | 666 Properties |
| 2001 | £263,995.00 | 628 Properties |
| 2000 | £224,052.00 | 632 Properties |
| 1999 | £189,868.00 | 688 Properties |
| 1998 | £168,919.00 | 569 Properties |
| 1997 | £139,000.00 | 640 Properties |
| 1996 | £122,956.00 | 585 Properties |
| 1995 | £120,233.00 | 490 Properties |
Property Price per Property Type in N10
Here you can find historic sold price data in order to help with your property search.
The average Property Paid Price for specific property types in the last three years are:
| Property Type | Average Sold Price | Sold Properties |
|---|---|---|
| Semi Detached House | £1,502,939.00 | 122 Semi Detached Houses |
| Detached House | £1,655,416.00 | 24 Detached Houses |
| Terraced House | £1,376,450.00 | 243 Terraced Houses |
| Flat | £518,001.00 | 511 Flats |


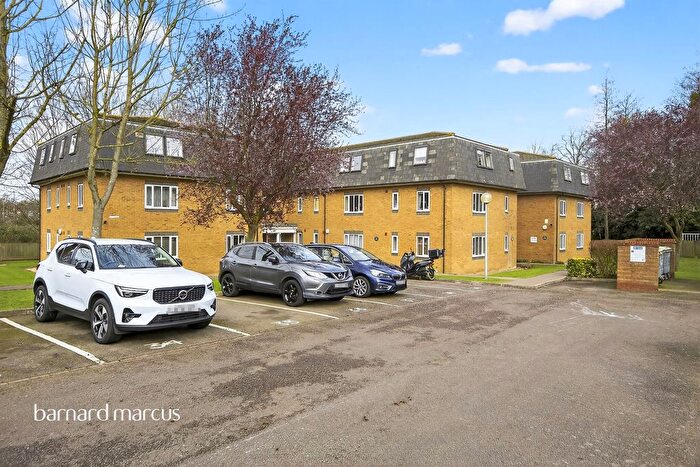
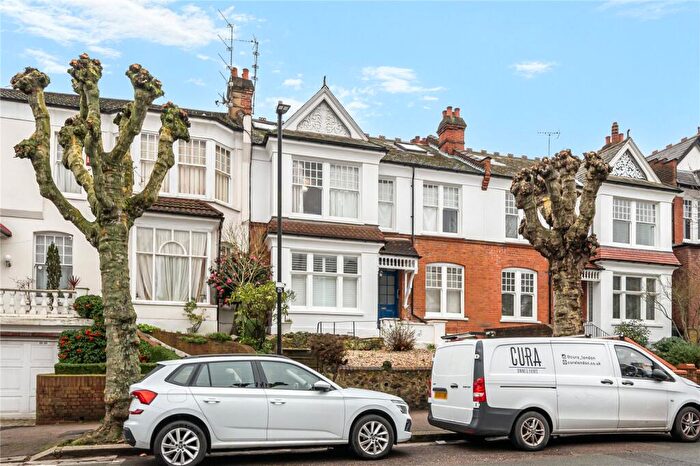
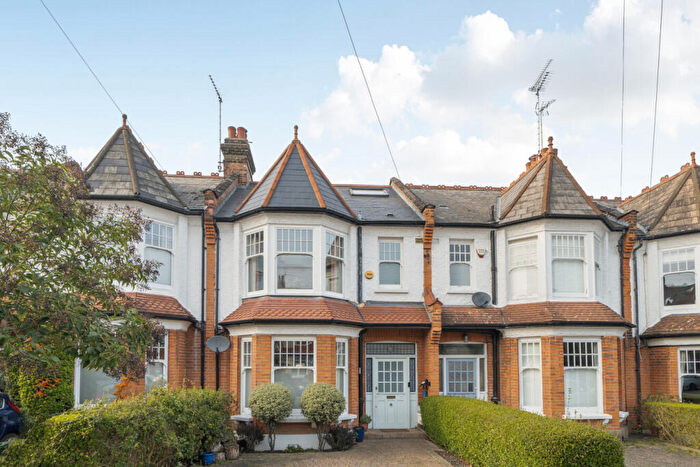
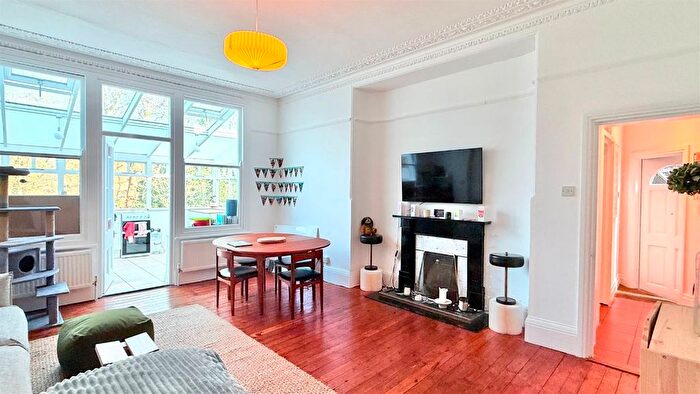
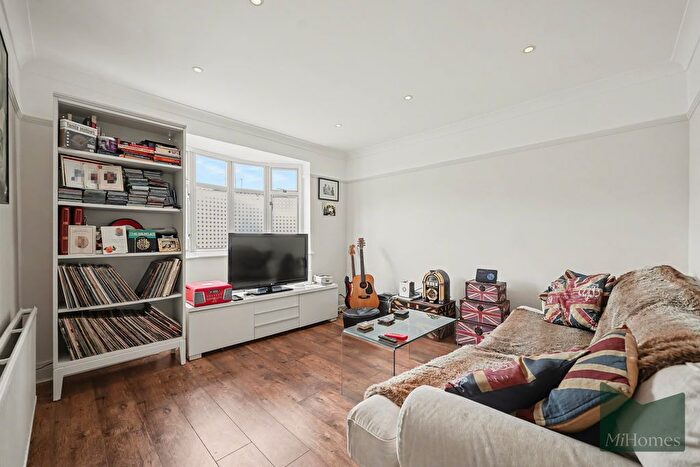
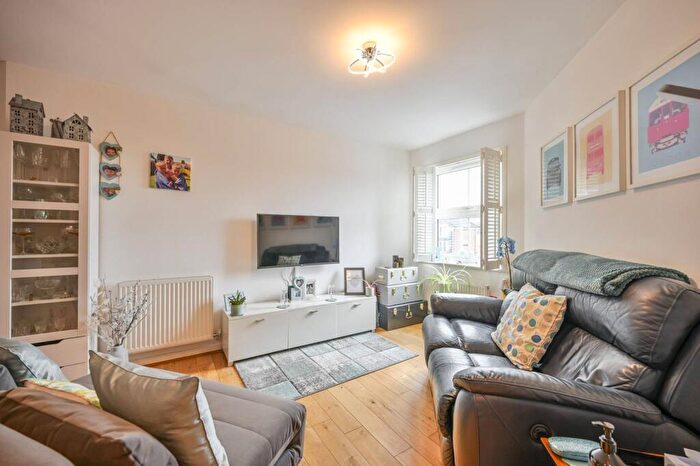
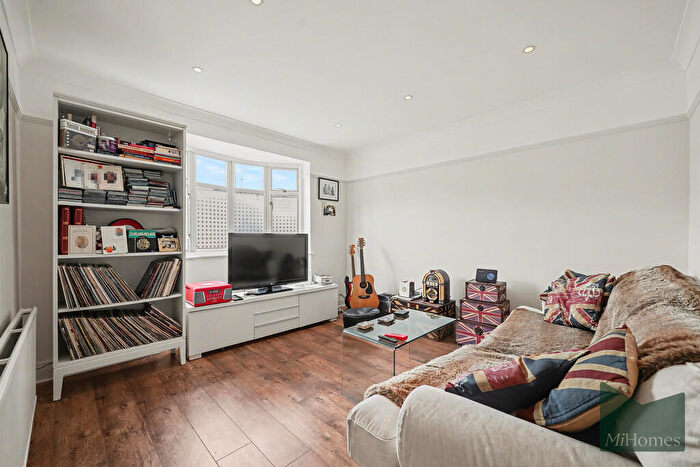
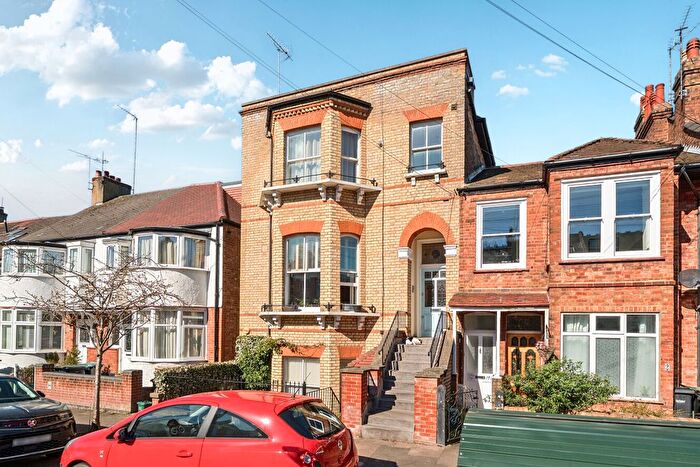
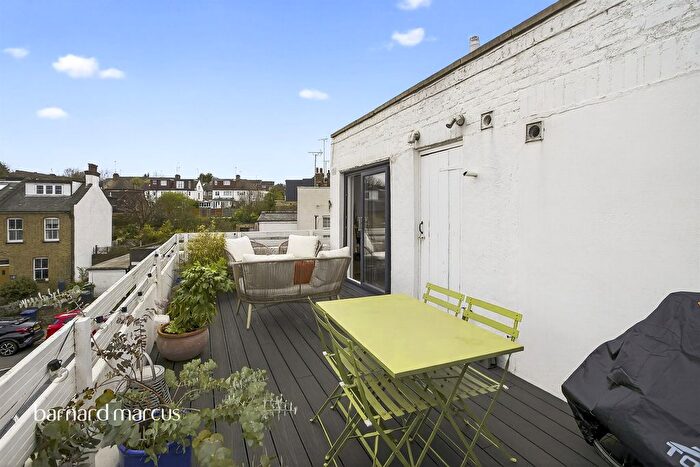
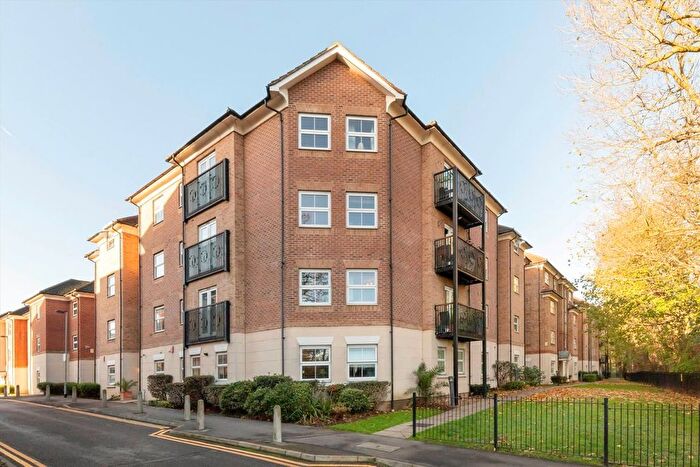
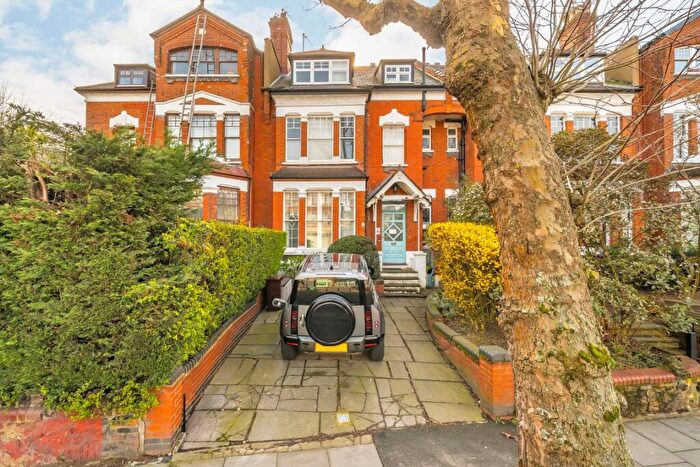
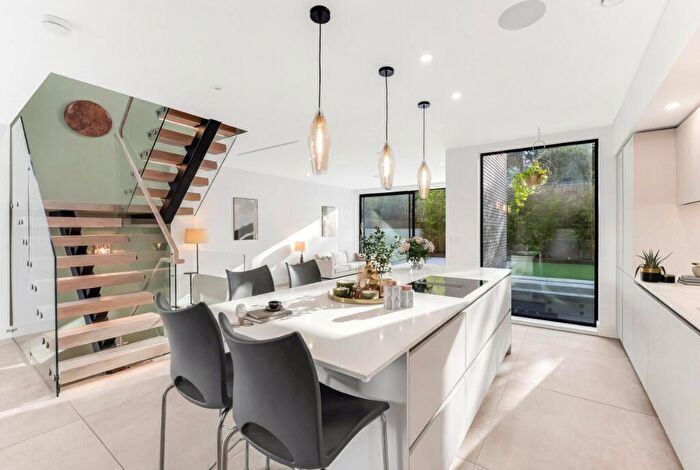
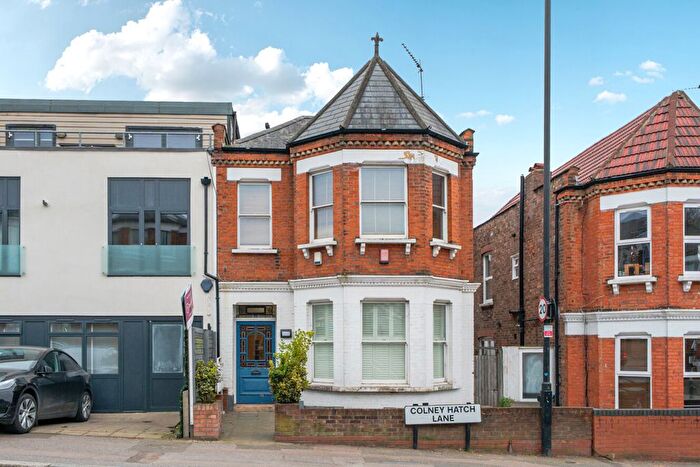
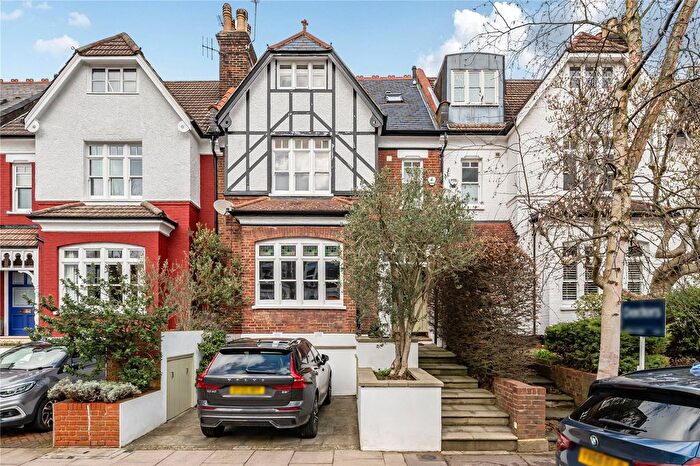
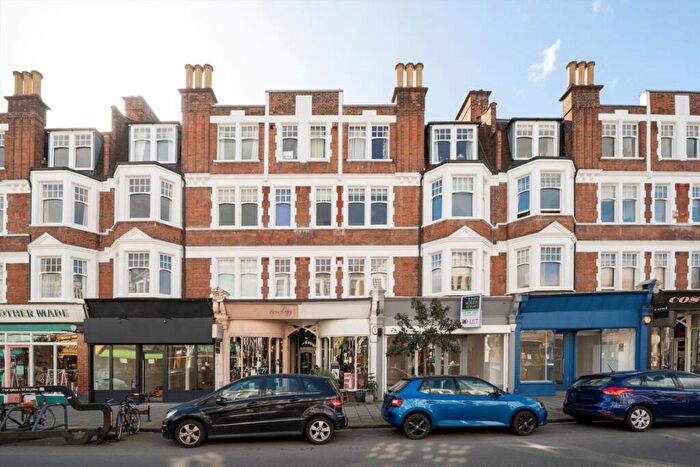
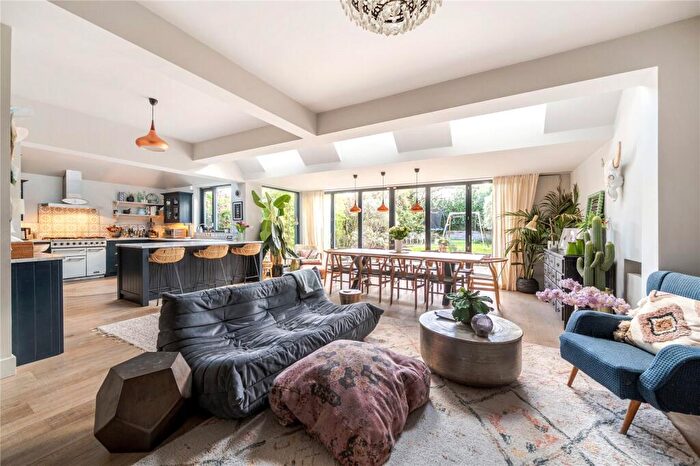
Houses and Flats for sale in N10, Muswell Hill
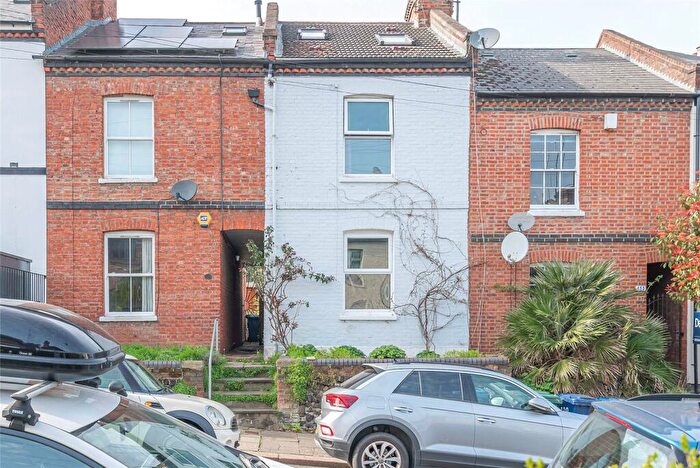
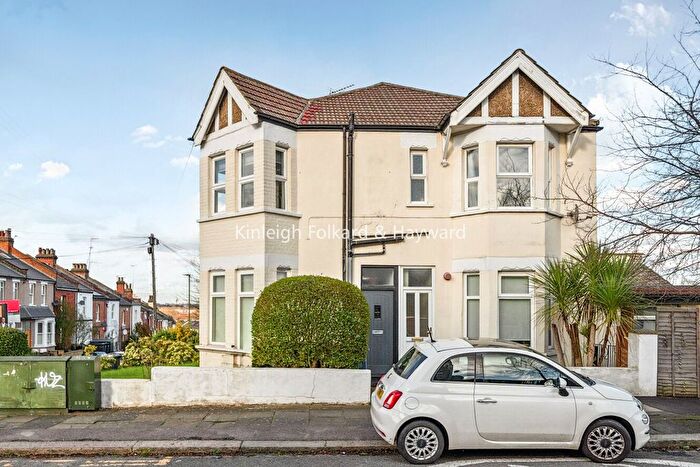
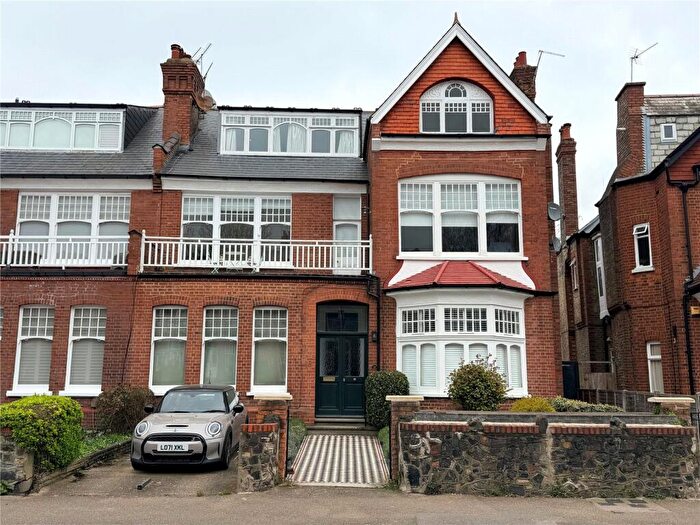


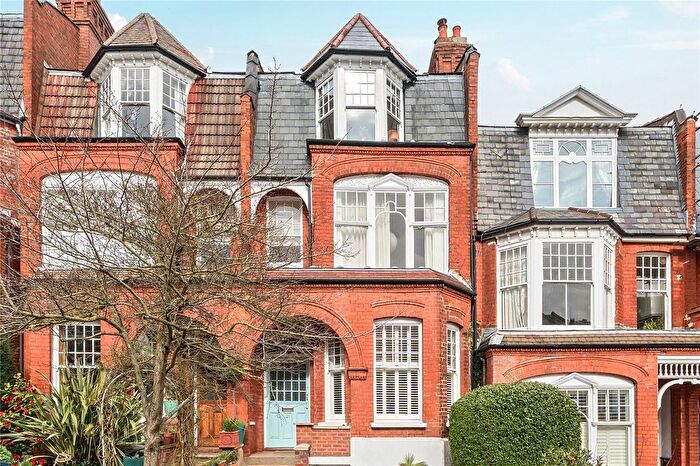
![]()
If you are looking to sell your house, let it out, or receive a property valuation, an expert can help you.
Click the button below to get started.


Frequently Asked Questions about N10
What is the average price for a property for sale in N10?
The average price for a property for sale in N10 is £913,627. There are 189 property listings for sale in N10.
Which areas are included in the N10 postcode district?
The main area within N10 is Muswell Hill.
What are the most common property types in N10?
The most common property types in N10 are Flats, Terraced Houses, Semi Detached Houses and Detached Houses.
What has been the average sold property price in N10 over the last three years?
Flats in N10 have an average sold price of £518,001, while Terraced Houses have an average of £1,376,450. Semi Detached Houses have an average of £1,502,939 and Detached Houses have an average of £1,655,416. The average sold property price in N10 over the last three years is approximately £839,702.