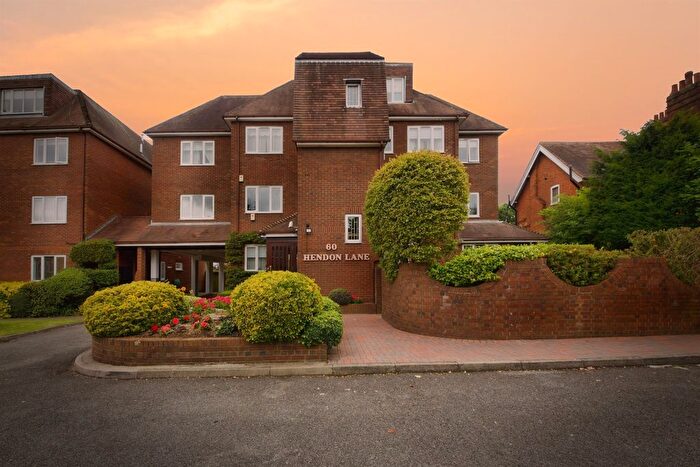
Properties for sale in N3
Finchley, Church End, Finchley Central
- Info
- Price Paid By Year
- Property Type Price
- Transport
House Prices in N3
Properties in N3 have an average house price of £788,910.00 and had 962 Property Transactions within the last 3 years.
The most expensive property was sold for £4,400,000.00.
Property Price Paid in N3 by Year
The average sold property price by year was:
| Year | Average Sold Price | Sold Properties |
|---|---|---|
| 2025 | £795,171.00 | 114 Properties |
| 2024 | £765,566.00 | 233 Properties |
| 2023 | £774,588.00 | 245 Properties |
| 2022 | £811,166.00 | 370 Properties |
| 2021 | £795,456.00 | 396 Properties |
| 2020 | £713,269.00 | 277 Properties |
| 2019 | £651,154.00 | 288 Properties |
| 2018 | £713,599.00 | 260 Properties |
| 2017 | £690,329.00 | 339 Properties |
| 2016 | £658,417.00 | 310 Properties |
| 2015 | £693,479.00 | 364 Properties |
| 2014 | £638,201.00 | 363 Properties |
| 2013 | £579,294.00 | 313 Properties |
| 2012 | £502,160.00 | 295 Properties |
| 2011 | £486,089.00 | 281 Properties |
| 2010 | £477,564.00 | 351 Properties |
| 2009 | £419,196.00 | 233 Properties |
| 2008 | £414,624.00 | 242 Properties |
| 2007 | £440,135.00 | 537 Properties |
| 2006 | £363,009.00 | 598 Properties |
| 2005 | £352,251.00 | 382 Properties |
| 2004 | £344,065.00 | 456 Properties |
| 2003 | £304,417.00 | 427 Properties |
| 2002 | £282,095.00 | 569 Properties |
| 2001 | £247,660.00 | 553 Properties |
| 2000 | £206,574.00 | 522 Properties |
| 1999 | £183,087.00 | 599 Properties |
| 1998 | £149,579.00 | 511 Properties |
| 1997 | £144,602.00 | 580 Properties |
| 1996 | £119,490.00 | 476 Properties |
| 1995 | £108,906.00 | 454 Properties |
Property Price per Property Type in N3
Here you can find historic sold price data in order to help with your property search.
The average Property Paid Price for specific property types in the last three years are:
| Property Type | Average Sold Price | Sold Properties |
|---|---|---|
| Semi Detached House | £1,054,399.00 | 242 Semi Detached Houses |
| Detached House | £1,791,613.00 | 84 Detached Houses |
| Terraced House | £786,526.00 | 149 Terraced Houses |
| Flat | £484,763.00 | 487 Flats |
Houses and Flats for sale in N3, Finchley, Church End, Finchley Central
Frequently Asked Questions about N3
What is the average price for a property for sale in N3?
The average price for a property for sale in N3 is £788,910. There are 199 property listings for sale in N3.
Which areas are included in the N3 postcode district?
The main areas within N3 include Finchley, Church End and Finchley Central.
What are the most common property types in N3?
The most common property types in N3 are Flats, Semi Detached Houses, Terraced Houses and Detached Houses.
What has been the average sold property price in N3 over the last three years?
Flats in N3 have an average sold price of £484,763, while Semi Detached Houses have an average of £1,054,399. Terraced Houses have an average of £786,526 and Detached Houses have an average of £1,791,613. The average sold property price in N3 over the last three years is approximately £778,442.
Which tube stations are available in N3?
The tube stations available in N3 are Finchley Central Station and West Finchley Station.


