
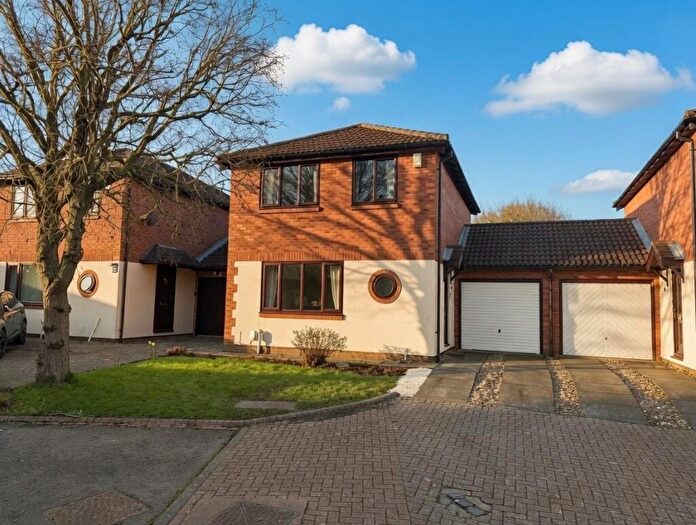
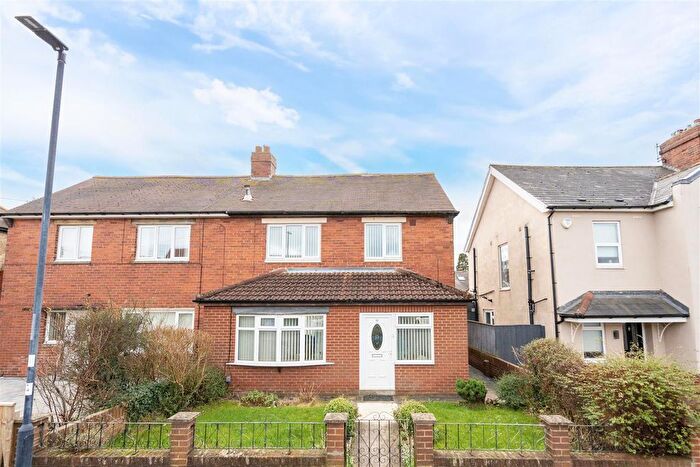
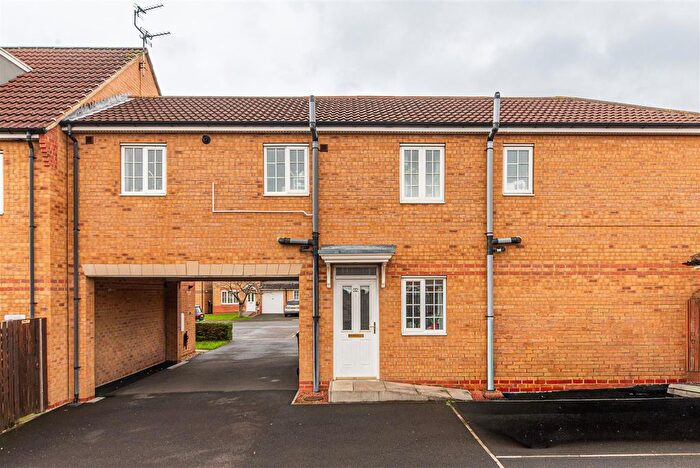
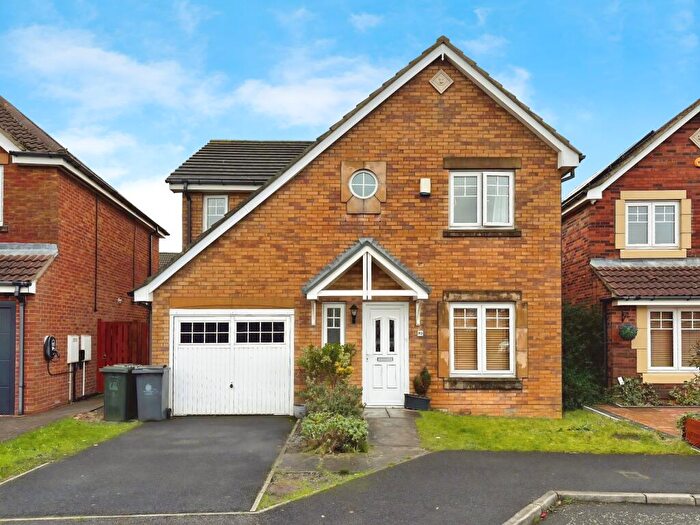
Properties for sale in NE12
Killingworth
- Info
- Price Paid By Year
- Property Type Price
- Transport
House Prices in NE12
Properties in NE12 have an average house price of £199,955.00 and had 1534 Property Transactions within the last 3 years.
The most expensive property was sold for £760,000.00.
Property Price Paid in NE12 by Year
The average sold property price by year was:
| Year | Average Sold Price | Sold Properties |
|---|---|---|
| 2025 | £209,628.00 | 456 Properties |
| 2024 | £196,774.00 | 524 Properties |
| 2023 | £195,002.00 | 554 Properties |
| 2022 | £204,010.00 | 619 Properties |
| 2021 | £180,759.00 | 685 Properties |
| 2020 | £181,690.00 | 565 Properties |
| 2019 | £182,676.00 | 620 Properties |
| 2018 | £180,552.00 | 776 Properties |
| 2017 | £186,612.00 | 705 Properties |
| 2016 | £161,270.00 | 635 Properties |
| 2015 | £158,953.00 | 699 Properties |
| 2014 | £143,736.00 | 655 Properties |
| 2013 | £149,707.00 | 477 Properties |
| 2012 | £140,431.00 | 372 Properties |
| 2011 | £140,727.00 | 386 Properties |
| 2010 | £149,366.00 | 370 Properties |
| 2009 | £136,355.00 | 408 Properties |
| 2008 | £144,410.00 | 380 Properties |
| 2007 | £149,903.00 | 823 Properties |
| 2006 | £148,800.00 | 873 Properties |
| 2005 | £139,580.00 | 813 Properties |
| 2004 | £128,719.00 | 825 Properties |
| 2003 | £105,266.00 | 806 Properties |
| 2002 | £81,157.00 | 841 Properties |
| 2001 | £65,726.00 | 760 Properties |
| 2000 | £62,780.00 | 645 Properties |
| 1999 | £62,230.00 | 809 Properties |
| 1998 | £61,867.00 | 726 Properties |
| 1997 | £57,576.00 | 562 Properties |
| 1996 | £51,596.00 | 465 Properties |
| 1995 | £56,404.00 | 381 Properties |
Property Price per Property Type in NE12
Here you can find historic sold price data in order to help with your property search.
The average Property Paid Price for specific property types in the last three years are:
| Property Type | Average Sold Price | Sold Properties |
|---|---|---|
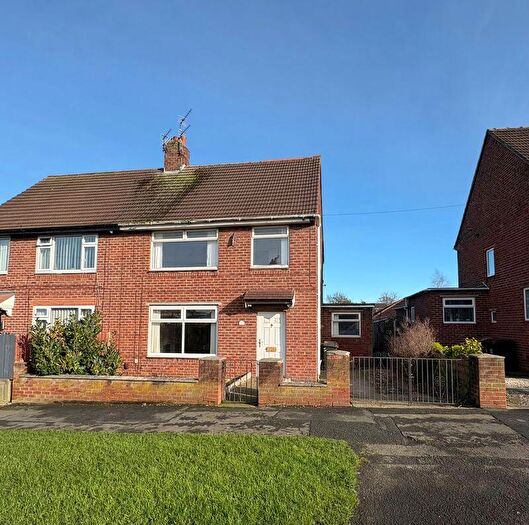
| Semi Detached House | £206,753.00 | 527 Semi Detached Houses |
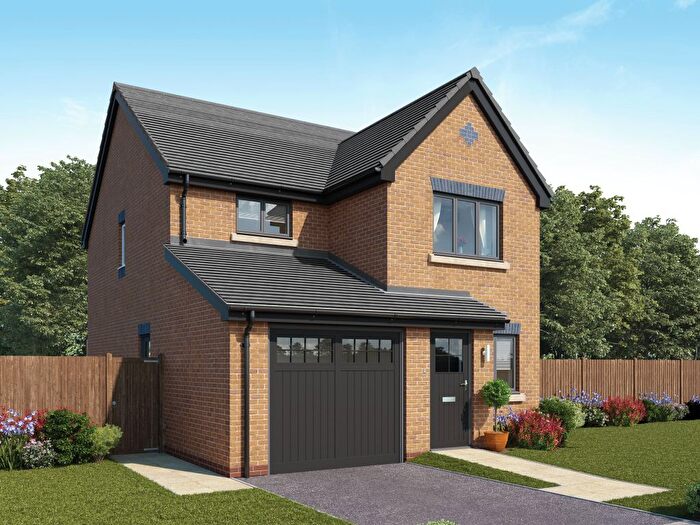
| Detached House | £334,194.00 | 239 Detached Houses |
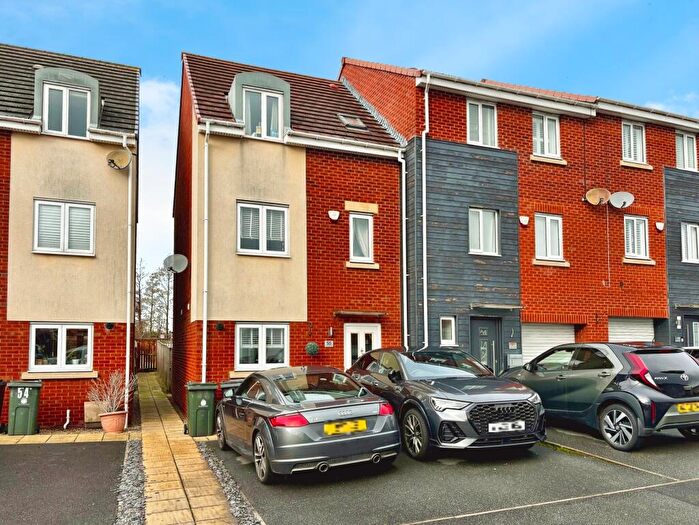
| Terraced House | £175,726.00 | 518 Terraced Houses |
| Flat | £107,496.00 | 250 Flats |
Transport near NE12

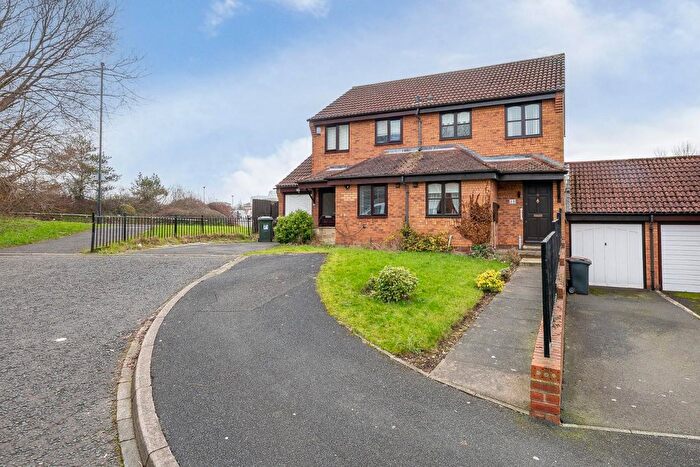
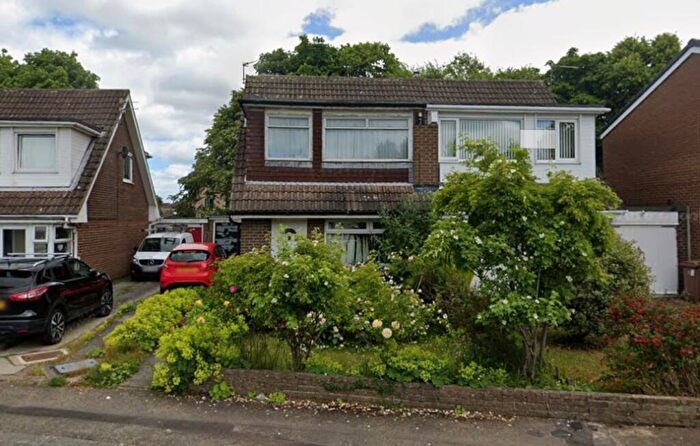
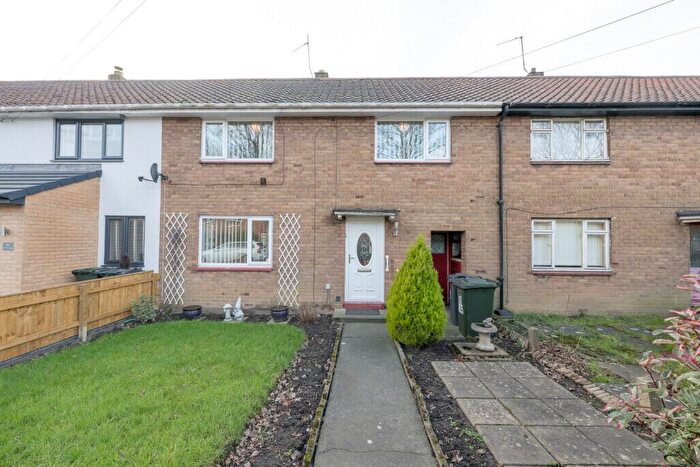
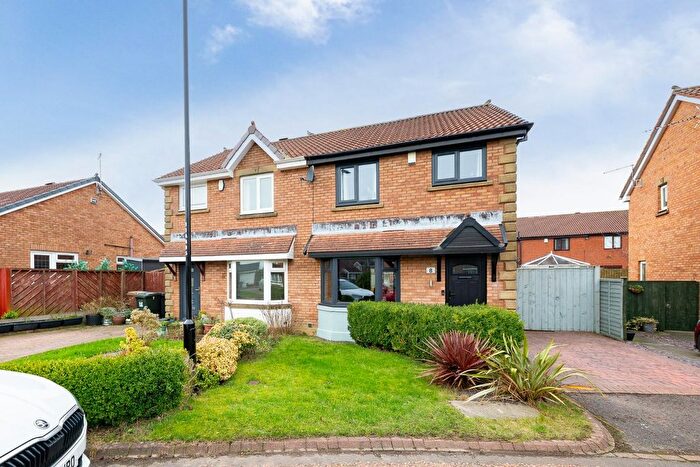
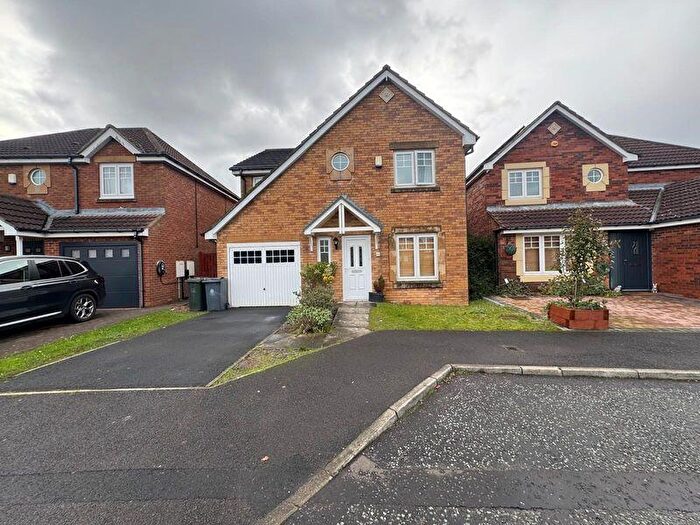
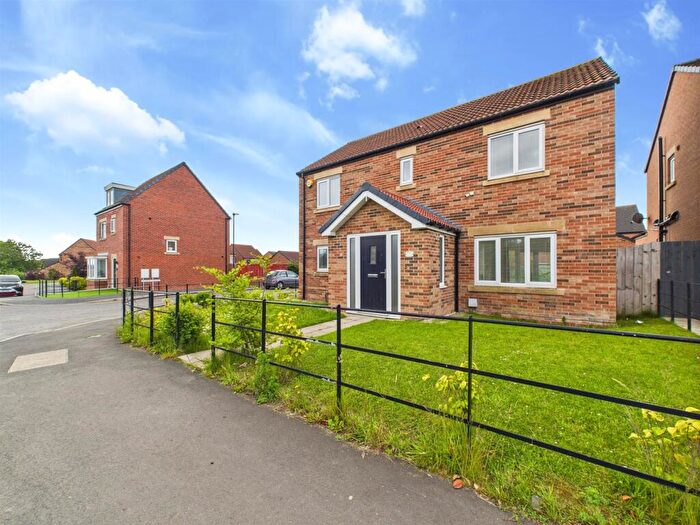
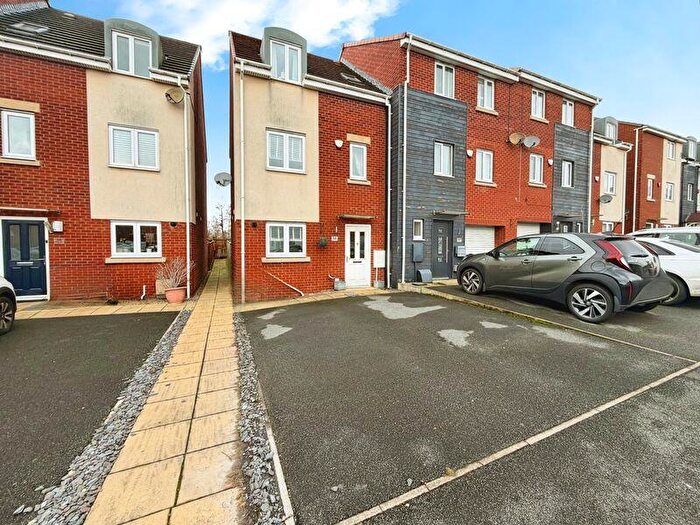
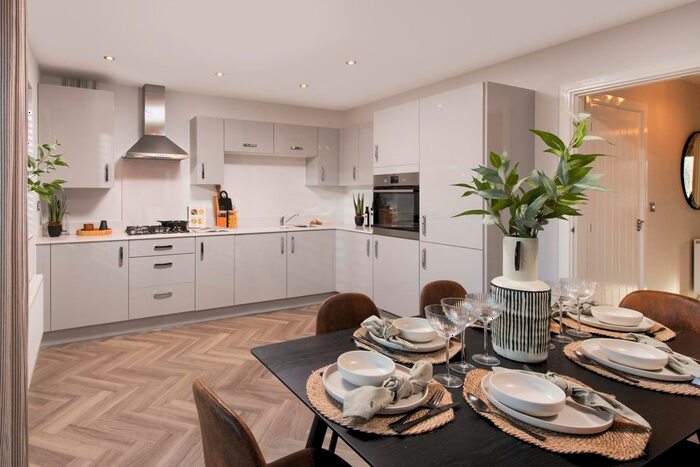
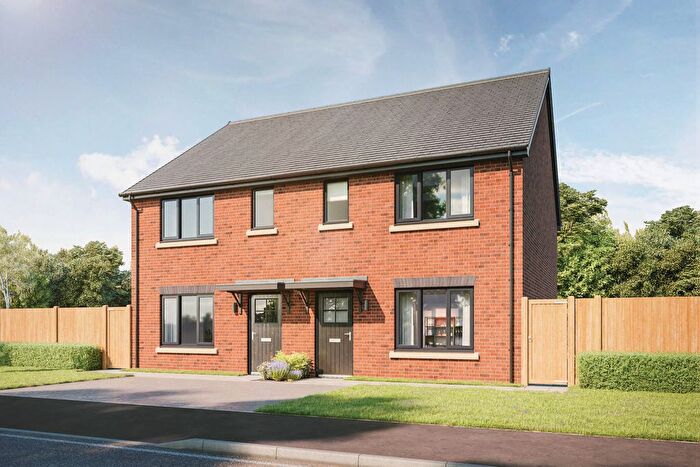
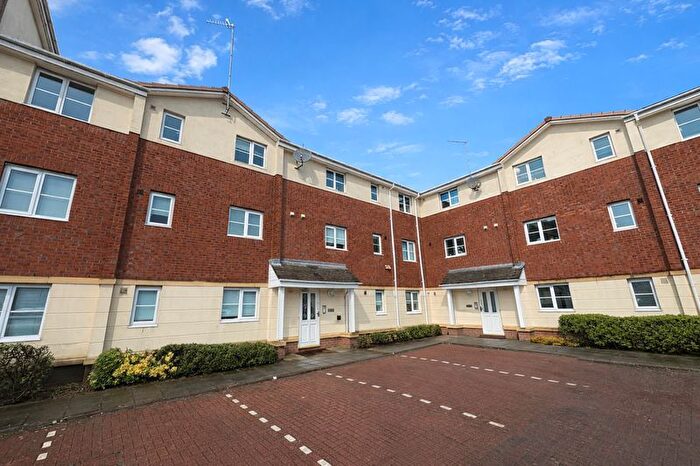
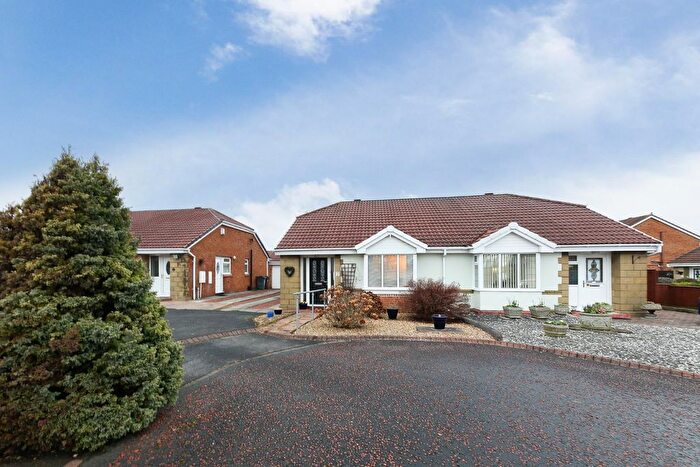
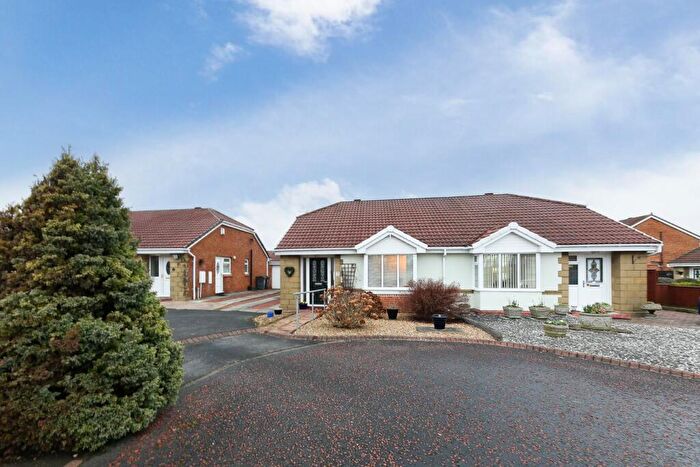
Houses and Flats for sale in NE12, Killingworth

![]()
If you are looking to sell your house, let it out, or receive a property valuation, an expert can help you.
Click the button below to get started.


Frequently Asked Questions about NE12
What is the average price for a property for sale in NE12?
The average price for a property for sale in NE12 is £199,955. There are 111 property listings for sale in NE12.
Which areas are included in the NE12 postcode district?
The main area within NE12 is Killingworth.
What are the most common property types in NE12?
The most common property types in NE12 are Semi Detached Houses, Terraced Houses, Flats and Detached Houses.
What has been the average sold property price in NE12 over the last three years?
Semi Detached Houses in NE12 have an average sold price of £206,753, while Terraced Houses have an average of £175,726. Flats have an average of £107,496 and Detached Houses have an average of £334,194. The average sold property price in NE12 over the last three years is approximately £200,468.