
Properties for sale in NE
Newcastle upon Tyne
- Info
- Price Paid By Year
- Property Type Price
House Prices in NE
Properties in NE have an average house price of £210,122 and had 49015 Property Transactions within the last 3 years.
The most expensive property was sold for £6,000,000.
Property Price Paid in NE by Year
The average sold property price by year was:
| Year | Average Sold Price | Sold Properties |
|---|---|---|
| 2026 | £211,253.00 | 1,124 Properties |
| 2025 | £217,916.00 | 15,034 Properties |
| 2024 | £208,284.00 | 16,844 Properties |
| 2023 | £204,657.00 | 16,013 Properties |
| 2022 | £202,686.00 | 18,624 Properties |
| 2021 | £199,319.00 | 21,881 Properties |
| 2020 | £189,555.00 | 16,997 Properties |
| 2019 | £179,862.00 | 19,079 Properties |
| 2018 | £178,416.00 | 19,531 Properties |
| 2017 | £173,461.00 | 19,668 Properties |
| 2016 | £170,434.00 | 18,797 Properties |
| 2015 | £164,461.00 | 18,311 Properties |
| 2014 | £158,274.00 | 17,862 Properties |
| 2013 | £154,161.00 | 14,238 Properties |
| 2012 | £153,089.00 | 11,881 Properties |
| 2011 | £150,674.00 | 12,070 Properties |
| 2010 | £159,591.00 | 11,427 Properties |
| 2009 | £154,650.00 | 11,039 Properties |
| 2008 | £158,012.00 | 12,914 Properties |
| 2007 | £155,882.00 | 26,475 Properties |
| 2006 | £149,206.00 | 26,241 Properties |
| 2005 | £137,550.00 | 21,979 Properties |
| 2004 | £129,576.00 | 25,087 Properties |
| 2003 | £107,683.00 | 26,393 Properties |
| 2002 | £85,895.00 | 25,934 Properties |
| 2001 | £72,879.00 | 23,515 Properties |
| 2000 | £66,592.00 | 21,483 Properties |
| 1999 | £63,341.00 | 20,800 Properties |
| 1998 | £59,651.00 | 19,450 Properties |
| 1997 | £56,833.00 | 19,085 Properties |
| 1996 | £53,612.00 | 17,282 Properties |
| 1995 | £51,820.00 | 14,797 Properties |
Property Price per Property Type in NE
Here you can find historic sold price data in order to help with your property search.
The average Property Paid Price for specific property types in the last three years are:
| Property Type | Average Sold Price | Sold Properties |
|---|---|---|
| Semi Detached House | £210,559.00 | 15,086 Semi Detached Houses |
| Terraced House | £179,392.00 | 16,989 Terraced Houses |
| Detached House | £386,939.00 | 7,574 Detached Houses |
| Flat | £122,171.00 | 9,366 Flats |
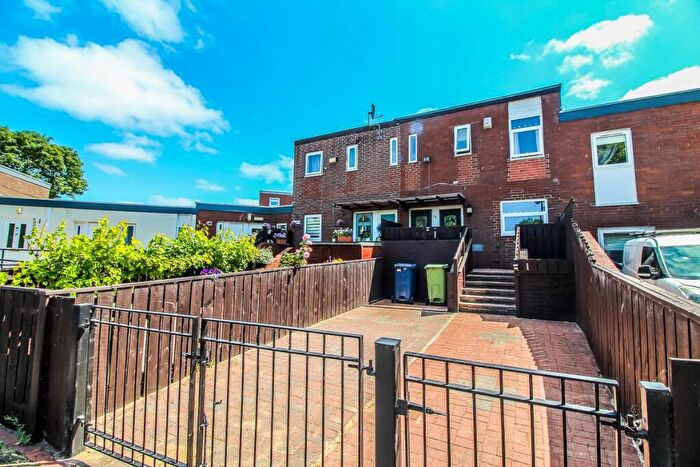
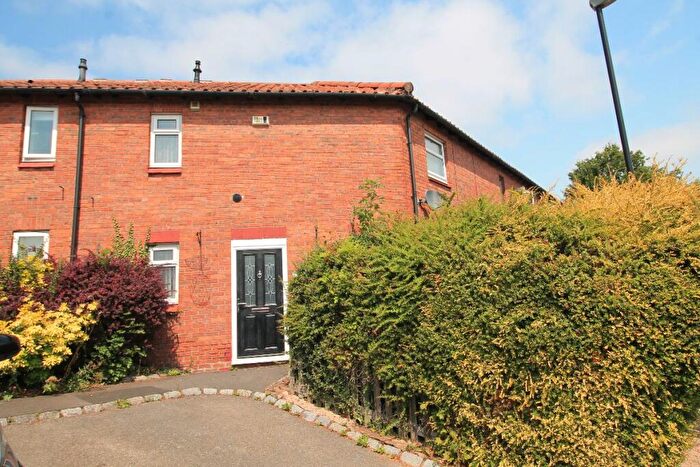
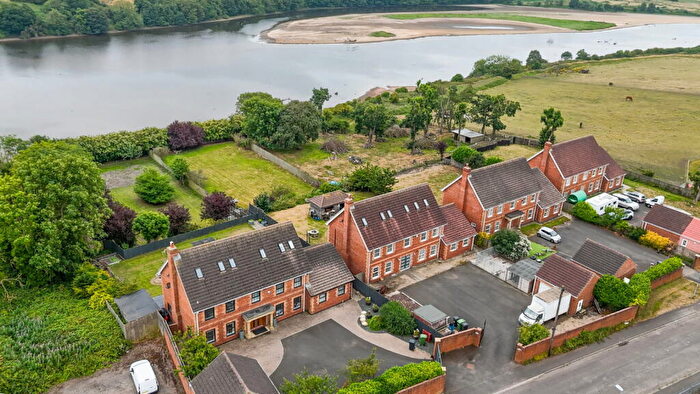
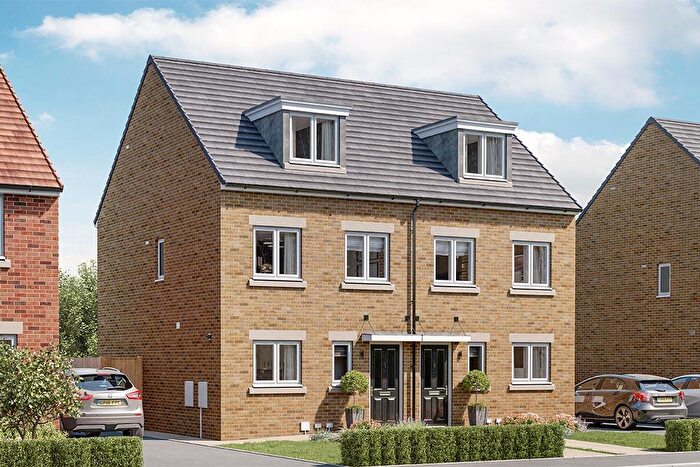
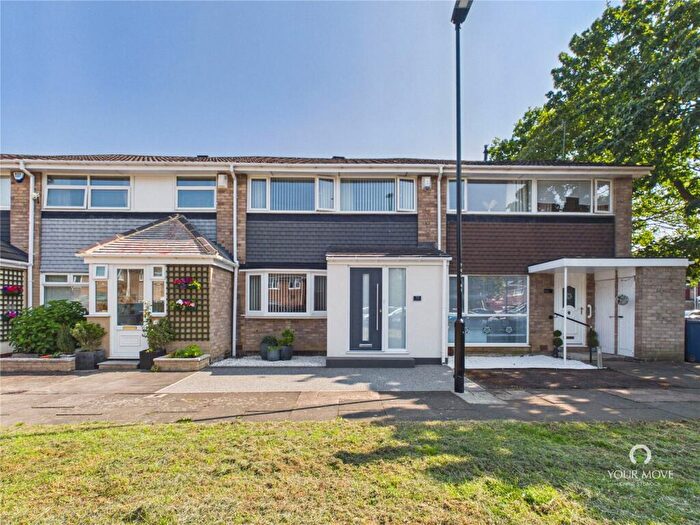
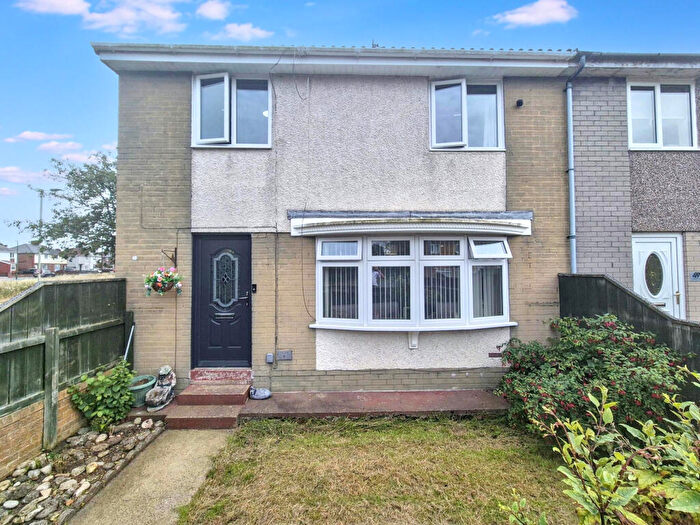
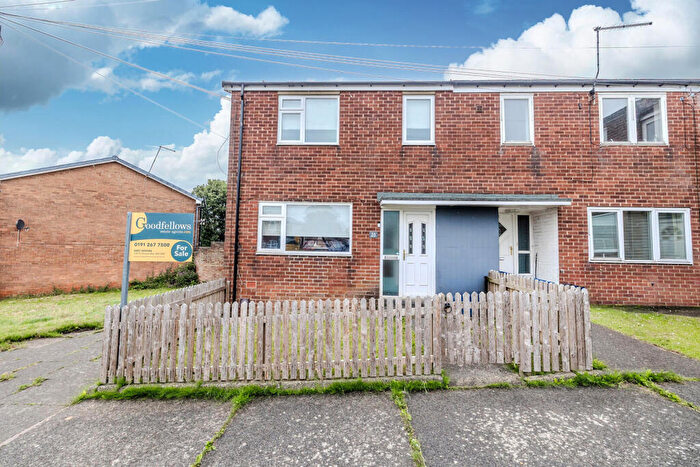
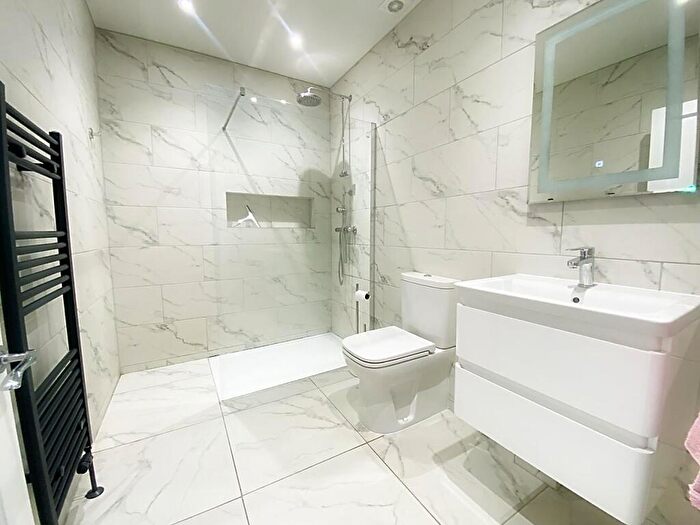
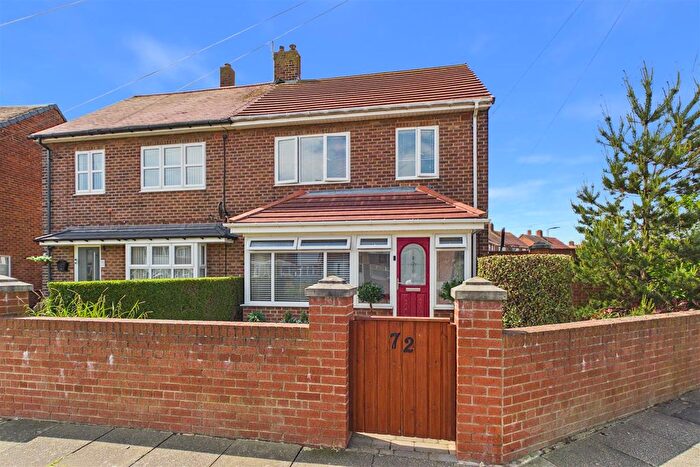
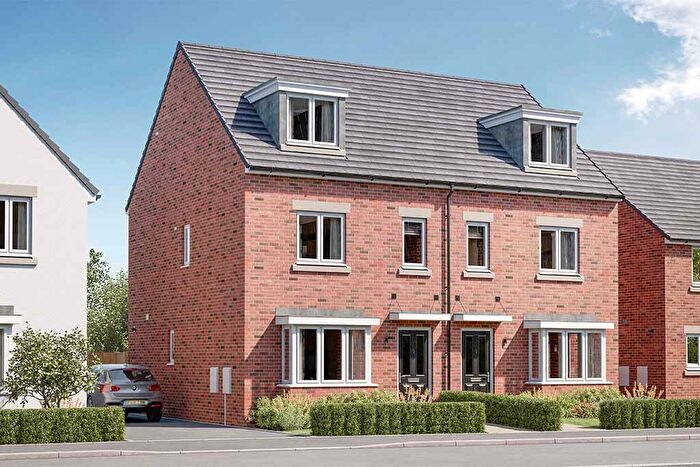
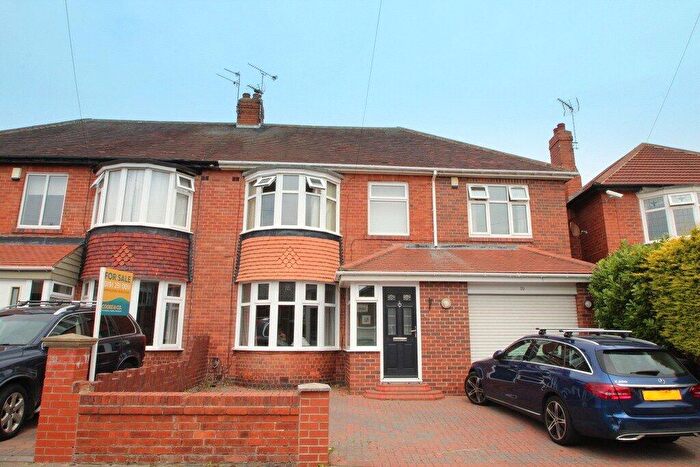
Houses and Flats for sale in NE, Newcastle upon Tyne
There are 4,201 results. Property prices in NE range from £10k to £20M with an average price of £304k.

![]()
If you are looking to sell your house, let it out, or receive a property valuation, an expert can help you.
Click the button below to get started.
Postcode districts in NE, Newcastle upon Tyne
Navigate through our locations to find the location of your next house in NE, Newcastle upon Tyne, England for sale or to rent.
- NE65
- NE5
- NE82
- NE62
- NE28
- NE35
- NE83
- NE23
- NE15
- NE70
- NE32
- NE20
- NE13
- NE6
- NE63
- NE38
- NE2
- NE45
- NE69
- NE36
- NE49
- NE85
- NE68
- NE9
- NE40
- NE43
- NE19
- NE34
- NE16
- NE66
- NE88
- NE39
- NE11
- NE41
- NE17
- NE37
- NE61
- NE7
- NE22
- NE4
- NE31
- NE64
- NE3
- NE71
- NE67
- NE12
- NE92
- NE10
- NE44
- NE33
- NE29
- NE47
- NE18
- NE1
- NE98
- NE24
- NE48
- NE30
- NE99
- NE25
- NE46
- NE21
- NE8
- NE42
- NE26
- NE27
Transport in NE, Newcastle upon Tyne
Please see below transportation links in this area:
-
 Cramlington Station
 -
Manors Station
-
Newcastle Station
-
MetroCentre Station
-
Blaydon Station
-
Dunston Station
-
Heworth Station
-
Wylam Station
-
Morpeth Station
-
Pegswood Station
Frequently asked questions about NE
What is the average price for a property for sale in NE?
The average price for a property for sale in NE is £210,122. This amount is 41% lower than the average price in England. There are 4,201 property listings for sale in NE.
What locations have the most expensive properties for sale in NE?
The locations with the most expensive properties for sale in NE are NE20 at an average of £549,761, NE69 at an average of £547,380 and NE44 at an average of £533,440.
What locations have the most affordable properties for sale in NE?
The locations with the most affordable properties for sale in NE are NE17 at an average of £103,507, NE63 at an average of £122,471 and NE37 at an average of £124,683.
Which train stations are available in or near NE?
Some of the train stations available in or near NE are Cramlington, Manors and Newcastle.