
Properties for sale in NE23
Cramlington
- Info
- Price Paid By Year
- Property Type Price
- Transport
House Prices in NE23
Properties in NE23 have an average house price of £183,249.00 and had 1573 Property Transactions within the last 3 years.
The most expensive property was sold for £738,000.00.
Property Price Paid in NE23 by Year
The average sold property price by year was:
| Year | Average Sold Price | Sold Properties |
|---|---|---|
| 2026 | £187,954.00 | 11 Properties |
| 2025 | £190,290.00 | 483 Properties |
| 2024 | £179,510.00 | 586 Properties |
| 2023 | £180,692.00 | 493 Properties |
| 2022 | £179,981.00 | 617 Properties |
| 2021 | £180,465.00 | 833 Properties |
| 2020 | £173,689.00 | 600 Properties |
| 2019 | £166,656.00 | 751 Properties |
| 2018 | £154,746.00 | 668 Properties |
| 2017 | £150,236.00 | 594 Properties |
| 2016 | £150,209.00 | 504 Properties |
| 2015 | £142,940.00 | 548 Properties |
| 2014 | £137,550.00 | 566 Properties |
| 2013 | £128,835.00 | 418 Properties |
| 2012 | £130,591.00 | 365 Properties |
| 2011 | £128,047.00 | 346 Properties |
| 2010 | £127,459.00 | 333 Properties |
| 2009 | £132,475.00 | 294 Properties |
| 2008 | £133,504.00 | 363 Properties |
| 2007 | £137,093.00 | 844 Properties |
| 2006 | £133,905.00 | 898 Properties |
| 2005 | £121,535.00 | 578 Properties |
| 2004 | £115,906.00 | 835 Properties |
| 2003 | £93,501.00 | 930 Properties |
| 2002 | £75,541.00 | 1,028 Properties |
| 2001 | £60,493.00 | 955 Properties |
| 2000 | £57,997.00 | 933 Properties |
| 1999 | £55,857.00 | 898 Properties |
| 1998 | £52,020.00 | 831 Properties |
| 1997 | £51,491.00 | 846 Properties |
| 1996 | £49,309.00 | 732 Properties |
| 1995 | £45,265.00 | 619 Properties |
Property Price per Property Type in NE23
Here you can find historic sold price data in order to help with your property search.
The average Property Paid Price for specific property types in the last three years are:
| Property Type | Average Sold Price | Sold Properties |
|---|---|---|
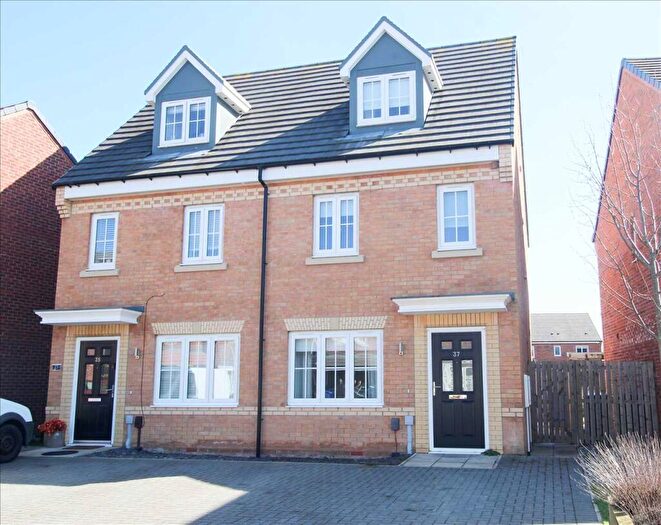
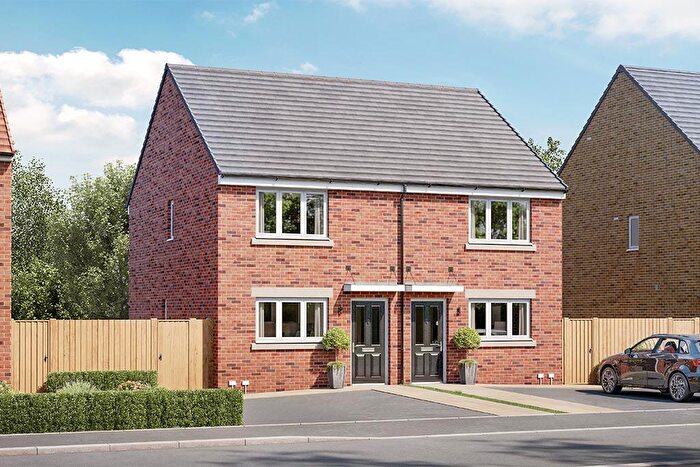
| Semi Detached House | £174,190.00 | 532 Semi Detached Houses |
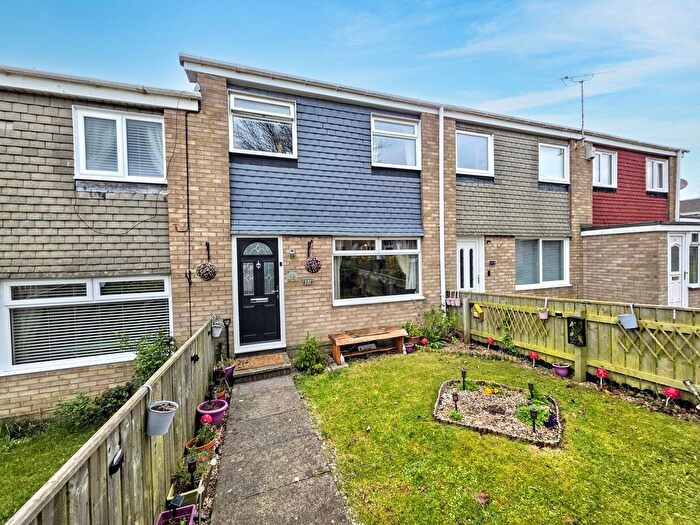
| Terraced House | £138,892.00 | 530 Terraced Houses |
| Detached House | £311,064.00 | 352 Detached Houses |
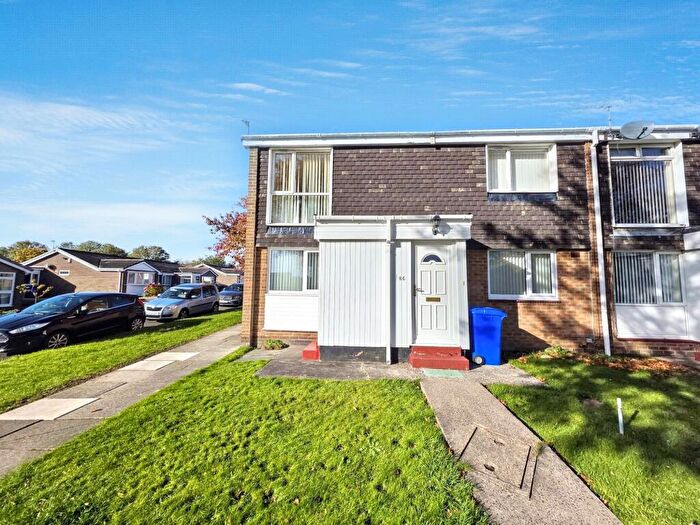
| Flat | £78,457.00 | 159 Flats |

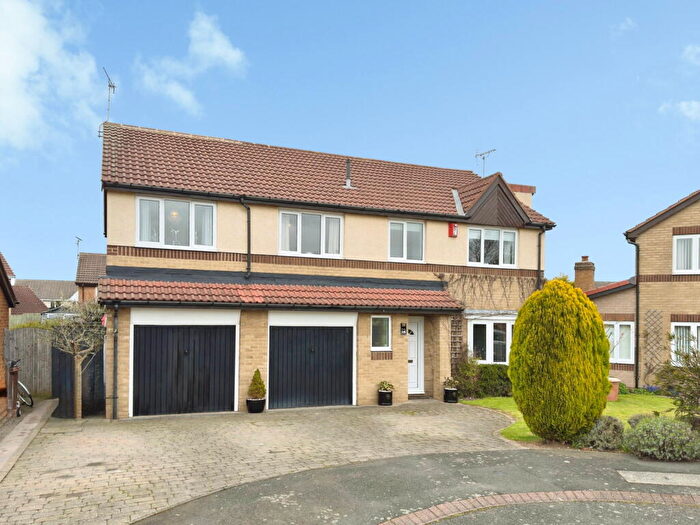
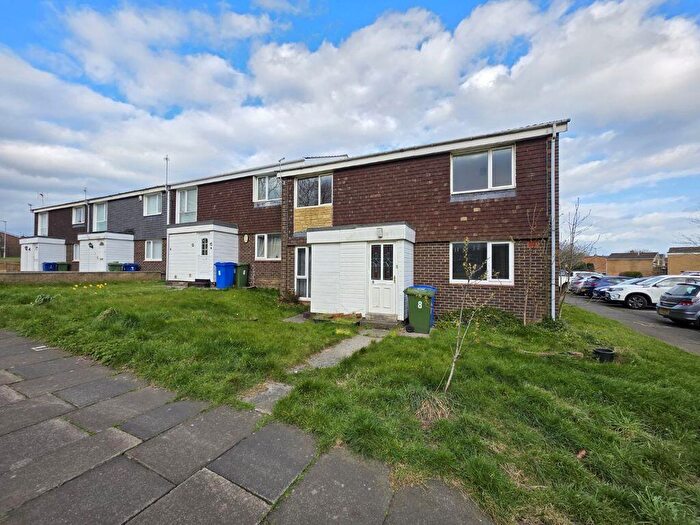
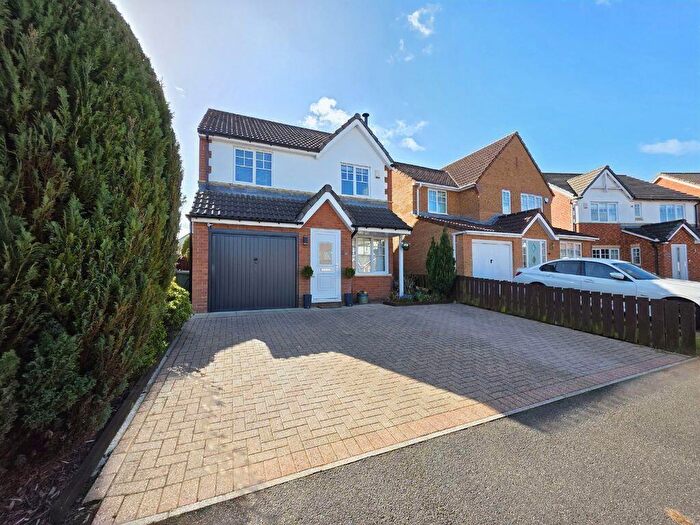
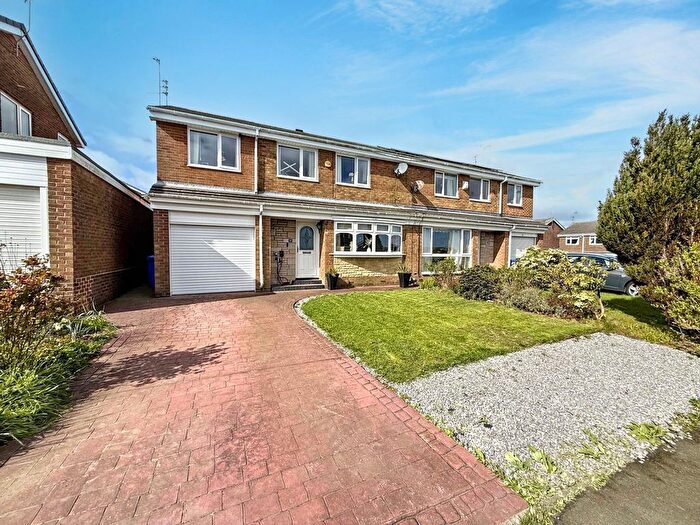
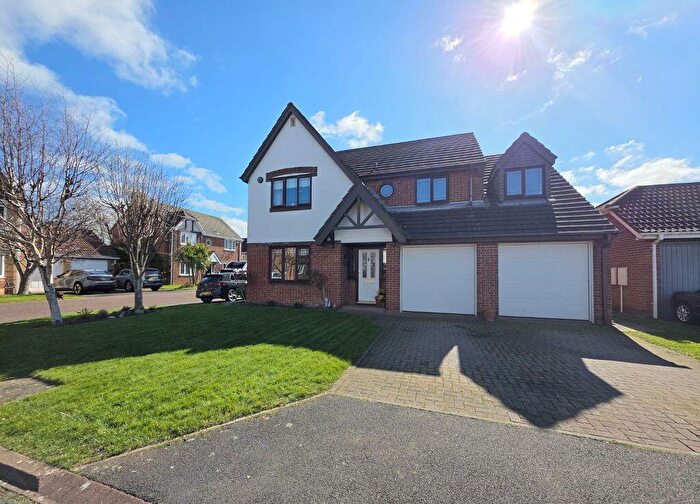
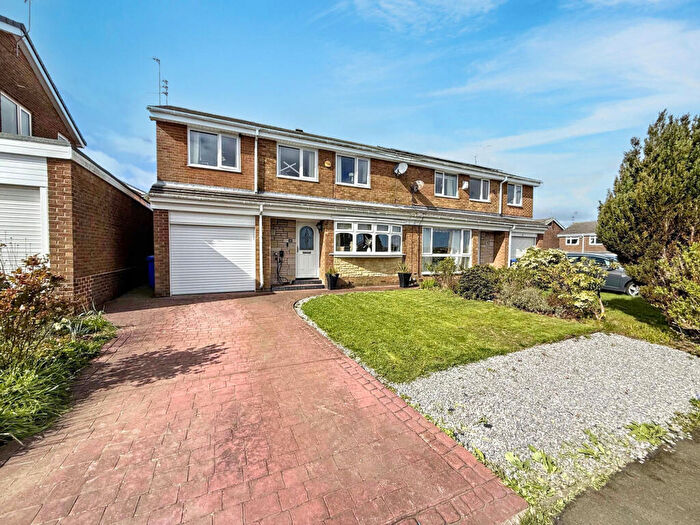
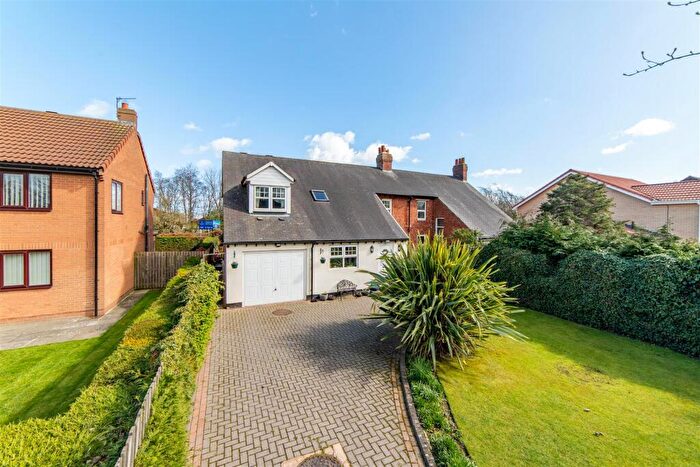
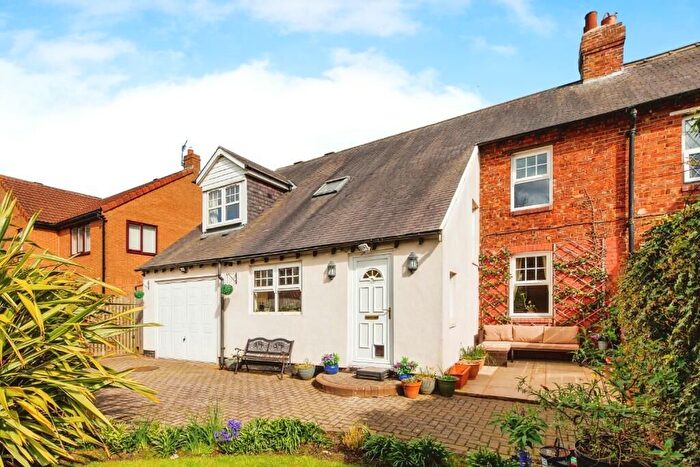
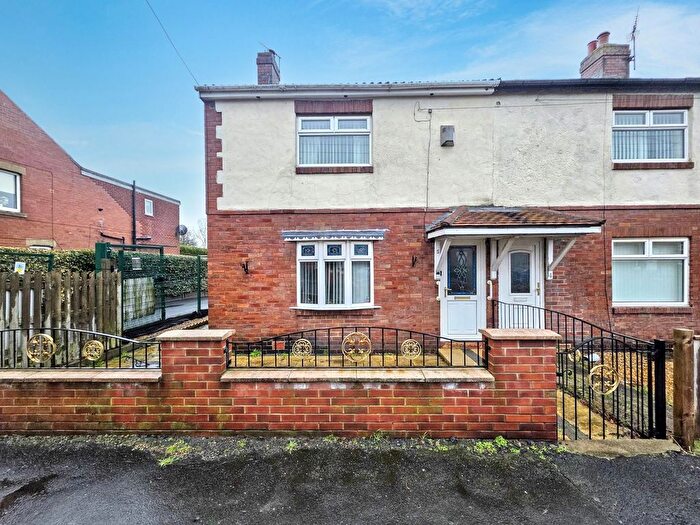
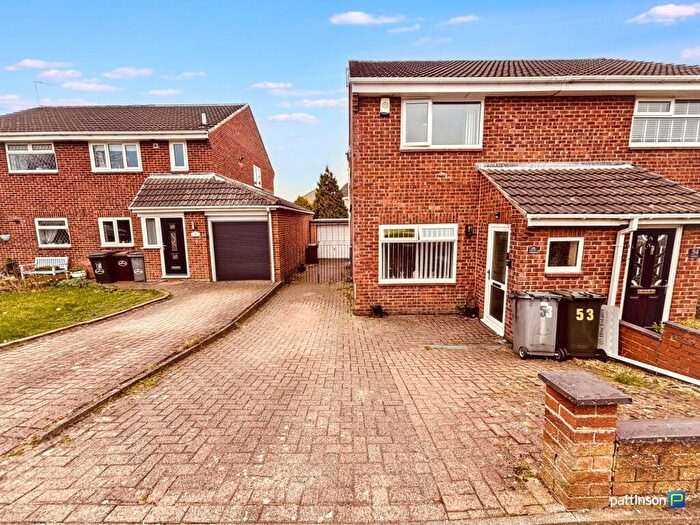
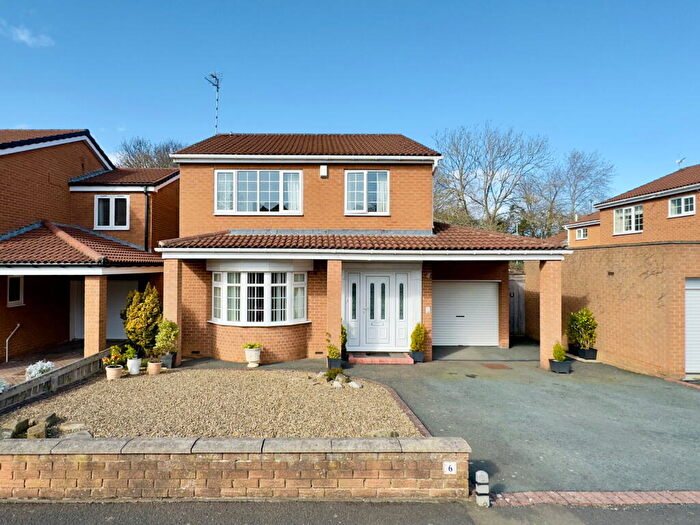
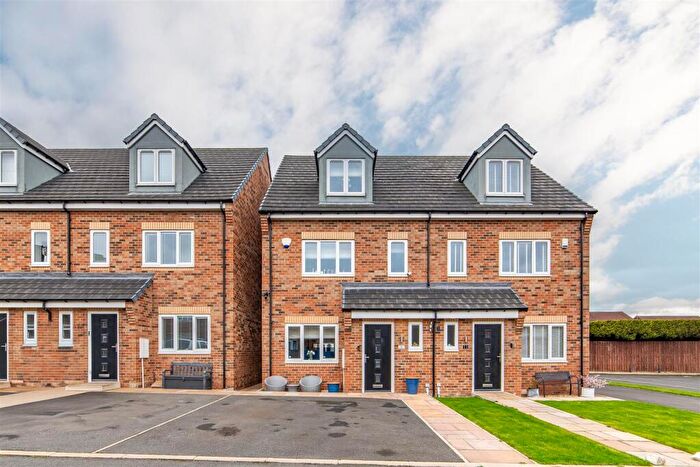
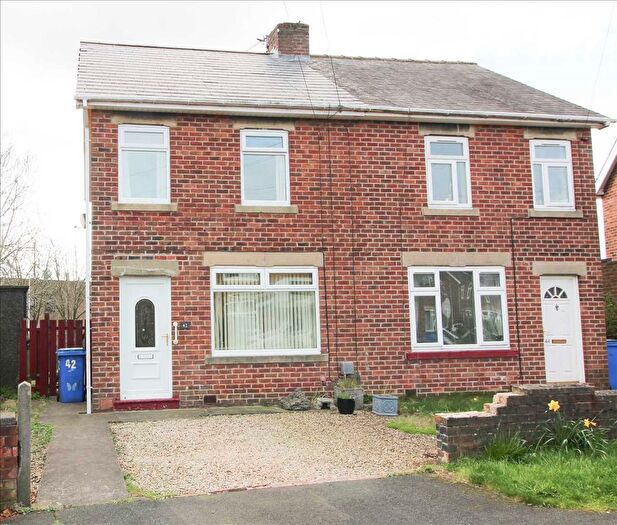
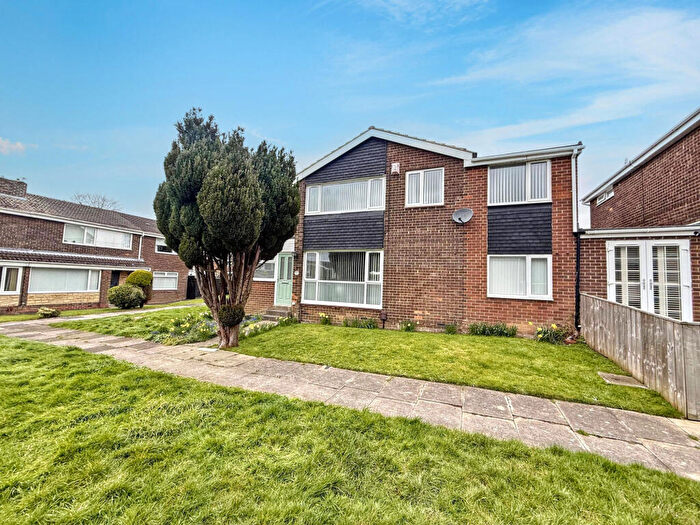
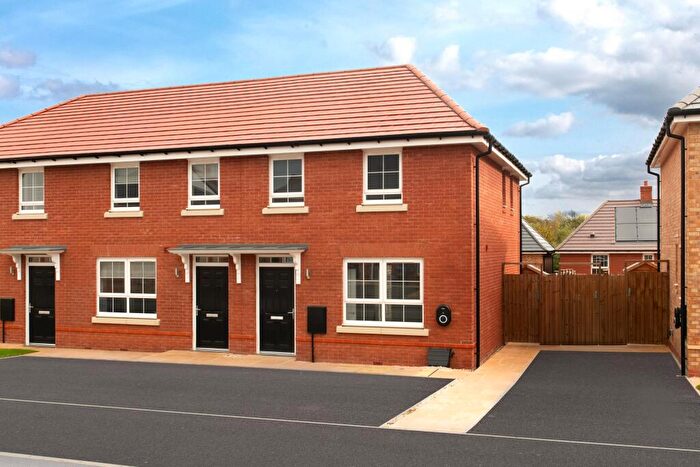
Houses and Flats for sale in NE23, Cramlington
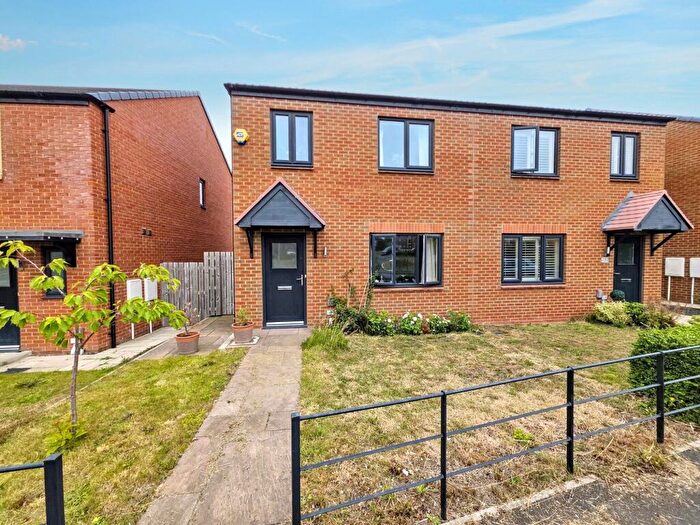
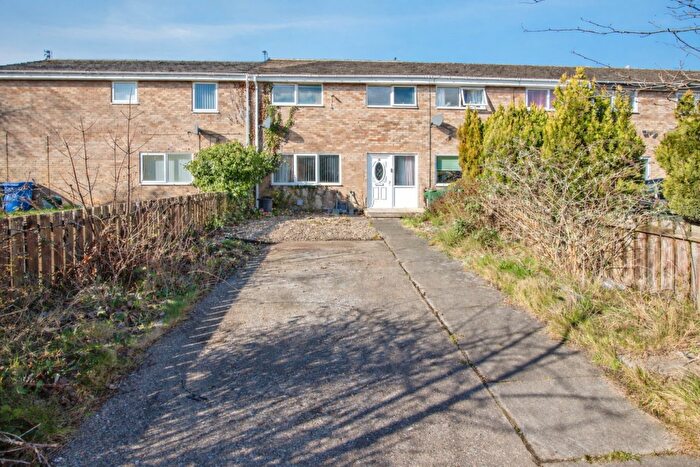
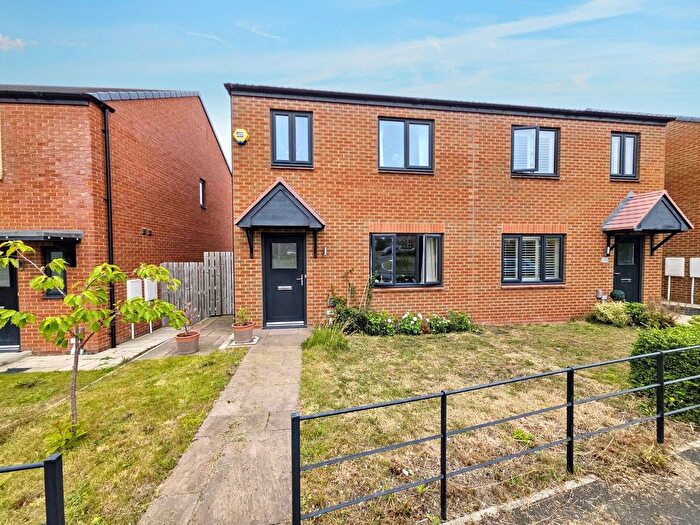
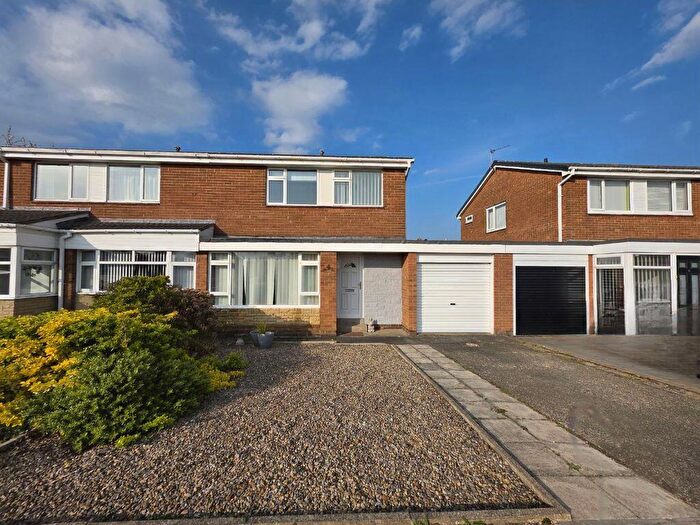
![]()
If you are looking to sell your house, let it out, or receive a property valuation, an expert can help you.
Click the button below to get started.

Frequently Asked Questions about NE23
What is the average price for a property for sale in NE23?
The average price for a property for sale in NE23 is £183,249. There are 186 property listings for sale in NE23.
Which areas are included in the NE23 postcode district?
The main area within NE23 is Cramlington.
What are the most common property types in NE23?
The most common property types in NE23 are Semi Detached Houses, Terraced Houses, Detached Houses and Flats.
What has been the average sold property price in NE23 over the last three years?
Semi Detached Houses in NE23 have an average sold price of £174,190, while Terraced Houses have an average of £138,892. Detached Houses have an average of £311,064 and Flats have an average of £78,457. The average sold property price in NE23 over the last three years is approximately £185,918.
Which train stations are available in NE23?
The train station available in NE23 is Cramlington Station..