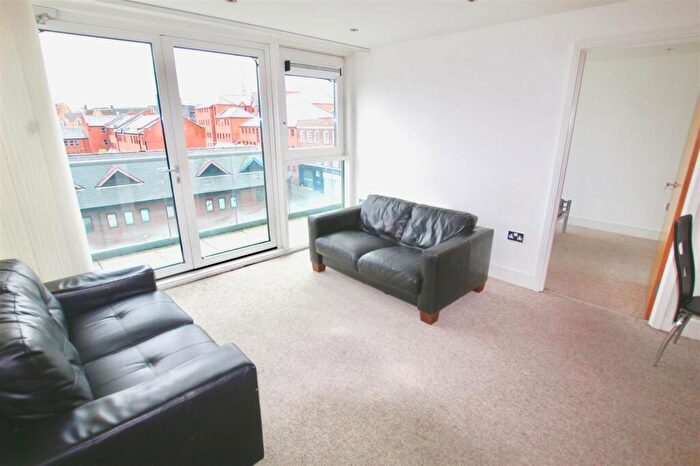
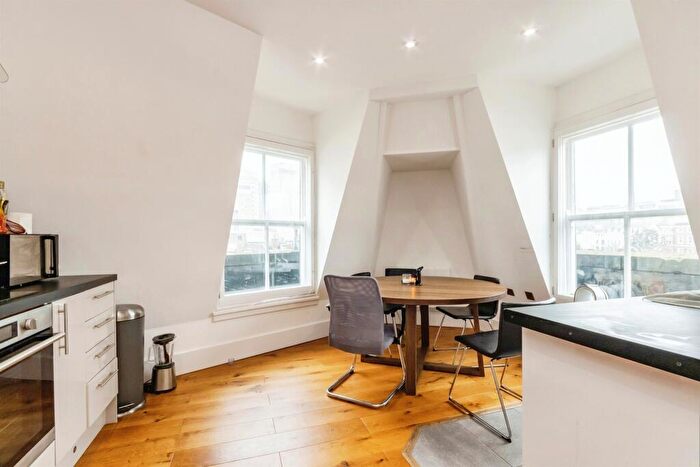
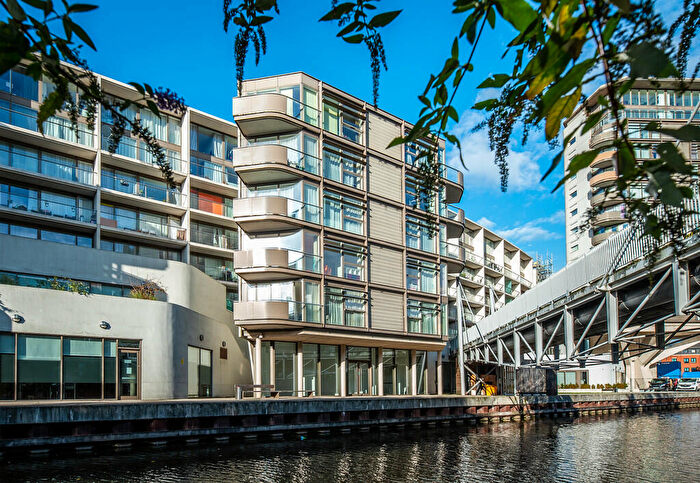
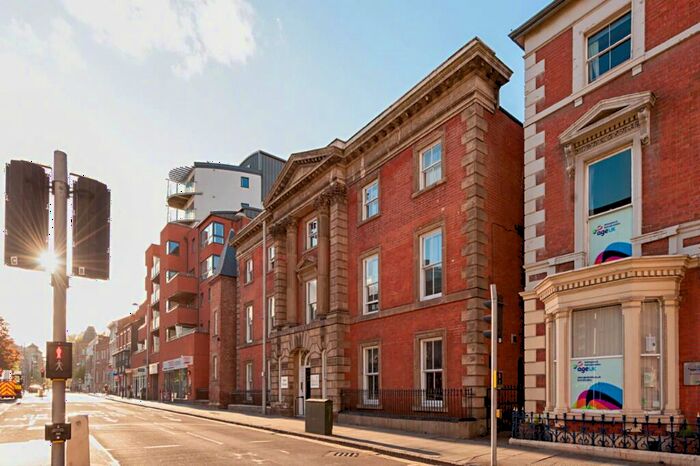
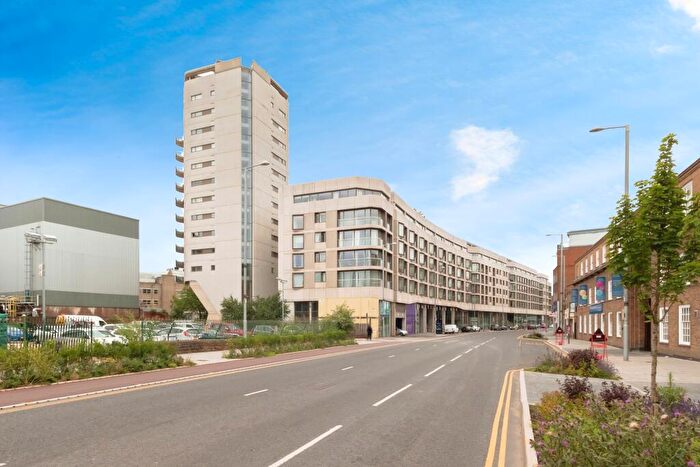
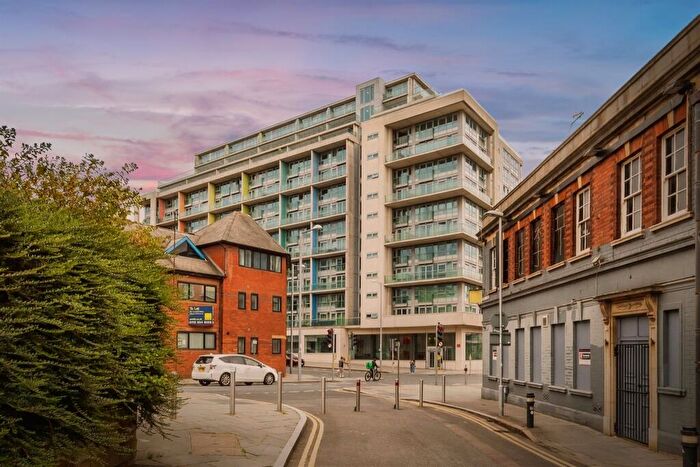
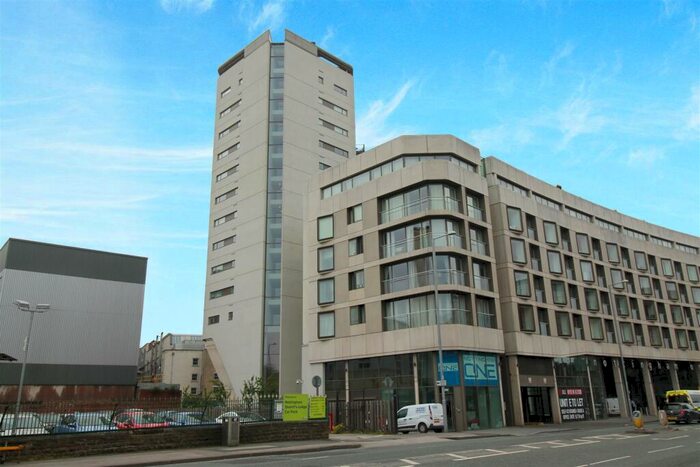
Properties for sale in NG1
Nottingham City Centre
- Info
- Price Paid By Year
- Property Type Price
- Transport
House Prices in NG1
Properties in NG1 have an average house price of £178,442.00 and had 375 Property Transactions within the last 3 years.
The most expensive property was sold for £2,300,000.00.
Property Price Paid in NG1 by Year
The average sold property price by year was:
| Year | Average Sold Price | Sold Properties |
|---|---|---|
| 2025 | £155,753.00 | 99 Properties |
| 2024 | £165,149.00 | 141 Properties |
| 2023 | £208,965.00 | 135 Properties |
| 2022 | £191,899.00 | 203 Properties |
| 2021 | £198,814.00 | 234 Properties |
| 2020 | £185,724.00 | 168 Properties |
| 2019 | £160,965.00 | 262 Properties |
| 2018 | £166,489.00 | 336 Properties |
| 2017 | £167,497.00 | 231 Properties |
| 2016 | £156,003.00 | 290 Properties |
| 2015 | £144,479.00 | 301 Properties |
| 2014 | £140,014.00 | 305 Properties |
| 2013 | £107,973.00 | 212 Properties |
| 2012 | £130,558.00 | 92 Properties |
| 2011 | £146,811.00 | 104 Properties |
| 2010 | £145,563.00 | 121 Properties |
| 2009 | £159,381.00 | 79 Properties |
| 2008 | £150,397.00 | 163 Properties |
| 2007 | £163,325.00 | 427 Properties |
| 2006 | £150,821.00 | 408 Properties |
| 2005 | £135,999.00 | 431 Properties |
| 2004 | £163,586.00 | 427 Properties |
| 2003 | £158,520.00 | 523 Properties |
| 2002 | £141,908.00 | 402 Properties |
| 2001 | £133,715.00 | 285 Properties |
| 2000 | £136,543.00 | 171 Properties |
| 1999 | £135,266.00 | 82 Properties |
| 1998 | £98,823.00 | 58 Properties |
| 1997 | £68,531.00 | 50 Properties |
| 1996 | £52,571.00 | 40 Properties |
| 1995 | £71,757.00 | 41 Properties |
Property Price per Property Type in NG1
Here you can find historic sold price data in order to help with your property search.
The average Property Paid Price for specific property types in the last three years are:
| Property Type | Average Sold Price | Sold Properties |
|---|---|---|
| Semi Detached House | £263,833.00 | 6 Semi Detached Houses |
| Detached House | £1,007,142.00 | 7 Detached Houses |
| Terraced House | £282,214.00 | 30 Terraced Houses |
| Flat | £150,049.00 | 332 Flats |
Transport near NG1
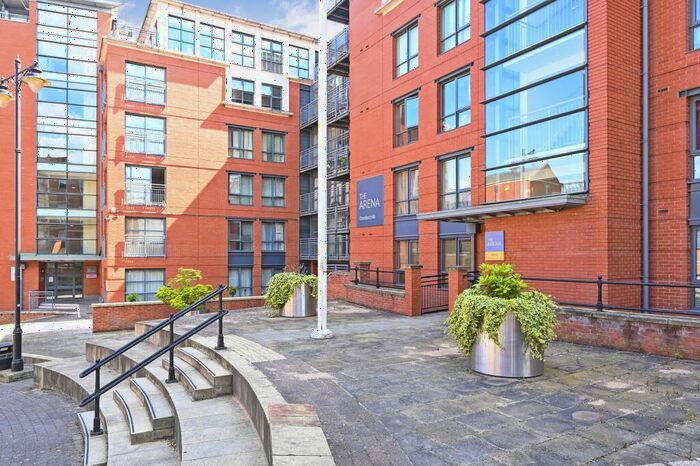
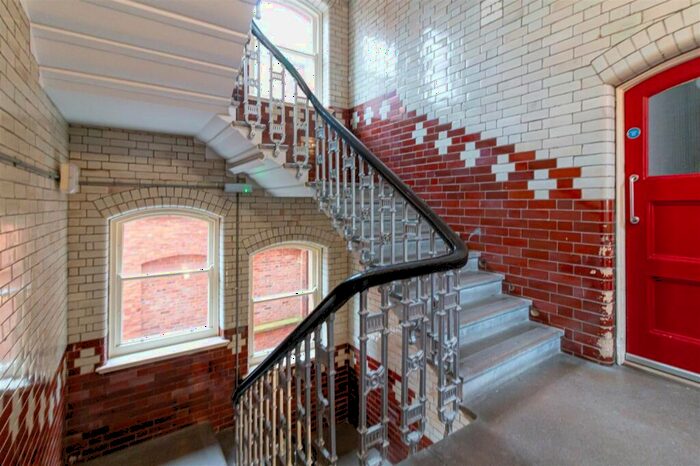
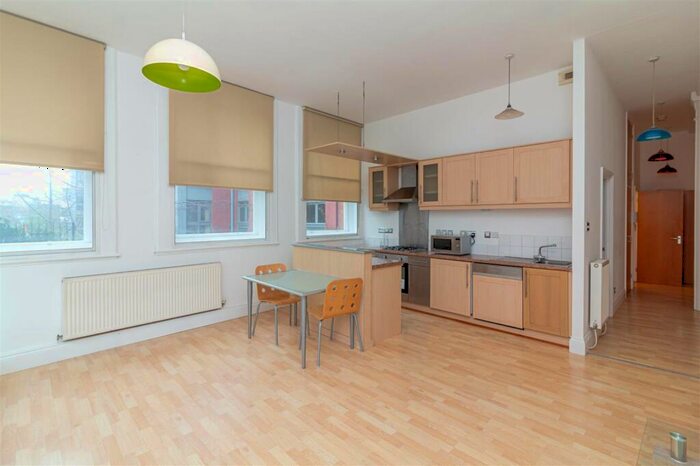
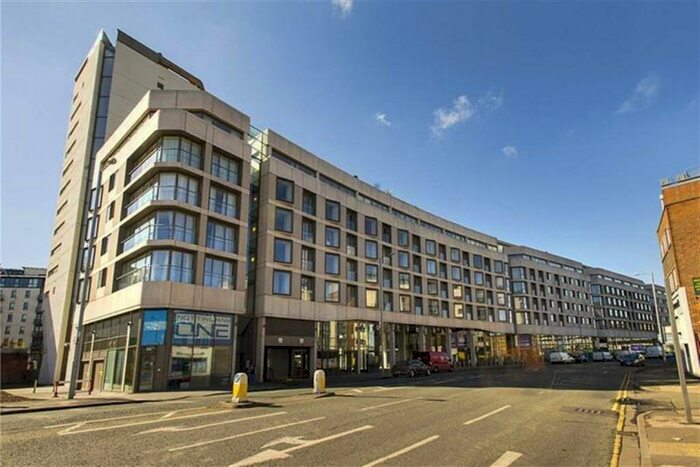
Houses and Flats for sale in NG1, Nottingham City Centre
Frequently Asked Questions about NG1
What is the average price for a property for sale in NG1?
The average price for a property for sale in NG1 is £178,442. There are 194 property listings for sale in NG1.
Which areas are included in the NG1 postcode district?
The main area within NG1 is Nottingham City Centre.
What are the most common property types in NG1?
The most common property types in NG1 are Flats, Terraced Houses, Detached Houses and Semi Detached Houses.
What has been the average sold property price in NG1 over the last three years?
Flats in NG1 have an average sold price of £150,049, while Terraced Houses have an average of £282,214. Detached Houses have an average of £1,007,142 and Semi Detached Houses have an average of £263,833. The average sold property price in NG1 over the last three years is approximately £176,622.
Which train stations are available in NG1?
The train stations available in NG1 are Aslockton Station, Bingham Station, Bleasby Station, Bottesford Station, Burton Joyce Station, East Midlands Parkway Station, Elton and Orston Station, Hucknall Station, Kirkby in Ashfield Station, Langley Mill Station, Long Eaton Station, Lowdham Station, Mansfield Town Station, Mansfield Woodhouse Station, Newstead Station, Radcliffe (Nottinghamshire) Station, Sutton Parkway Station and Thurgarton Station..


