
Properties for sale in NG
Nottingham
- Info
- Price Paid By Year
- Property Type Price
House Prices in NG
Properties in NG have an average house price of £244,017 and had 49501 Property Transactions within the last 3 years.
The most expensive property was sold for £5,400,000.
Property Price Paid in NG by Year
The average sold property price by year was:
| Year | Average Sold Price | Sold Properties |
|---|---|---|
| 2026 | £248,010.00 | 1,123 Properties |
| 2025 | £247,575.00 | 16,067 Properties |
| 2024 | £245,327.00 | 16,945 Properties |
| 2023 | £238,561.00 | 15,366 Properties |
| 2022 | £240,195.00 | 19,291 Properties |
| 2021 | £231,553.00 | 23,349 Properties |
| 2020 | £211,992.00 | 17,861 Properties |
| 2019 | £193,313.00 | 21,092 Properties |
| 2018 | £191,547.00 | 21,004 Properties |
| 2017 | £182,376.00 | 21,102 Properties |
| 2016 | £174,837.00 | 21,646 Properties |
| 2015 | £165,374.00 | 20,337 Properties |
| 2014 | £157,103.00 | 20,284 Properties |
| 2013 | £150,676.00 | 16,562 Properties |
| 2012 | £148,183.00 | 13,659 Properties |
| 2011 | £147,333.00 | 13,501 Properties |
| 2010 | £151,206.00 | 13,476 Properties |
| 2009 | £147,585.00 | 12,895 Properties |
| 2008 | £147,946.00 | 13,497 Properties |
| 2007 | £153,449.00 | 25,664 Properties |
| 2006 | £148,525.00 | 26,373 Properties |
| 2005 | £143,322.00 | 21,727 Properties |
| 2004 | £135,733.00 | 26,173 Properties |
| 2003 | £117,854.00 | 26,106 Properties |
| 2002 | £95,794.00 | 28,070 Properties |
| 2001 | £78,531.00 | 25,956 Properties |
| 2000 | £70,713.00 | 23,437 Properties |
| 1999 | £65,791.00 | 22,784 Properties |
| 1998 | £60,111.00 | 20,308 Properties |
| 1997 | £56,793.00 | 20,601 Properties |
| 1996 | £53,779.00 | 17,954 Properties |
| 1995 | £51,569.00 | 15,254 Properties |
Property Price per Property Type in NG
Here you can find historic sold price data in order to help with your property search.
The average Property Paid Price for specific property types in the last three years are:
| Property Type | Average Sold Price | Sold Properties |
|---|---|---|
| Semi Detached House | £218,163.00 | 17,449 Semi Detached Houses |
| Terraced House | £168,264.00 | 12,900 Terraced Houses |
| Detached House | £361,795.00 | 15,332 Detached Houses |
| Flat | £145,213.00 | 3,820 Flats |
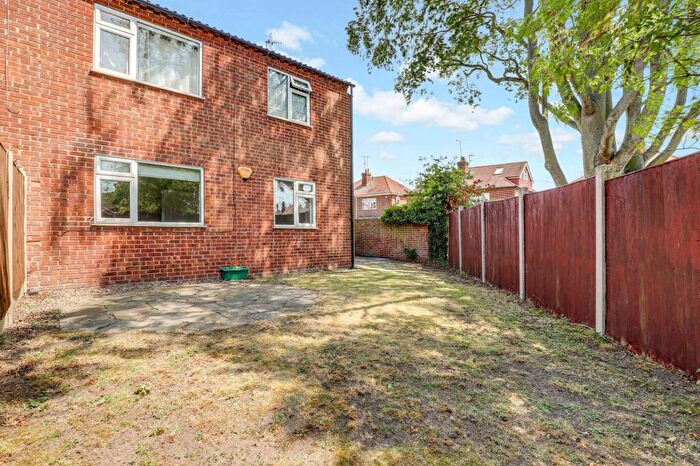
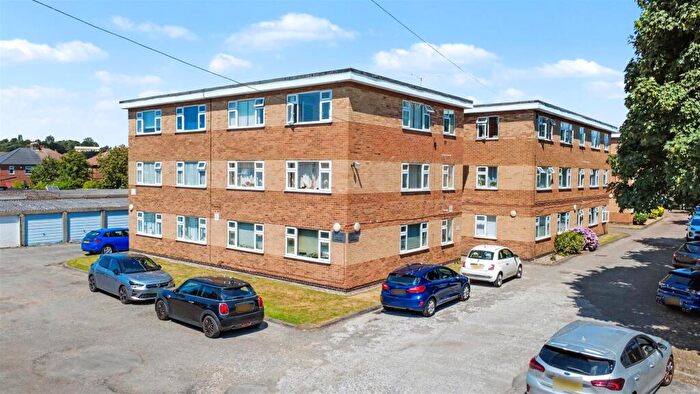
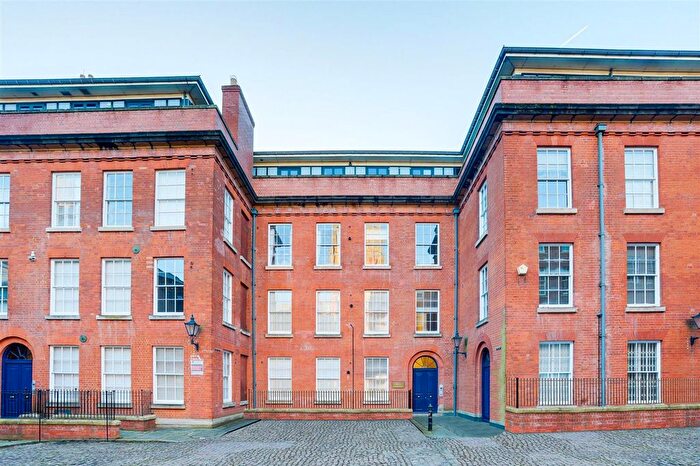
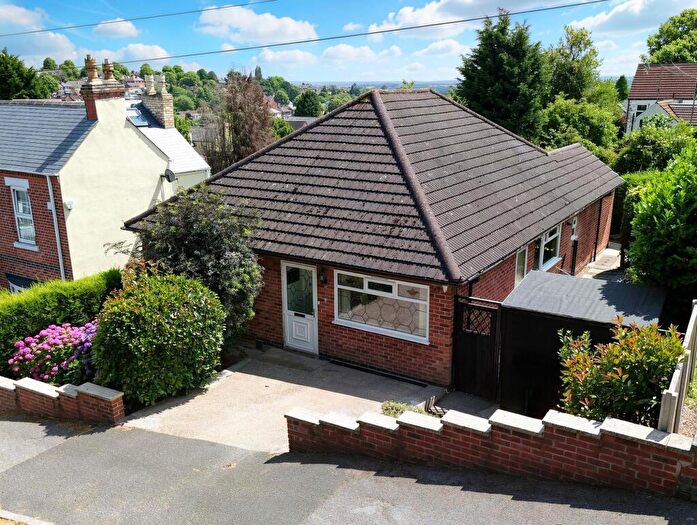
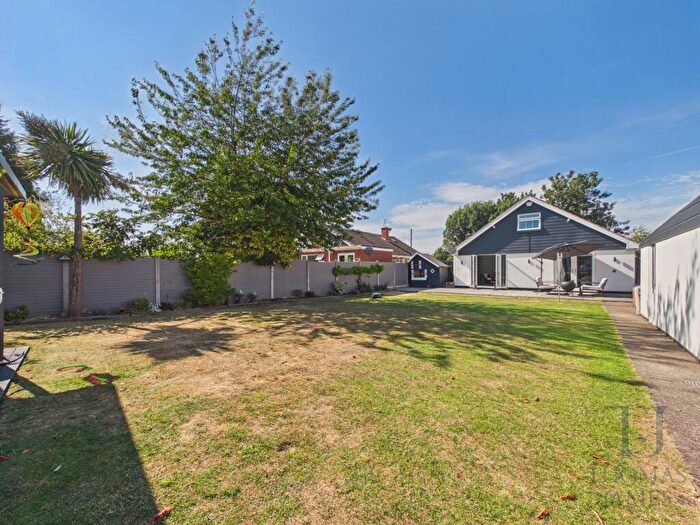
Houses and Flats for sale in NG, Nottingham
There are 6,914 results. Property prices in NG range from £15k to £4M with an average price of £315k.
![]()
If you are looking to sell your house, let it out, or receive a property valuation, an expert can help you.
Click the button below to get started.

Postcode districts in NG, Nottingham
Navigate through our locations to find the location of your next house in NG, Nottingham, England for sale or to rent.
Transport in NG, Nottingham
Please see below transportation links in this area:
-
 Burton Joyce Station
 -
Lowdham Station
-
Carlton Station
-
Netherfield Station
-
Radcliffe (Nottinghamshire) Station
-
Thurgarton Station
Frequently asked questions about NG
What is the average price for a property for sale in NG?
The average price for a property for sale in NG is £244,017. This amount is 32% lower than the average price in England. There are 6,914 property listings for sale in NG.
What locations have the most expensive properties for sale in NG?
The locations with the most expensive properties for sale in NG are NG25 at an average of £421,851, NG32 at an average of £377,584 and NG23 at an average of £377,023.
What locations have the most affordable properties for sale in NG?
The locations with the most affordable properties for sale in NG are NG20 at an average of £164,042, NG6 at an average of £174,395 and NG1 at an average of £176,817.
Which train stations are available in or near NG?
Some of the train stations available in or near NG are Burton Joyce, Lowdham and Carlton.