
Properties for sale in NG19
Mansfield Woodhouse
- Info
- Price Paid By Year
- Property Type Price
- Transport
House Prices in NG19
Properties in NG19 have an average house price of £184,763.00 and had 2214 Property Transactions within the last 3 years.
The most expensive property was sold for £640,000.00.
Property Price Paid in NG19 by Year
The average sold property price by year was:
| Year | Average Sold Price | Sold Properties |
|---|---|---|
| 2026 | £212,300.00 | 5 Properties |
| 2025 | £192,398.00 | 679 Properties |
| 2024 | £183,804.00 | 794 Properties |
| 2023 | £178,567.00 | 736 Properties |
| 2022 | £179,101.00 | 885 Properties |
| 2021 | £172,873.00 | 1,091 Properties |
| 2020 | £155,770.00 | 837 Properties |
| 2019 | £150,627.00 | 990 Properties |
| 2018 | £143,198.00 | 1,009 Properties |
| 2017 | £133,175.00 | 937 Properties |
| 2016 | £128,942.00 | 984 Properties |
| 2015 | £129,103.00 | 963 Properties |
| 2014 | £125,633.00 | 880 Properties |
| 2013 | £119,097.00 | 735 Properties |
| 2012 | £112,500.00 | 623 Properties |
| 2011 | £114,187.00 | 604 Properties |
| 2010 | £119,971.00 | 551 Properties |
| 2009 | £114,638.00 | 439 Properties |
| 2008 | £123,687.00 | 534 Properties |
| 2007 | £121,168.00 | 1,107 Properties |
| 2006 | £117,338.00 | 1,177 Properties |
| 2005 | £113,145.00 | 1,161 Properties |
| 2004 | £108,068.00 | 1,279 Properties |
| 2003 | £87,736.00 | 1,227 Properties |
| 2002 | £68,861.00 | 1,296 Properties |
| 2001 | £56,714.00 | 1,156 Properties |
| 2000 | £50,975.00 | 918 Properties |
| 1999 | £49,771.00 | 868 Properties |
| 1998 | £46,518.00 | 844 Properties |
| 1997 | £42,930.00 | 838 Properties |
| 1996 | £42,902.00 | 776 Properties |
| 1995 | £40,013.00 | 613 Properties |
Property Price per Property Type in NG19
Here you can find historic sold price data in order to help with your property search.
The average Property Paid Price for specific property types in the last three years are:
| Property Type | Average Sold Price | Sold Properties |
|---|---|---|
| Semi Detached House | £166,366.00 | 910 Semi Detached Houses |
| Terraced House | £124,882.00 | 502 Terraced Houses |
| Detached House | £257,651.00 | 731 Detached Houses |
| Flat | £93,488.00 | 71 Flats |

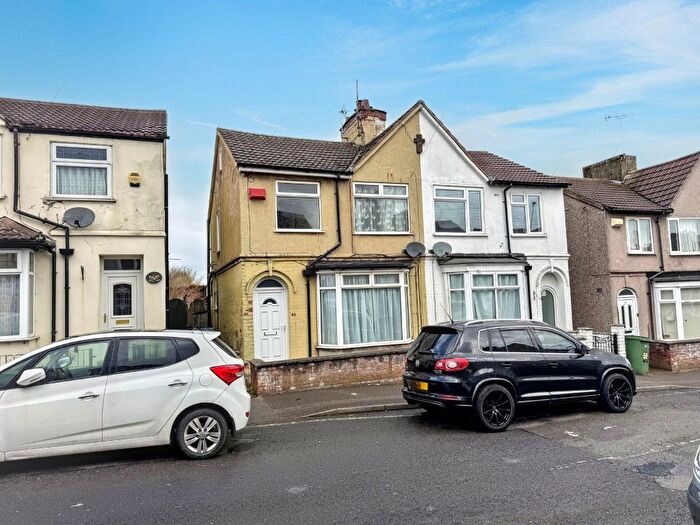
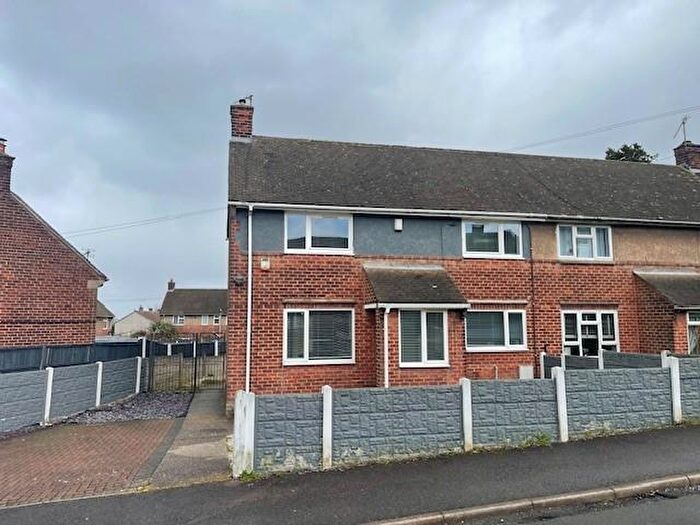
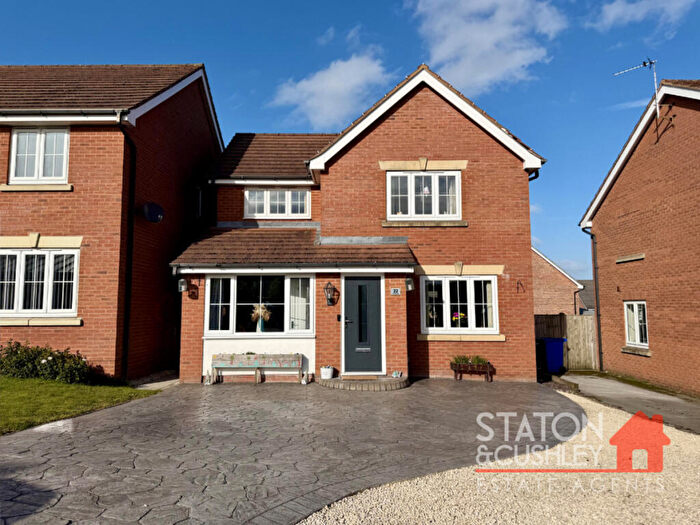
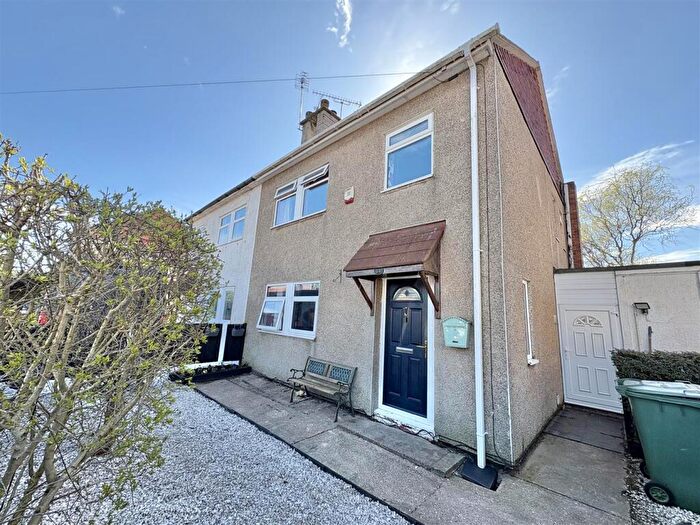
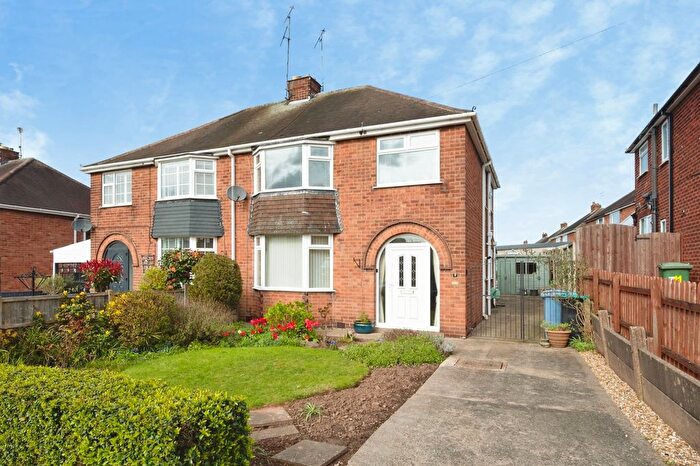
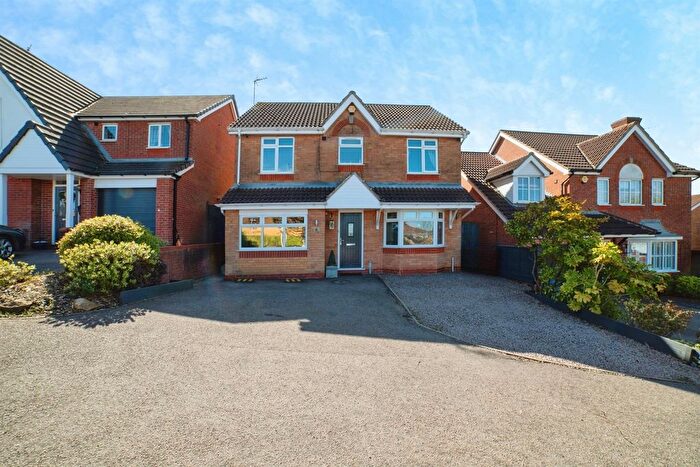
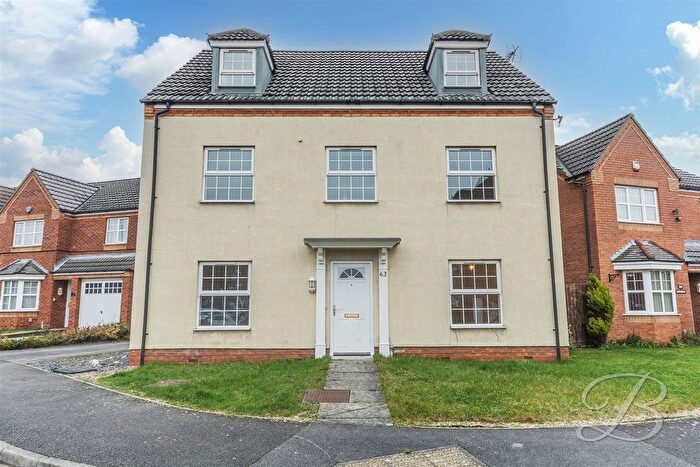
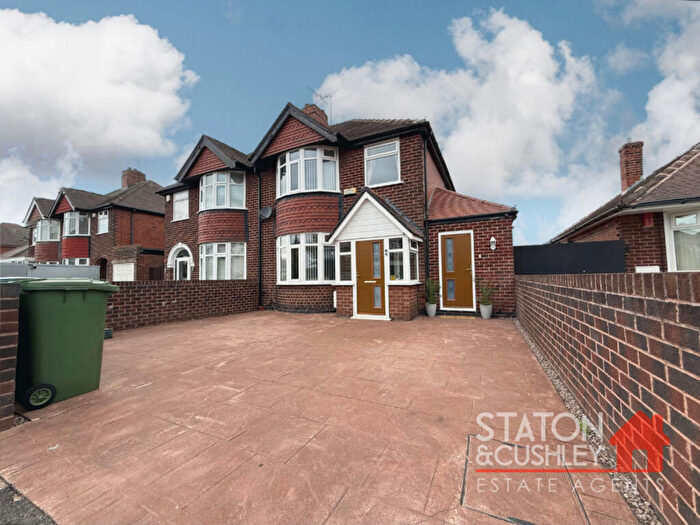
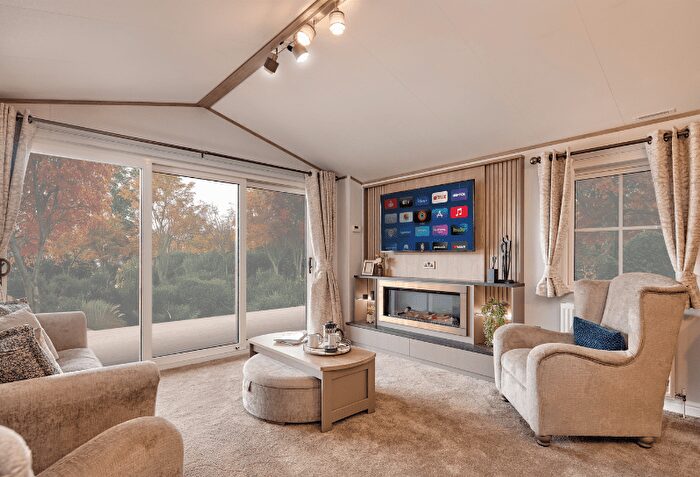
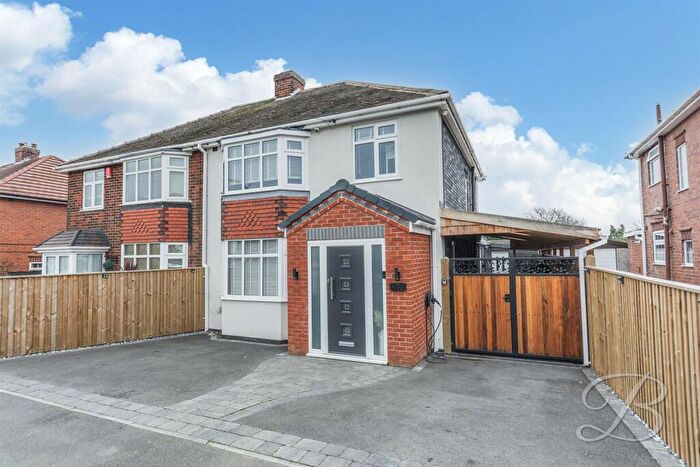
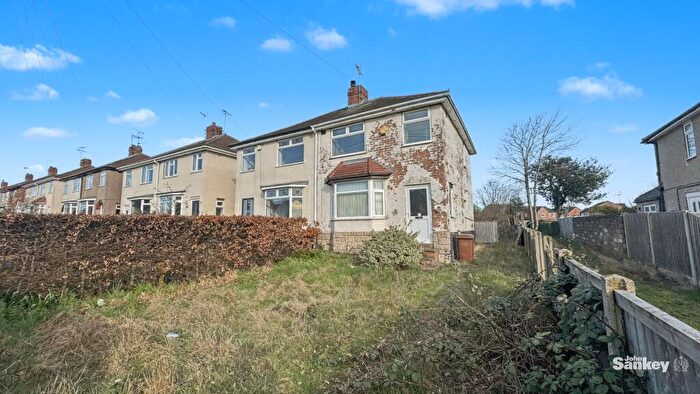
Houses and Flats for sale in NG19, Mansfield Woodhouse
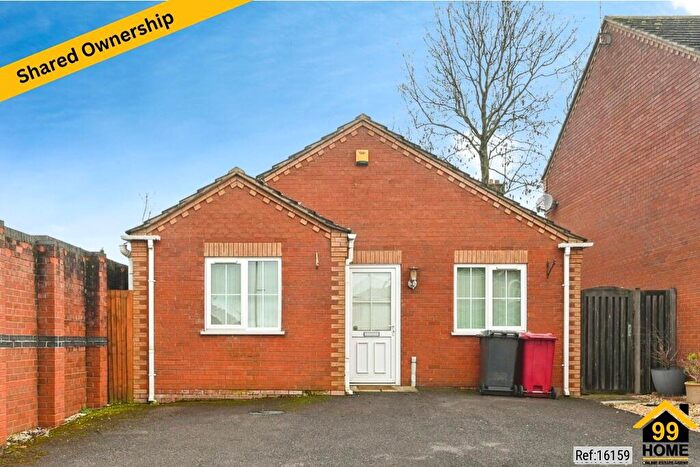
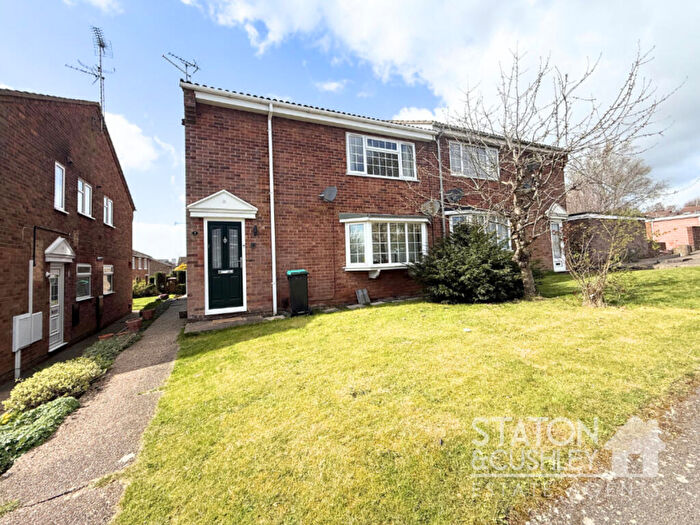
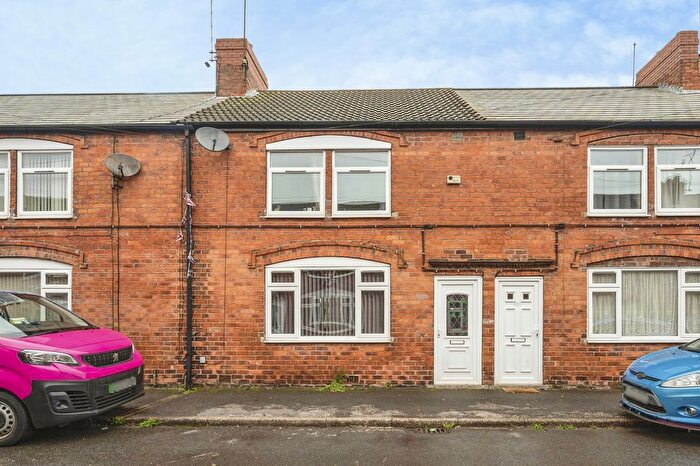
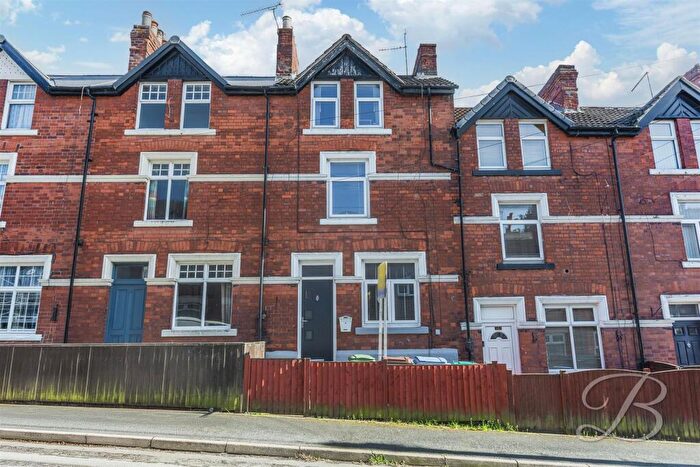
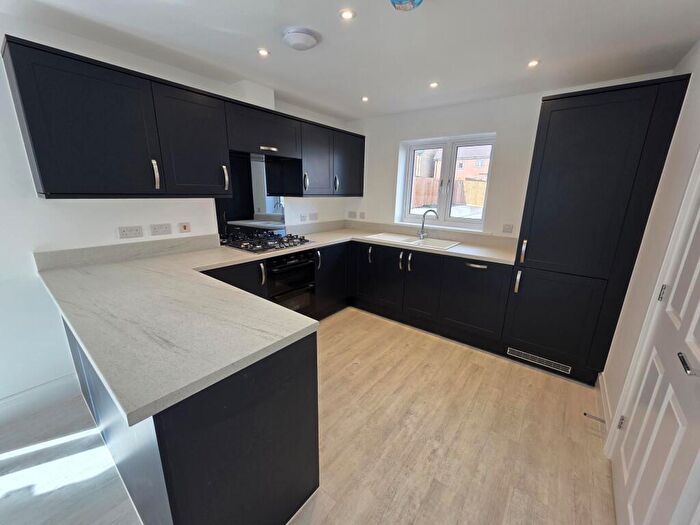
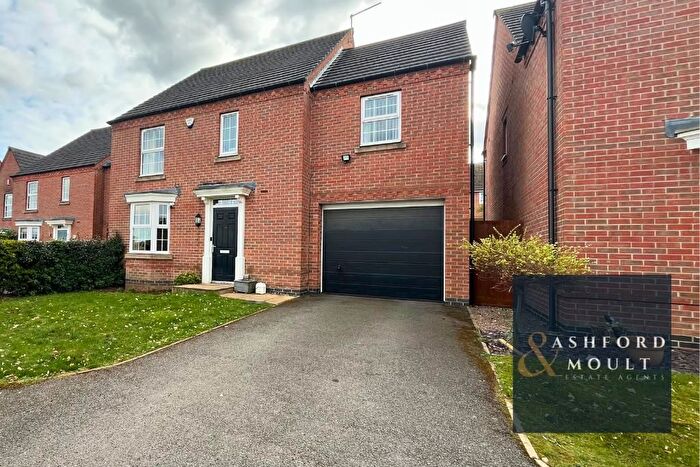
![]()
If you are looking to sell your house, let it out, or receive a property valuation, an expert can help you.
Click the button below to get started.

Frequently Asked Questions about NG19
What is the average price for a property for sale in NG19?
The average price for a property for sale in NG19 is £184,763. There are 294 property listings for sale in NG19.
Which areas are included in the NG19 postcode district?
The main area within NG19 is Mansfield Woodhouse.
What are the most common property types in NG19?
The most common property types in NG19 are Semi Detached Houses, Detached Houses, Terraced Houses and Flats.
What has been the average sold property price in NG19 over the last three years?
Semi Detached Houses in NG19 have an average sold price of £166,366, while Detached Houses have an average of £257,651. Terraced Houses have an average of £124,882 and Flats have an average of £93,488. The average sold property price in NG19 over the last three years is approximately £196,167.
Which train stations are available in NG19?
The train stations available in NG19 are Elton and Orston Station and Mansfield Woodhouse Station..