
Properties for sale in NR4
Norwich
- Info
- Price Paid By Year
- Property Type Price
- Transport
House Prices in NR4
Properties in NR4 have an average house price of £371,534.00 and had 859 Property Transactions within the last 3 years.
The most expensive property was sold for £2,000,000.00.
Property Price Paid in NR4 by Year
The average sold property price by year was:
| Year | Average Sold Price | Sold Properties |
|---|---|---|
| 2026 | £407,145.00 | 24 Properties |
| 2025 | £360,074.00 | 270 Properties |
| 2024 | £384,730.00 | 292 Properties |
| 2023 | £365,624.00 | 273 Properties |
| 2022 | £383,612.00 | 315 Properties |
| 2021 | £369,584.00 | 391 Properties |
| 2020 | £336,390.00 | 285 Properties |
| 2019 | £315,392.00 | 339 Properties |
| 2018 | £286,926.00 | 458 Properties |
| 2017 | £300,041.00 | 410 Properties |
| 2016 | £297,212.00 | 324 Properties |
| 2015 | £285,613.00 | 389 Properties |
| 2014 | £268,489.00 | 410 Properties |
| 2013 | £250,347.00 | 399 Properties |
| 2012 | £230,895.00 | 308 Properties |
| 2011 | £245,207.00 | 247 Properties |
| 2010 | £244,043.00 | 298 Properties |
| 2009 | £227,989.00 | 318 Properties |
| 2008 | £223,942.00 | 242 Properties |
| 2007 | £249,741.00 | 350 Properties |
| 2006 | £217,760.00 | 388 Properties |
| 2005 | £211,319.00 | 274 Properties |
| 2004 | £197,553.00 | 325 Properties |
| 2003 | £183,660.00 | 327 Properties |
| 2002 | £156,421.00 | 311 Properties |
| 2001 | £128,736.00 | 352 Properties |
| 2000 | £105,249.00 | 304 Properties |
| 1999 | £93,840.00 | 325 Properties |
| 1998 | £84,025.00 | 312 Properties |
| 1997 | £79,021.00 | 327 Properties |
| 1996 | £78,090.00 | 253 Properties |
| 1995 | £78,368.00 | 246 Properties |
Property Price per Property Type in NR4
Here you can find historic sold price data in order to help with your property search.
The average Property Paid Price for specific property types in the last three years are:
| Property Type | Average Sold Price | Sold Properties |
|---|---|---|
| Semi Detached House | £351,433.00 | 201 Semi Detached Houses |
| Detached House | £525,533.00 | 322 Detached Houses |
| Terraced House | £266,583.00 | 198 Terraced Houses |
| Flat | £192,066.00 | 138 Flats |

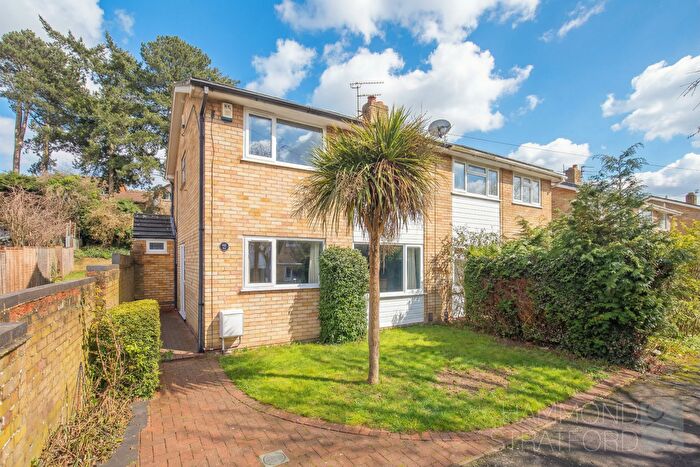
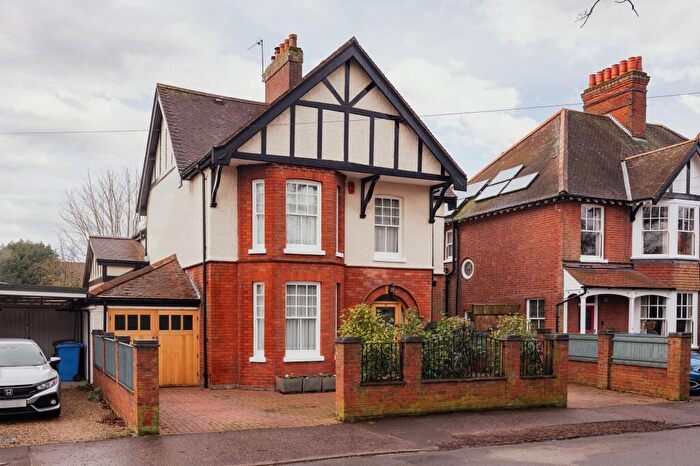
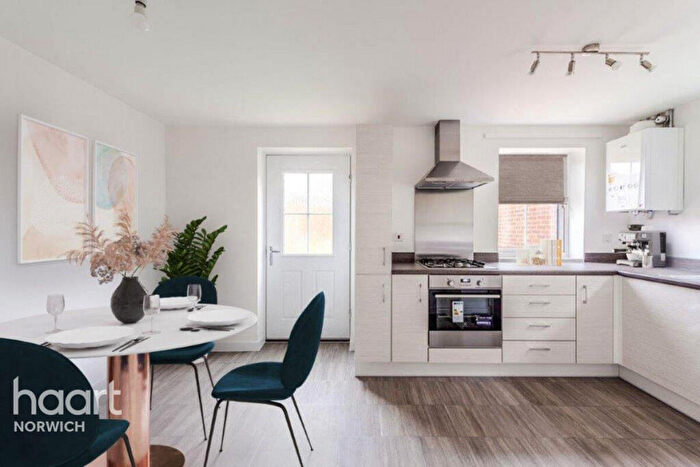
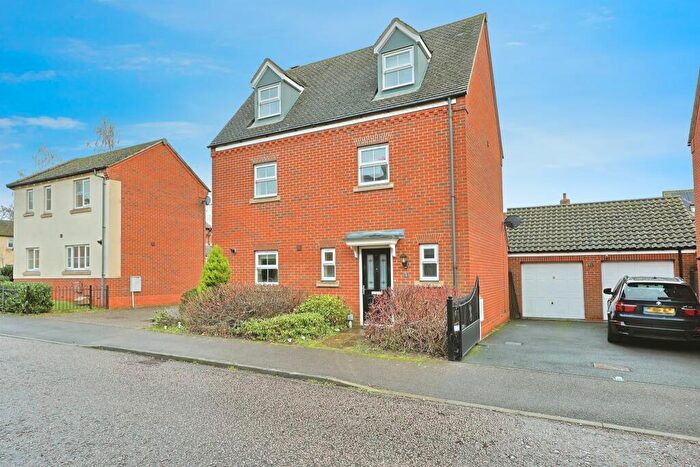
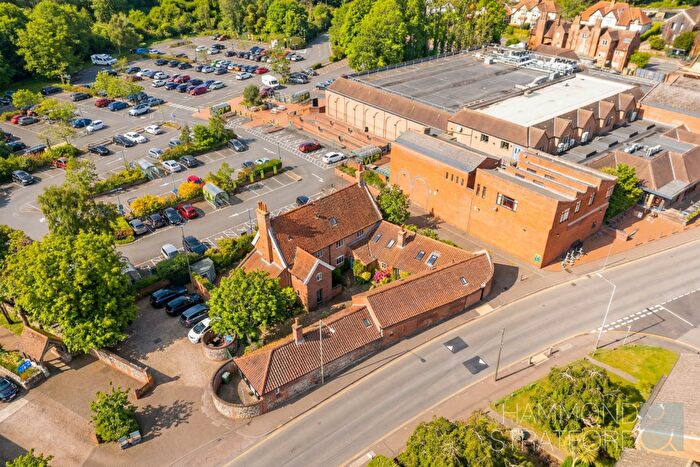
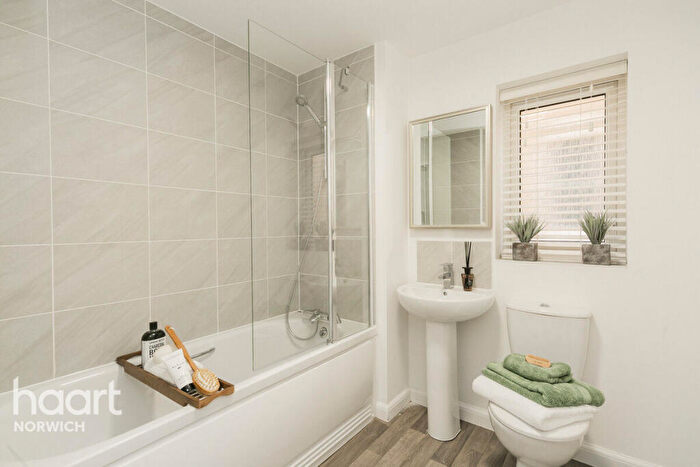
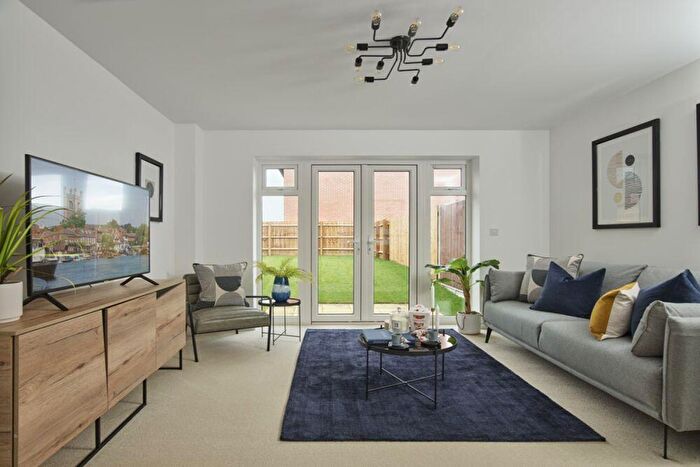
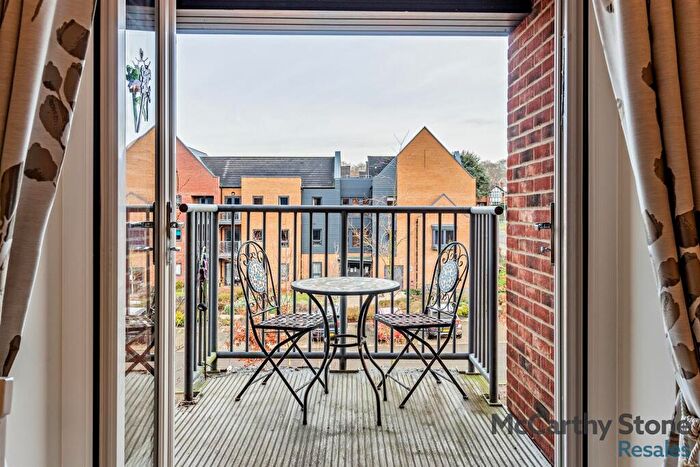
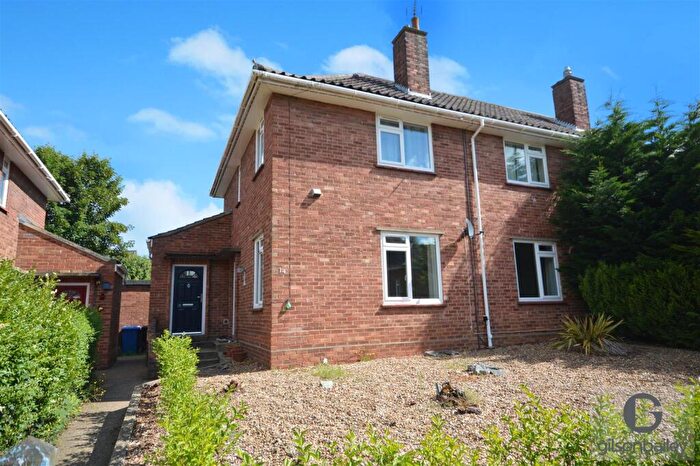
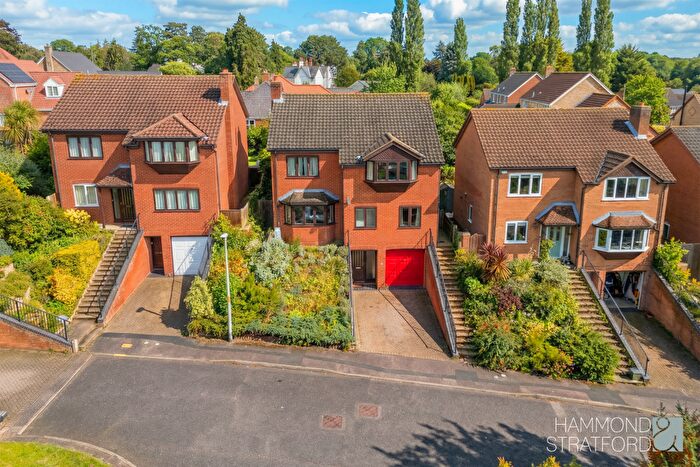
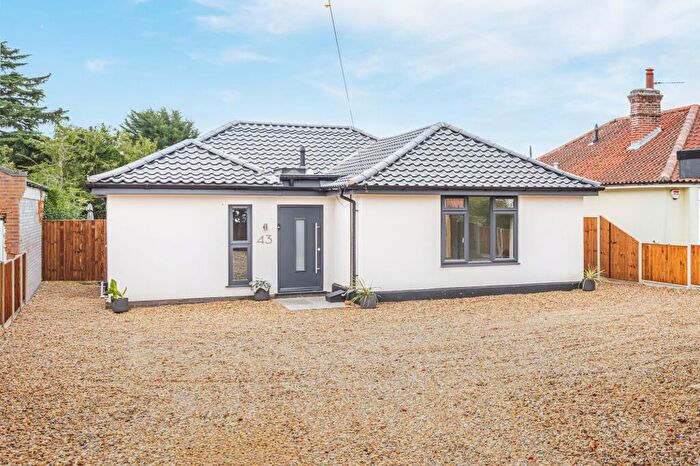
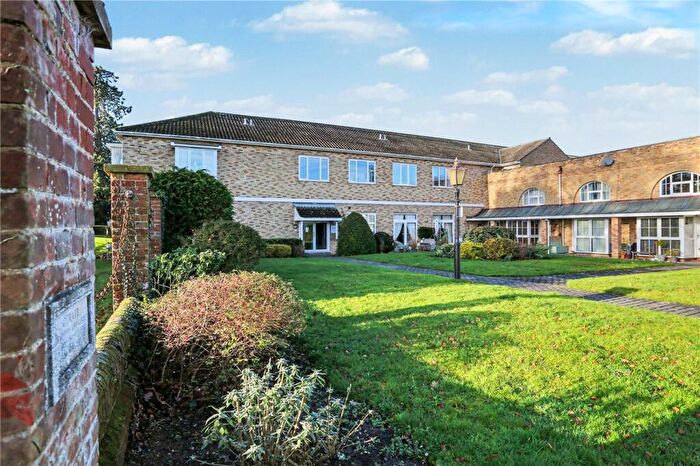
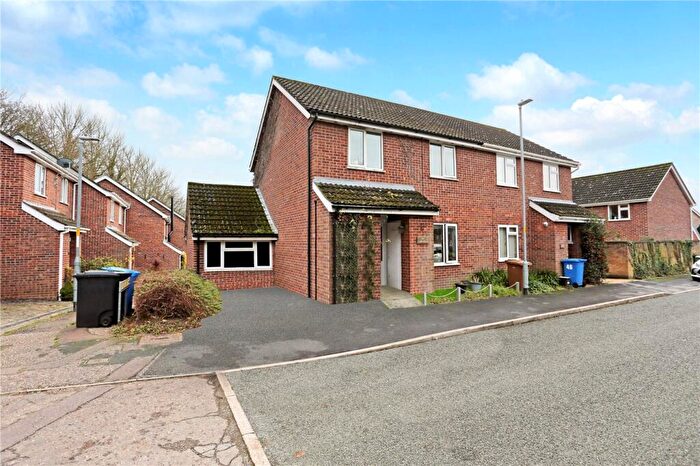
Houses and Flats for sale in NR4, Norwich
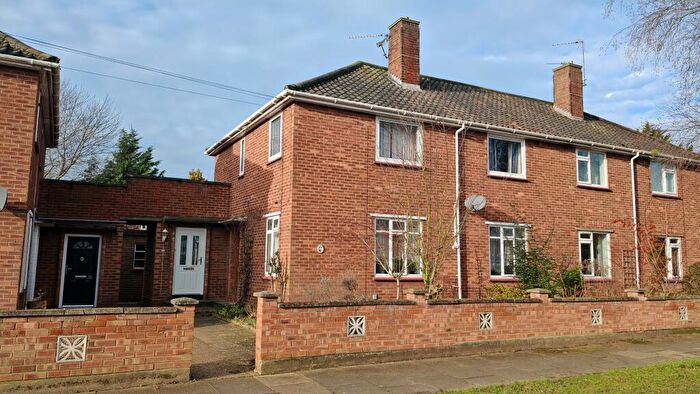
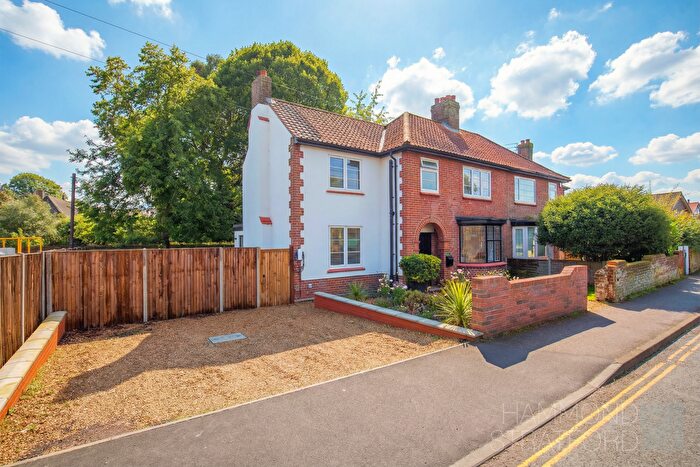
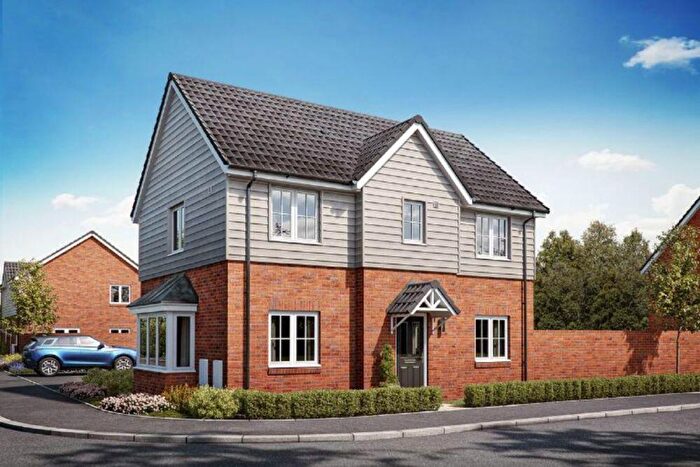
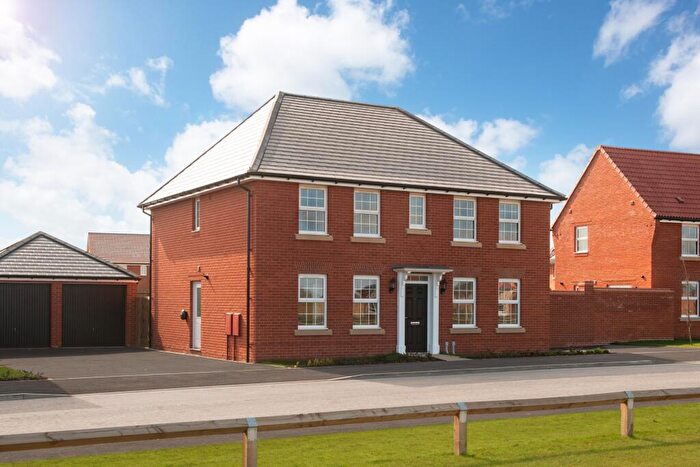
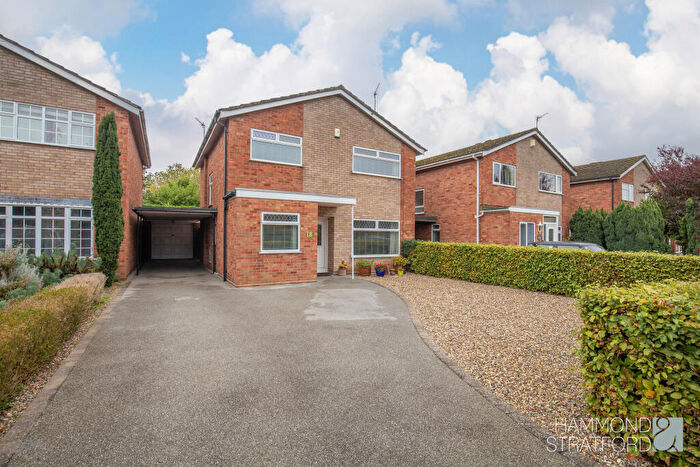
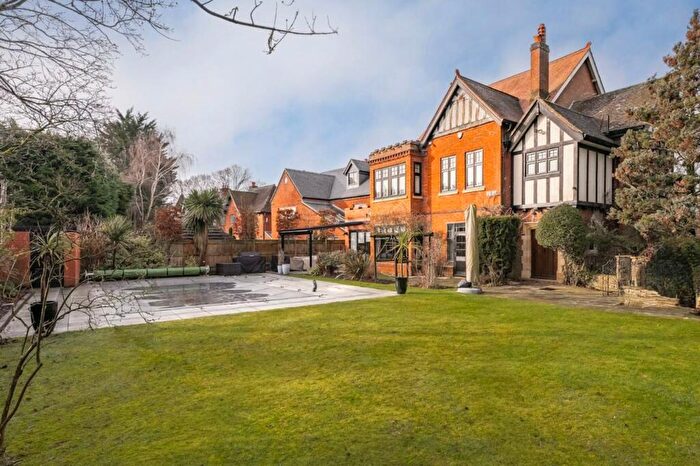
![]()
If you are looking to sell your house, let it out, or receive a property valuation, an expert can help you.
Click the button below to get started.
Frequently Asked Questions about NR4
What is the average price for a property for sale in NR4?
The average price for a property for sale in NR4 is £371,534. There are 158 property listings for sale in NR4.
Which areas are included in the NR4 postcode district?
The main area within NR4 is Norwich.
What are the most common property types in NR4?
The most common property types in NR4 are Detached Houses, Semi Detached Houses, Terraced Houses and Flats.
What has been the average sold property price in NR4 over the last three years?
Detached Houses in NR4 have an average sold price of £525,533, while Semi Detached Houses have an average of £351,433. Terraced Houses have an average of £266,583 and Flats have an average of £192,066. The average sold property price in NR4 over the last three years is approximately £383,983.