
Properties for sale in NR5
Norwich
- Info
- Price Paid By Year
- Property Type Price
- Transport
House Prices in NR5
Properties in NR5 have an average house price of £258,497.00 and had 922 Property Transactions within the last 3 years.
The most expensive property was sold for £780,000.00.
Property Price Paid in NR5 by Year
The average sold property price by year was:
| Year | Average Sold Price | Sold Properties |
|---|---|---|
| 2026 | £258,967.00 | 28 Properties |
| 2025 | £257,540.00 | 297 Properties |
| 2024 | £260,405.00 | 329 Properties |
| 2023 | £257,166.00 | 268 Properties |
| 2022 | £265,436.00 | 352 Properties |
| 2021 | £246,874.00 | 477 Properties |
| 2020 | £232,521.00 | 303 Properties |
| 2019 | £230,681.00 | 399 Properties |
| 2018 | £226,079.00 | 413 Properties |
| 2017 | £211,674.00 | 479 Properties |
| 2016 | £204,810.00 | 454 Properties |
| 2015 | £183,428.00 | 429 Properties |
| 2014 | £169,903.00 | 459 Properties |
| 2013 | £157,083.00 | 416 Properties |
| 2012 | £154,869.00 | 335 Properties |
| 2011 | £149,845.00 | 372 Properties |
| 2010 | £150,744.00 | 309 Properties |
| 2009 | £139,563.00 | 305 Properties |
| 2008 | £157,526.00 | 302 Properties |
| 2007 | £164,223.00 | 557 Properties |
| 2006 | £150,720.00 | 650 Properties |
| 2005 | £138,059.00 | 592 Properties |
| 2004 | £132,819.00 | 510 Properties |
| 2003 | £121,093.00 | 543 Properties |
| 2002 | £98,564.00 | 546 Properties |
| 2001 | £77,195.00 | 530 Properties |
| 2000 | £66,134.00 | 340 Properties |
| 1999 | £53,994.00 | 350 Properties |
| 1998 | £49,432.00 | 279 Properties |
| 1997 | £46,669.00 | 340 Properties |
| 1996 | £43,622.00 | 343 Properties |
| 1995 | £45,511.00 | 234 Properties |
Property Price per Property Type in NR5
Here you can find historic sold price data in order to help with your property search.
The average Property Paid Price for specific property types in the last three years are:
| Property Type | Average Sold Price | Sold Properties |
|---|---|---|
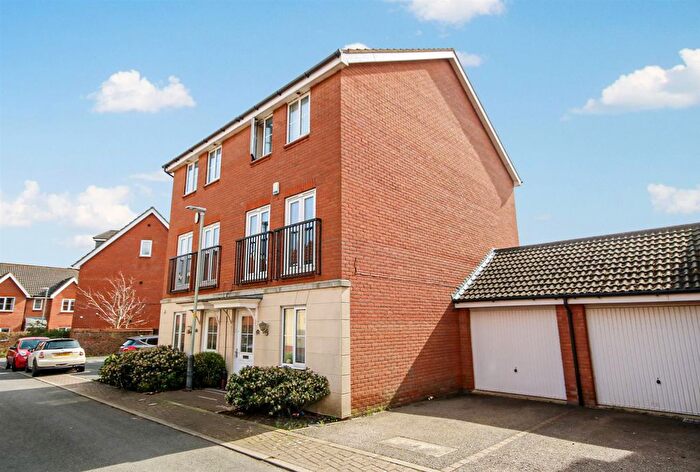
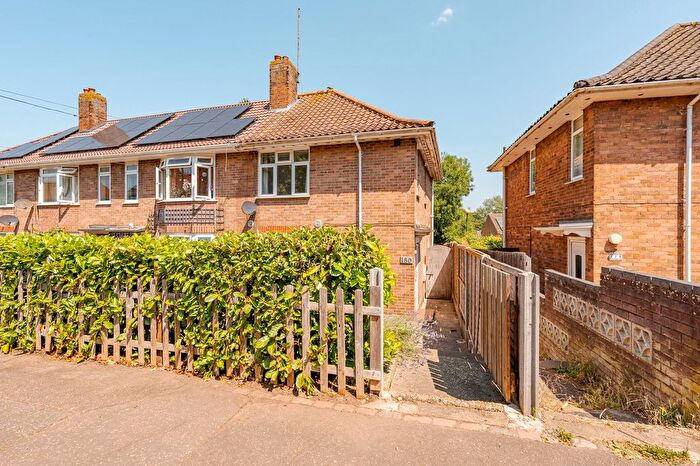
| Semi Detached House | £250,971.00 | 313 Semi Detached Houses |
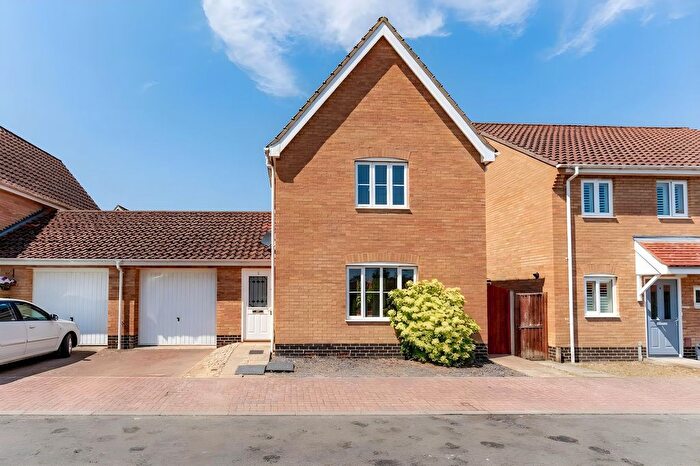
| Detached House | £327,555.00 | 285 Detached Houses |
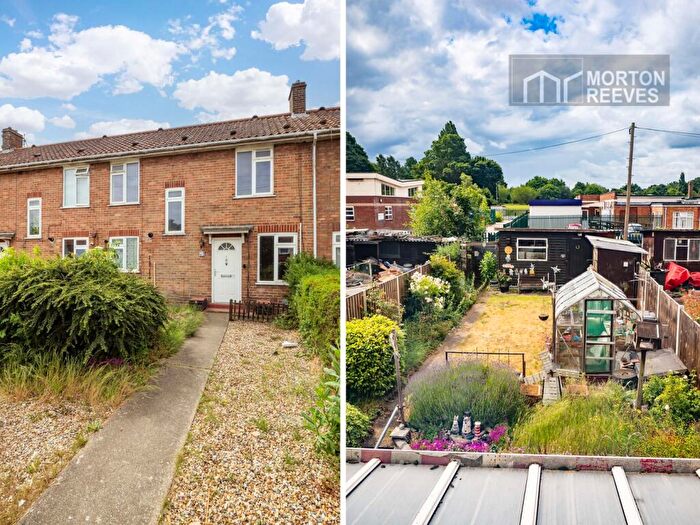
| Terraced House | £223,559.00 | 252 Terraced Houses |
| Flat | £140,145.00 | 72 Flats |

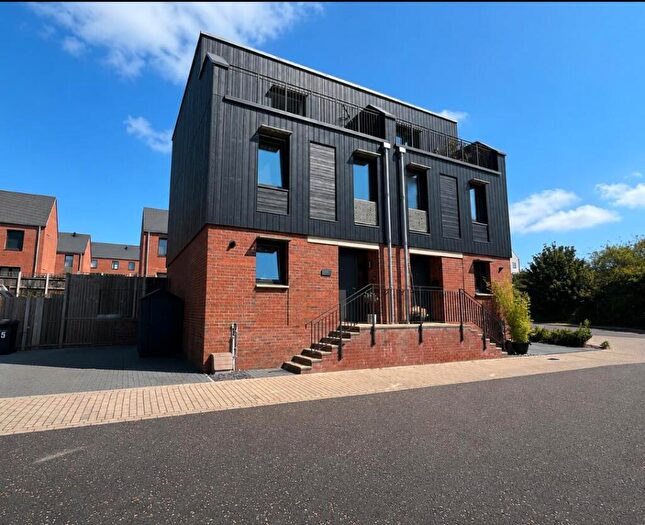
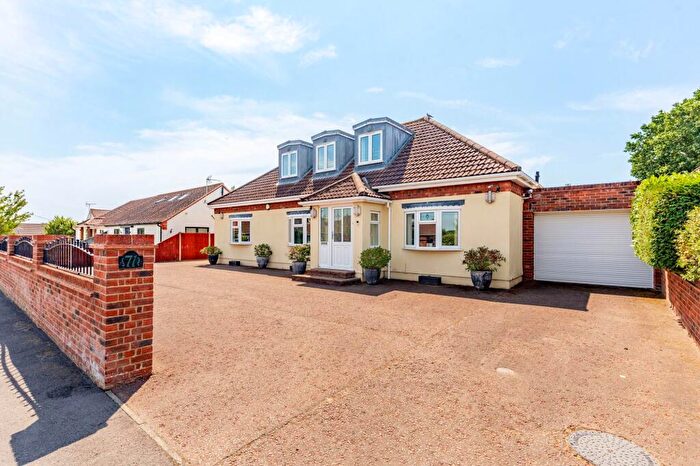
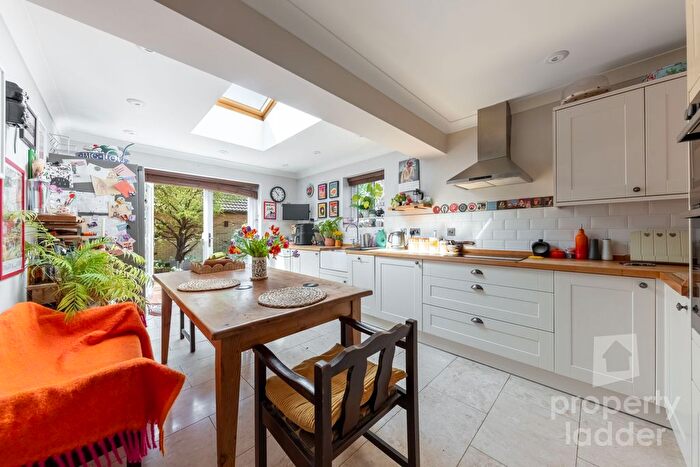
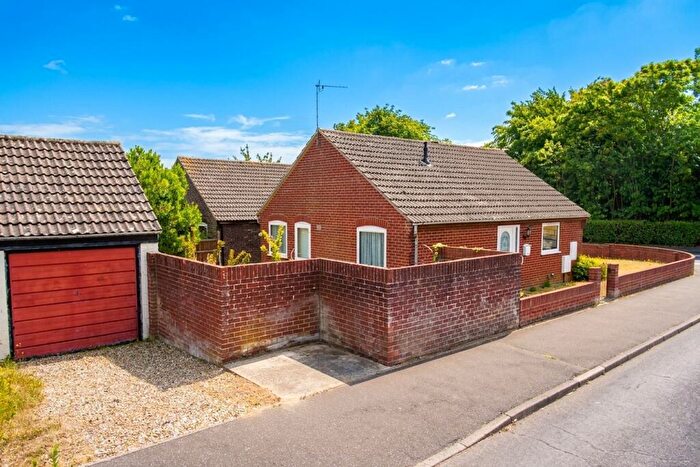
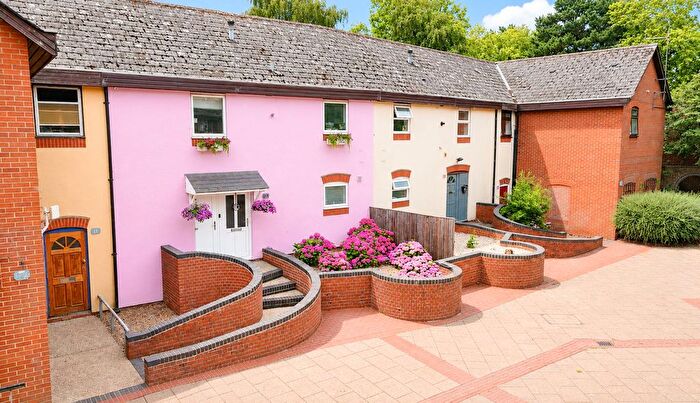
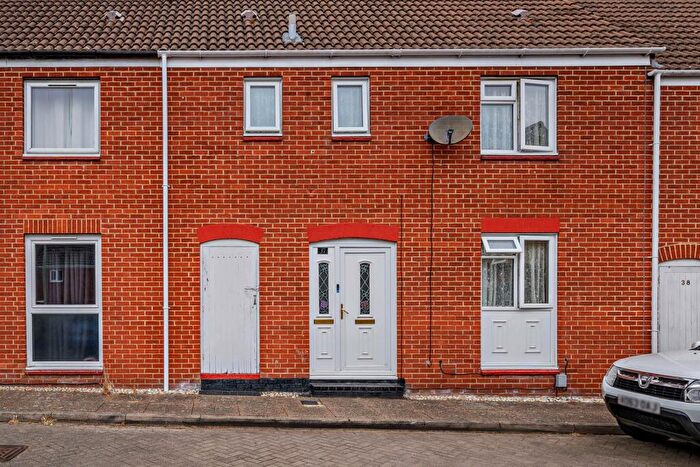
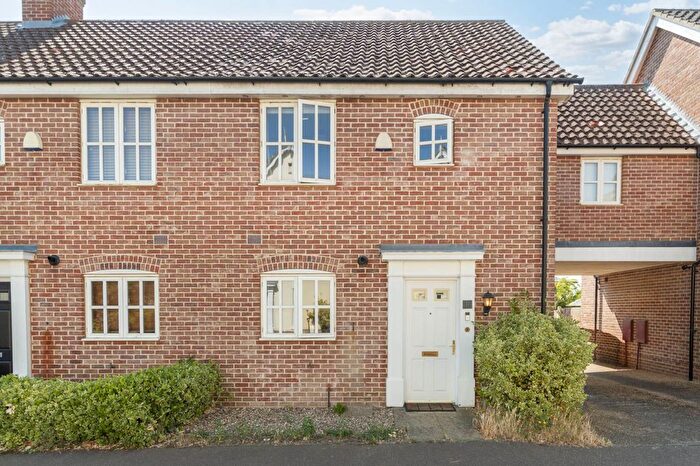
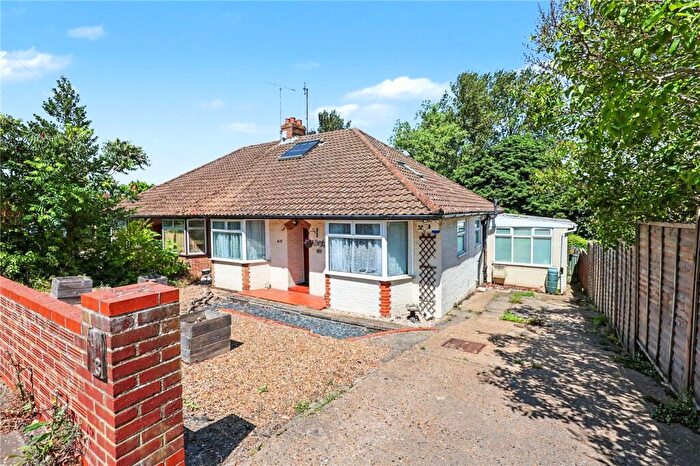
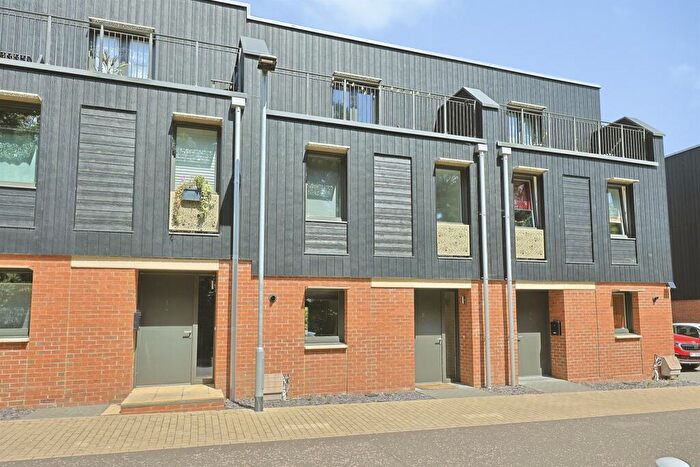
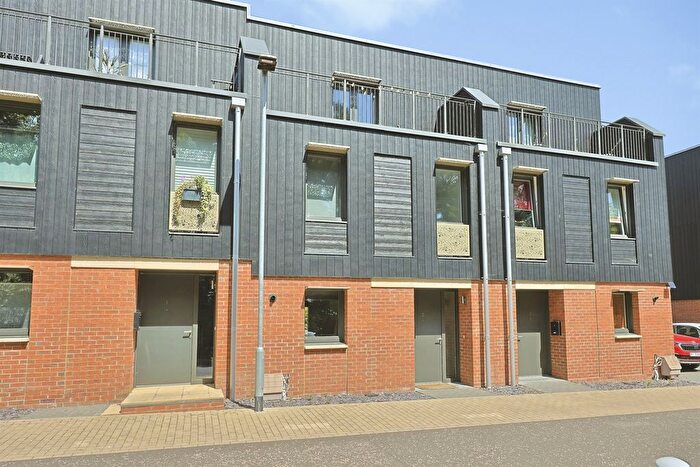
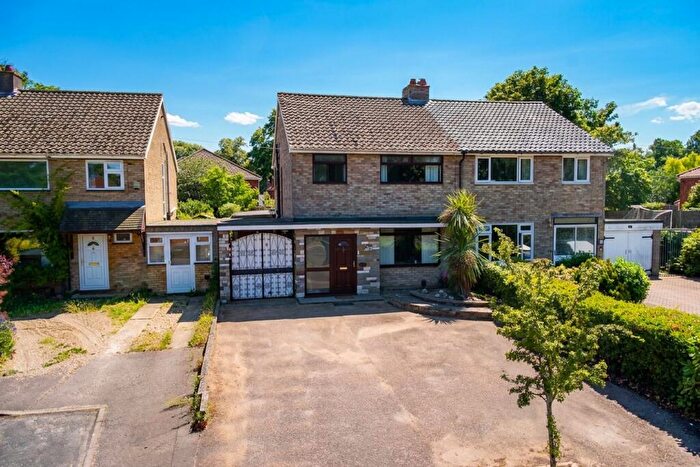
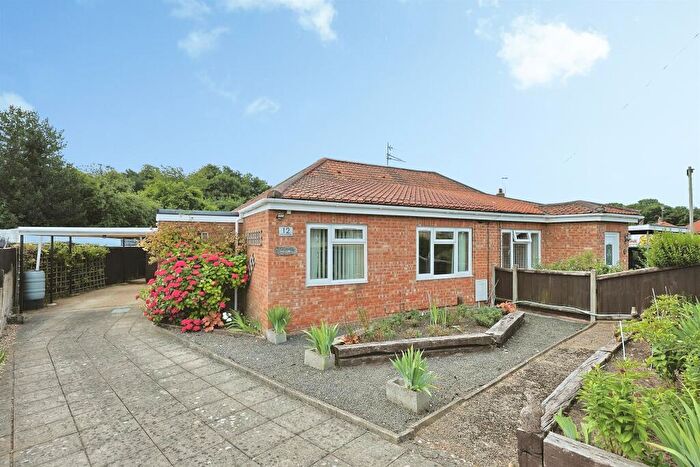
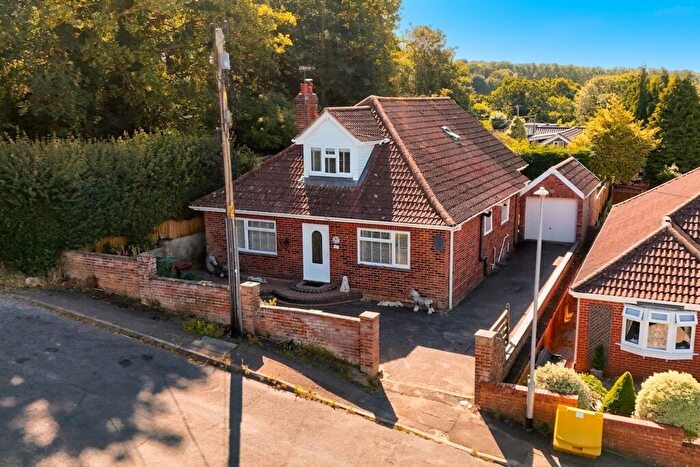
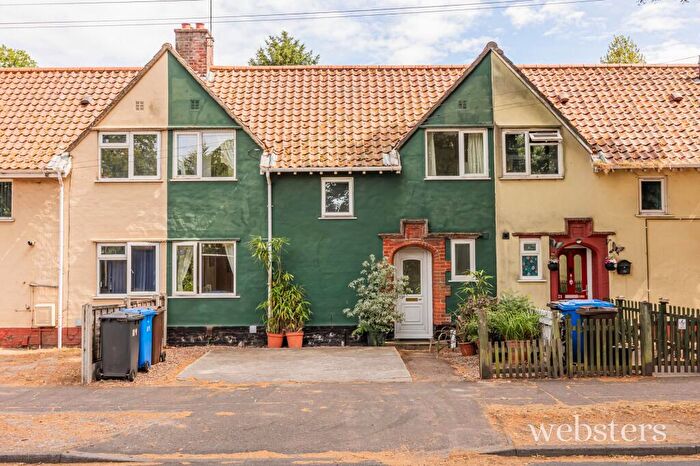
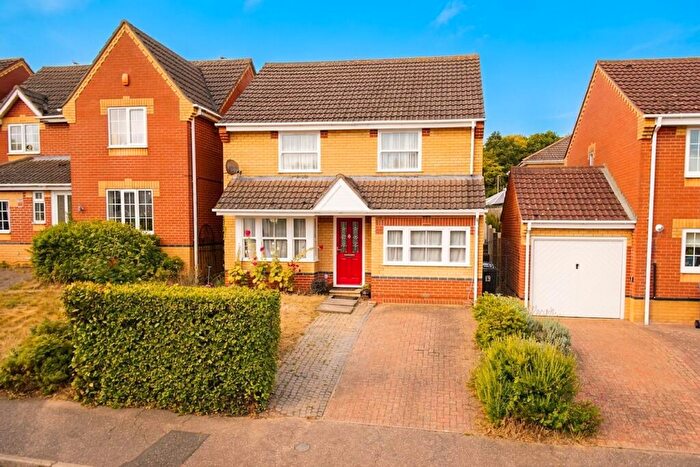
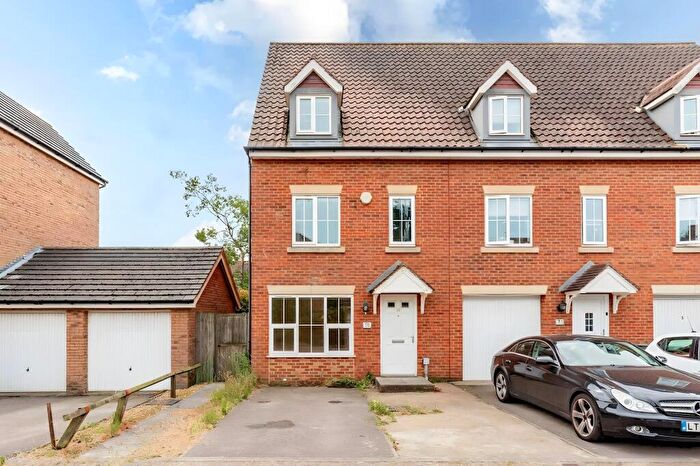
Houses and Flats for sale in NR5, Norwich
There are 145 results. Property prices in NR5 range from £80k to £1.1M with an average price of £289k.


![]()
If you are looking to sell your house, let it out, or receive a property valuation, an expert can help you.
Click the button below to get started.

Frequently Asked Questions about NR5
What is the average price for a property for sale in NR5?
The average price for a property for sale in NR5 is £258,497. There are 145 property listings for sale in NR5.
Which areas are included in the NR5 postcode district?
The main area within NR5 is Norwich.
What are the most common property types in NR5?
The most common property types in NR5 are Semi Detached Houses, Detached Houses, Terraced Houses and Flats.
What has been the average sold property price in NR5 over the last three years?
Semi Detached Houses in NR5 have an average sold price of £250,971, while Detached Houses have an average of £327,555. Terraced Houses have an average of £223,559 and Flats have an average of £140,145. The average sold property price in NR5 over the last three years is approximately £258,971.