
Properties for sale in OX39
Chinnor
- Info
- Price Paid By Year
- Property Type Price
- Transport
House Prices in OX39
Properties in OX39 have an average house price of £506,083.00 and had 353 Property Transactions within the last 3 years.
The most expensive property was sold for £3,550,000.00.
Property Price Paid in OX39 by Year
The average sold property price by year was:
| Year | Average Sold Price | Sold Properties |
|---|---|---|
| 2026 | £521,388.00 | 9 Properties |
| 2025 | £512,447.00 | 105 Properties |
| 2024 | £497,964.00 | 123 Properties |
| 2023 | £507,742.00 | 116 Properties |
| 2022 | £575,414.00 | 125 Properties |
| 2021 | £496,394.00 | 185 Properties |
| 2020 | £479,146.00 | 177 Properties |
| 2019 | £441,985.00 | 224 Properties |
| 2018 | £451,732.00 | 198 Properties |
| 2017 | £440,993.00 | 153 Properties |
| 2016 | £384,616.00 | 131 Properties |
| 2015 | £428,091.00 | 144 Properties |
| 2014 | £364,112.00 | 150 Properties |
| 2013 | £334,164.00 | 133 Properties |
| 2012 | £288,929.00 | 96 Properties |
| 2011 | £336,227.00 | 109 Properties |
| 2010 | £318,600.00 | 115 Properties |
| 2009 | £283,008.00 | 90 Properties |
| 2008 | £385,541.00 | 68 Properties |
| 2007 | £321,824.00 | 132 Properties |
| 2006 | £294,931.00 | 162 Properties |
| 2005 | £308,030.00 | 105 Properties |
| 2004 | £263,910.00 | 143 Properties |
| 2003 | £247,985.00 | 109 Properties |
| 2002 | £233,331.00 | 127 Properties |
| 2001 | £180,219.00 | 132 Properties |
| 2000 | £170,903.00 | 138 Properties |
| 1999 | £157,983.00 | 162 Properties |
| 1998 | £132,123.00 | 129 Properties |
| 1997 | £119,724.00 | 150 Properties |
| 1996 | £104,345.00 | 163 Properties |
| 1995 | £101,485.00 | 99 Properties |
Property Price per Property Type in OX39
Here you can find historic sold price data in order to help with your property search.
The average Property Paid Price for specific property types in the last three years are:
| Property Type | Average Sold Price | Sold Properties |
|---|---|---|
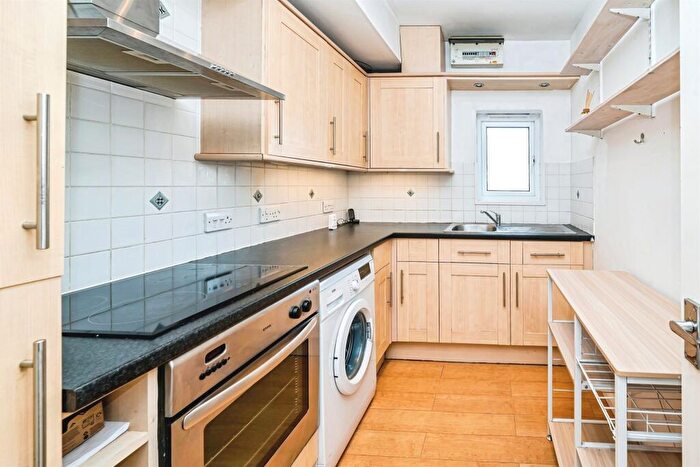
| Flat | £229,812.00 | 16 Flats |
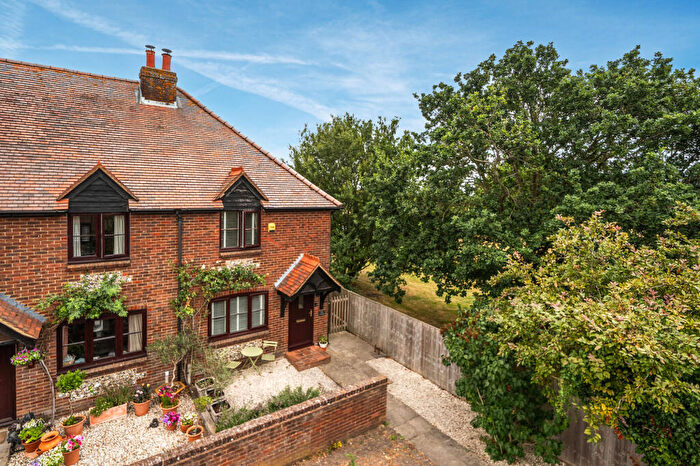
| Semi Detached House | £439,167.00 | 123 Semi Detached Houses |
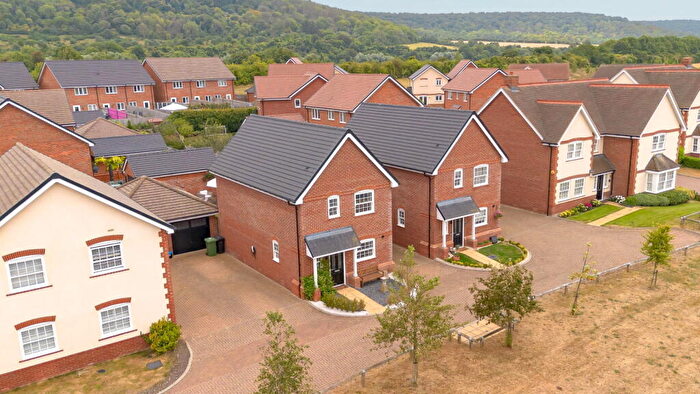
| Detached House | £697,512.00 | 121 Detached Houses |
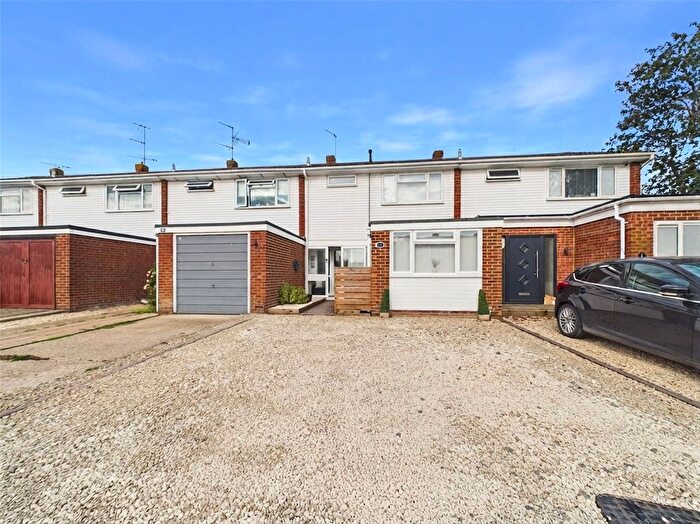
| Terraced House | £393,050.00 | 93 Terraced Houses |

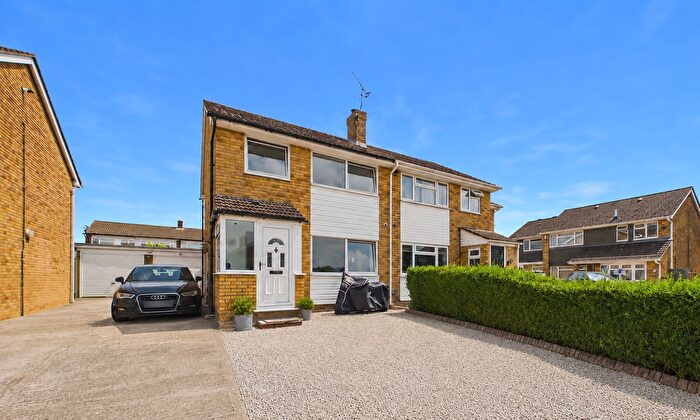
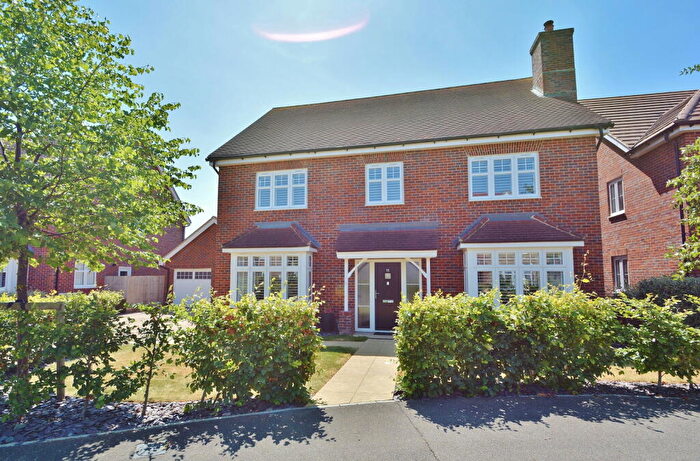
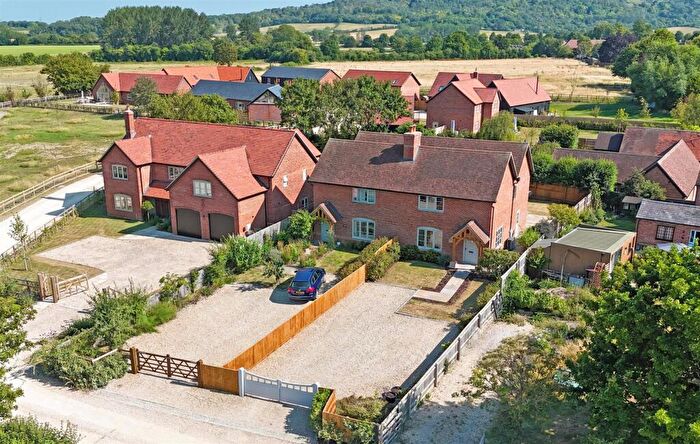
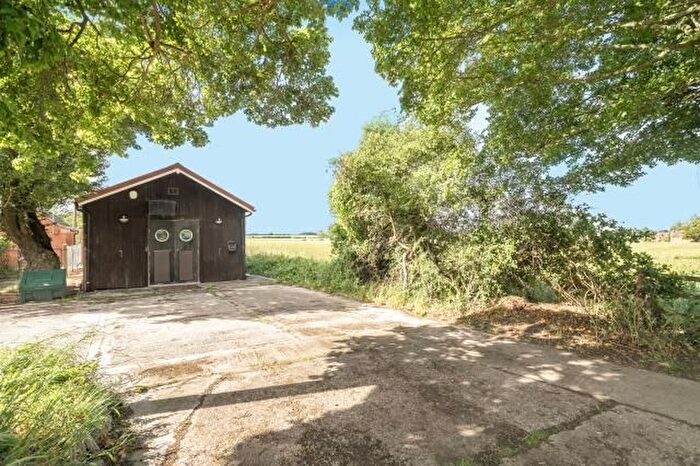
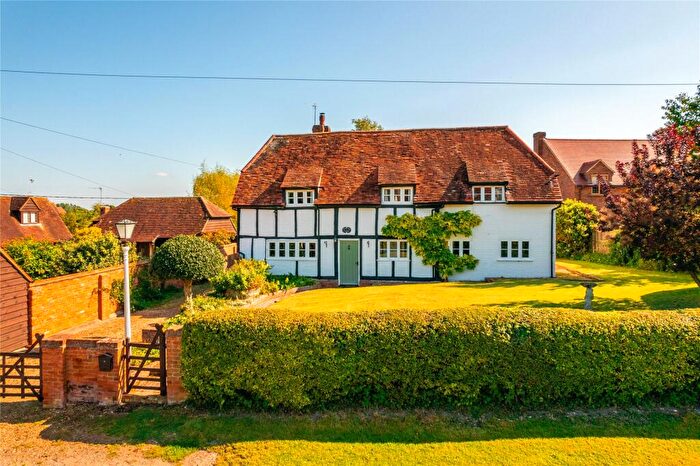
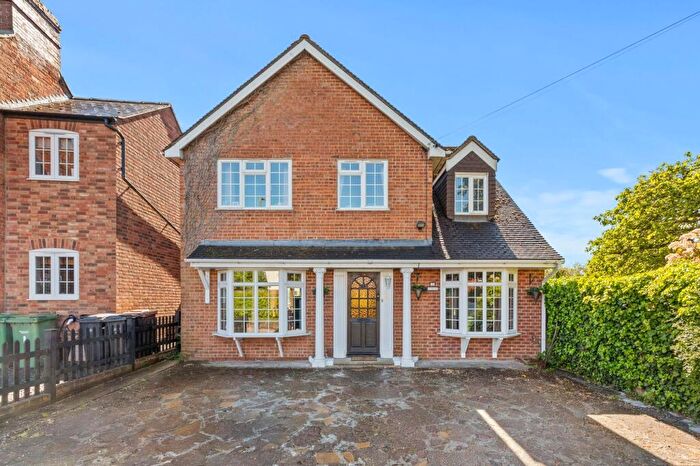
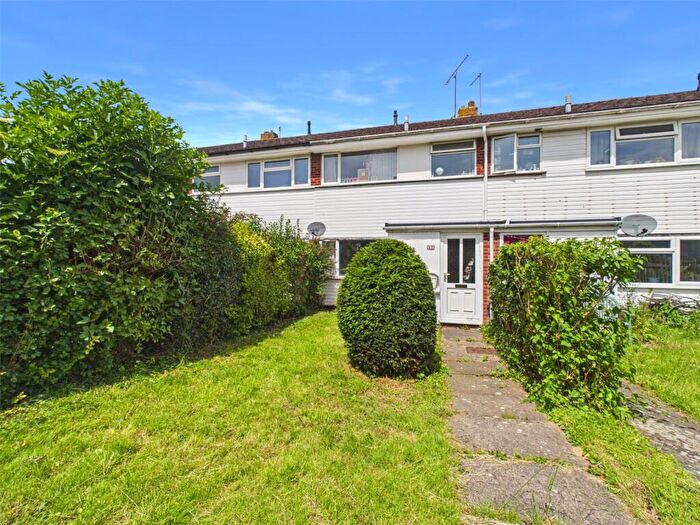
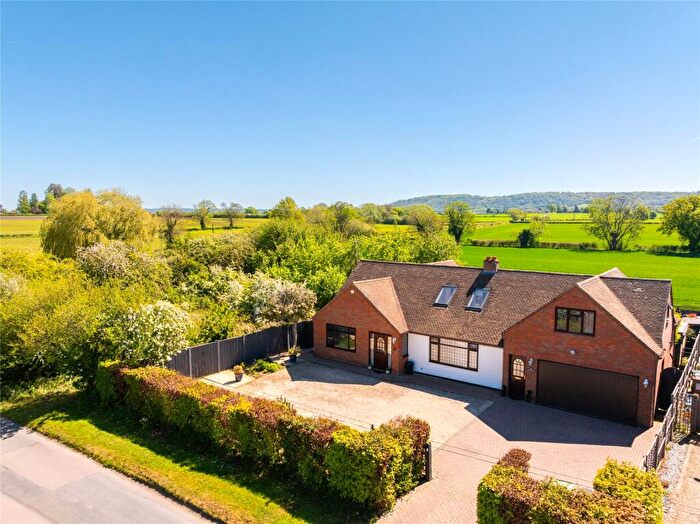
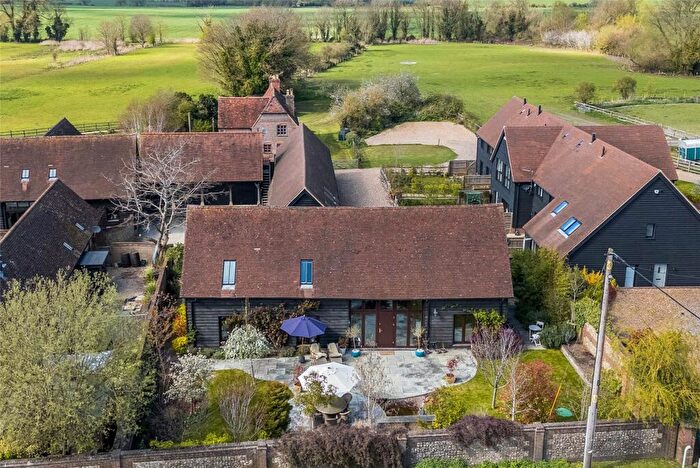
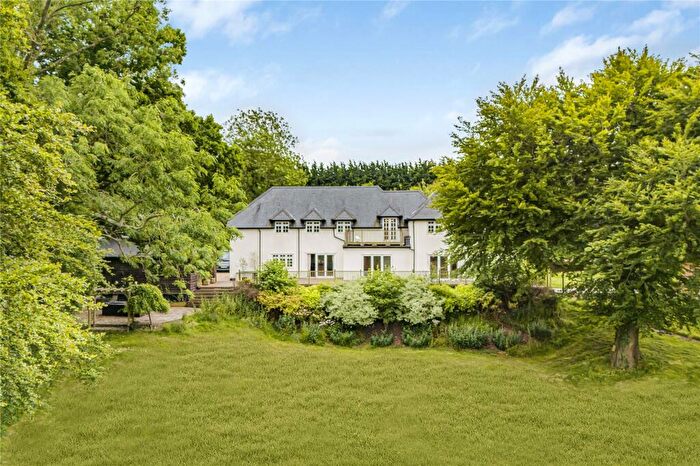
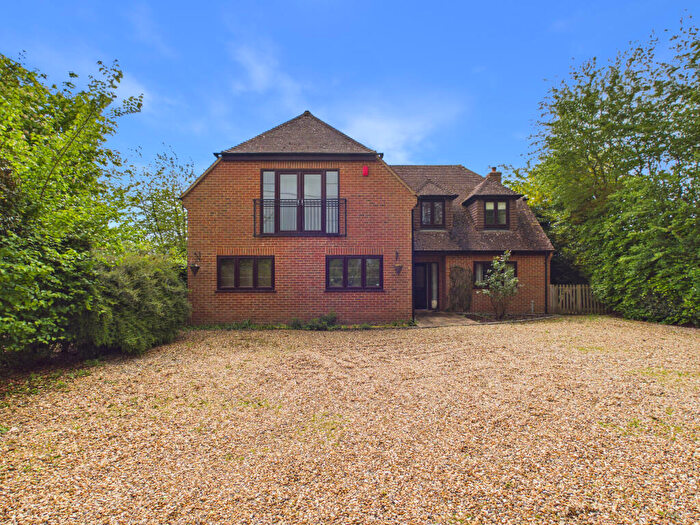
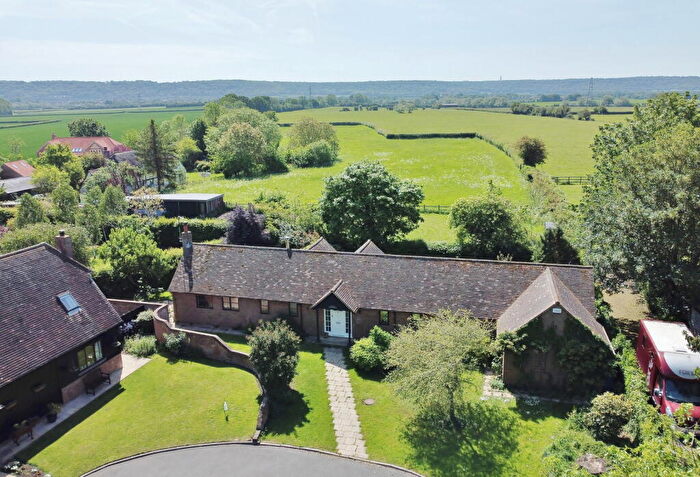
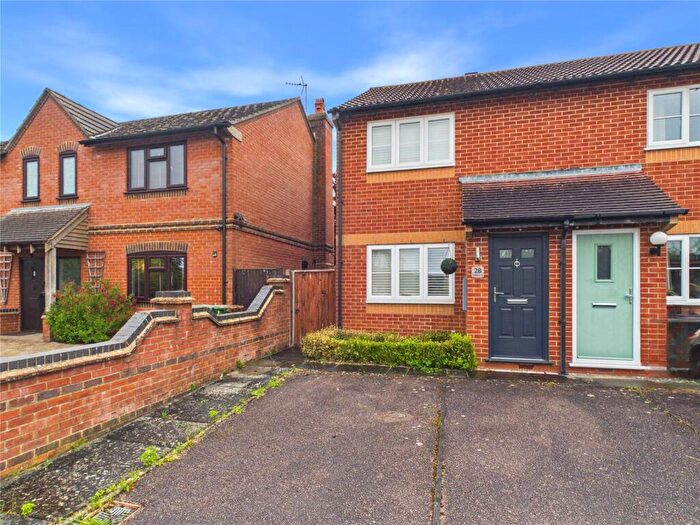
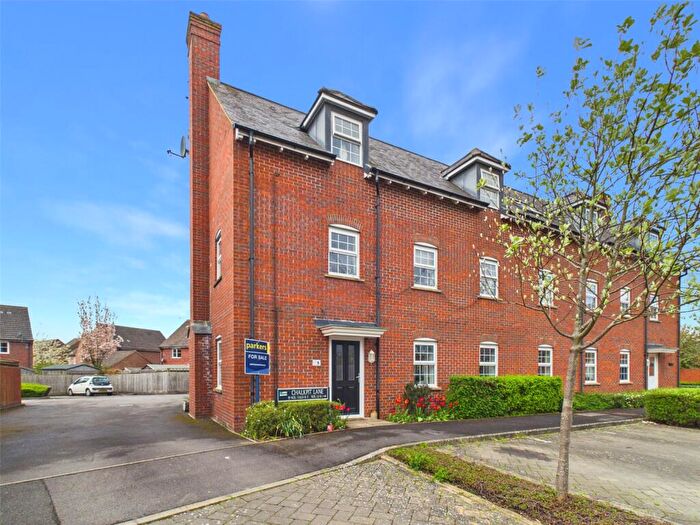
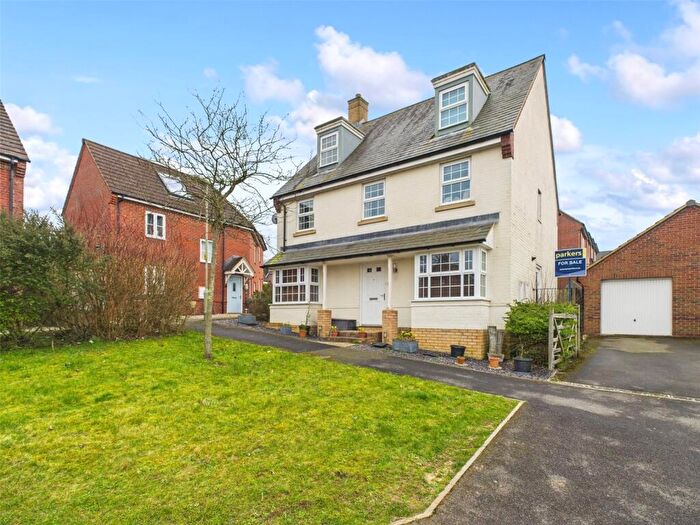
Houses and Flats for sale in OX39, Chinnor
There are 28 results. Property prices in OX39 range from £175k to £1.83M with an average price of £702k.

![]()
If you are looking to sell your house, let it out, or receive a property valuation, an expert can help you.
Click the button below to get started.

Frequently Asked Questions about OX39
What is the average price for a property for sale in OX39?
The average price for a property for sale in OX39 is £506,083. There are 28 property listings for sale in OX39.
Which areas are included in the OX39 postcode district?
The main area within OX39 is Chinnor.
What are the most common property types in OX39?
The most common property types in OX39 are Semi Detached Houses, Detached Houses, Terraced Houses and Flats.
What has been the average sold property price in OX39 over the last three years?
Semi Detached Houses in OX39 have an average sold price of £439,167, while Detached Houses have an average of £697,512. Terraced Houses have an average of £393,050 and Flats have an average of £229,812. The average sold property price in OX39 over the last three years is approximately £510,600.