
Properties for sale in PO11
Hayling Island
- Info
- Price Paid By Year
- Property Type Price
- Transport
House Prices in PO11
Properties in PO11 have an average house price of £370,019.00 and had 757 Property Transactions within the last 3 years.
The most expensive property was sold for £1,745,000.00.
Property Price Paid in PO11 by Year
The average sold property price by year was:
| Year | Average Sold Price | Sold Properties |
|---|---|---|
| 2026 | £423,325.00 | 20 Properties |
| 2025 | £365,016.00 | 237 Properties |
| 2024 | £362,420.00 | 241 Properties |
| 2023 | £377,551.00 | 259 Properties |
| 2022 | £397,095.00 | 331 Properties |
| 2021 | £393,814.00 | 450 Properties |
| 2020 | £356,951.00 | 308 Properties |
| 2019 | £303,257.00 | 260 Properties |
| 2018 | £308,477.00 | 371 Properties |
| 2017 | £320,850.00 | 393 Properties |
| 2016 | £301,762.00 | 439 Properties |
| 2015 | £258,056.00 | 376 Properties |
| 2014 | £261,042.00 | 400 Properties |
| 2013 | £249,764.00 | 318 Properties |
| 2012 | £233,107.00 | 265 Properties |
| 2011 | £235,884.00 | 231 Properties |
| 2010 | £258,313.00 | 295 Properties |
| 2009 | £218,771.00 | 259 Properties |
| 2008 | £228,857.00 | 217 Properties |
| 2007 | £236,181.00 | 533 Properties |
| 2006 | £225,009.00 | 458 Properties |
| 2005 | £208,807.00 | 357 Properties |
| 2004 | £211,018.00 | 427 Properties |
| 2003 | £187,919.00 | 409 Properties |
| 2002 | £160,432.00 | 500 Properties |
| 2001 | £134,154.00 | 481 Properties |
| 2000 | £115,697.00 | 416 Properties |
| 1999 | £102,753.00 | 620 Properties |
| 1998 | £91,470.00 | 544 Properties |
| 1997 | £87,369.00 | 599 Properties |
| 1996 | £77,427.00 | 501 Properties |
| 1995 | £68,057.00 | 374 Properties |
Property Price per Property Type in PO11
Here you can find historic sold price data in order to help with your property search.
The average Property Paid Price for specific property types in the last three years are:
| Property Type | Average Sold Price | Sold Properties |
|---|---|---|
| Semi Detached House | £359,852.00 | 144 Semi Detached Houses |
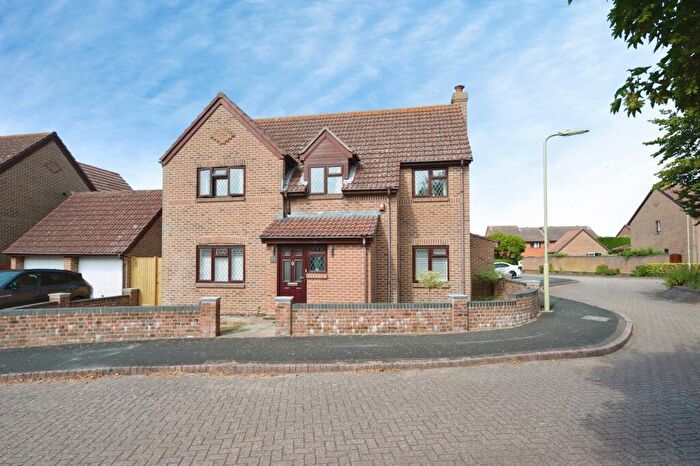
| Detached House | £493,516.00 | 351 Detached Houses |
| Terraced House | £313,468.00 | 63 Terraced Houses |
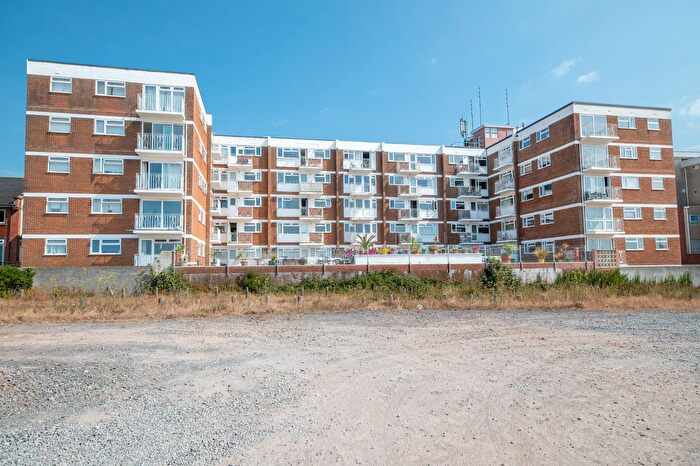
| Flat | £177,453.00 | 199 Flats |

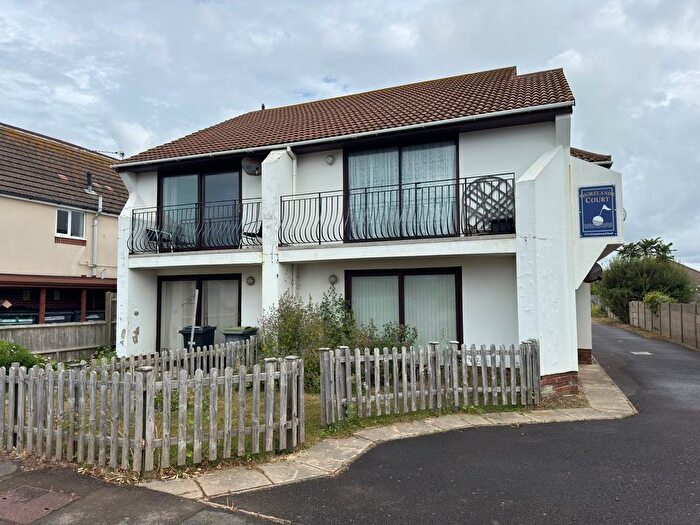
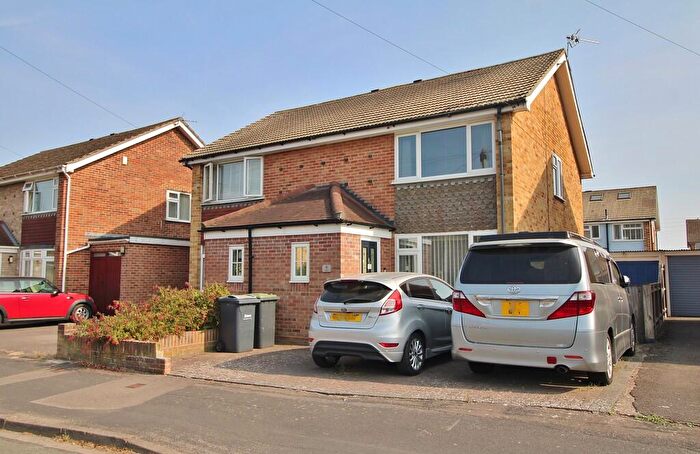
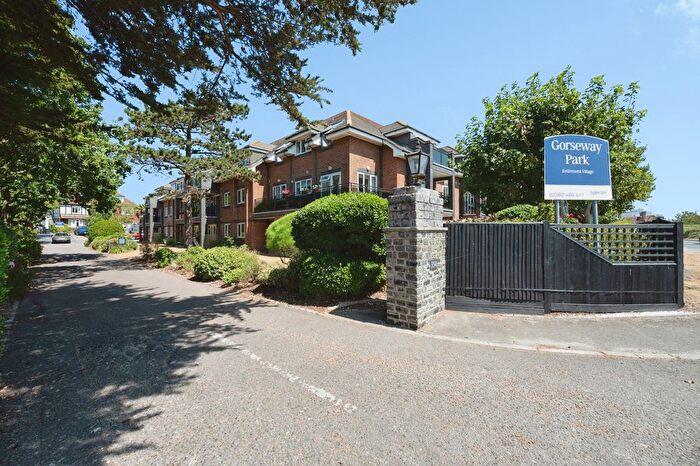
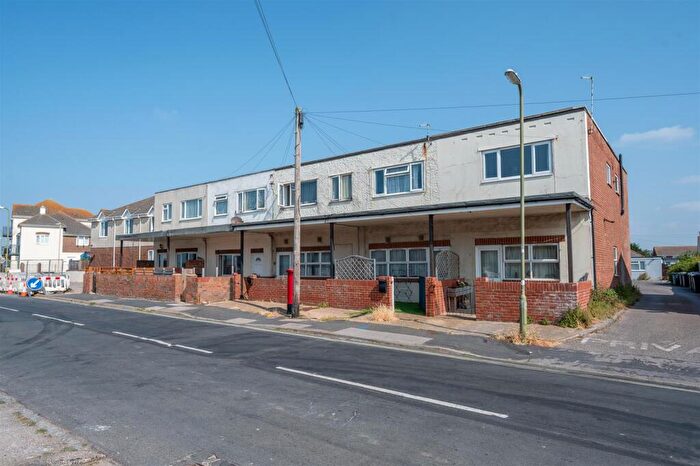
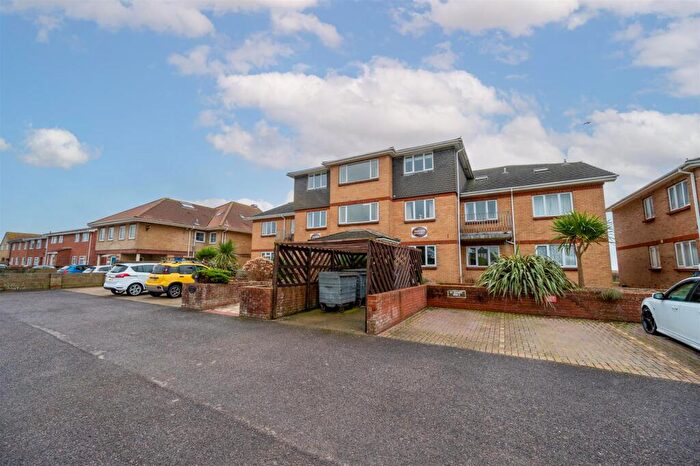
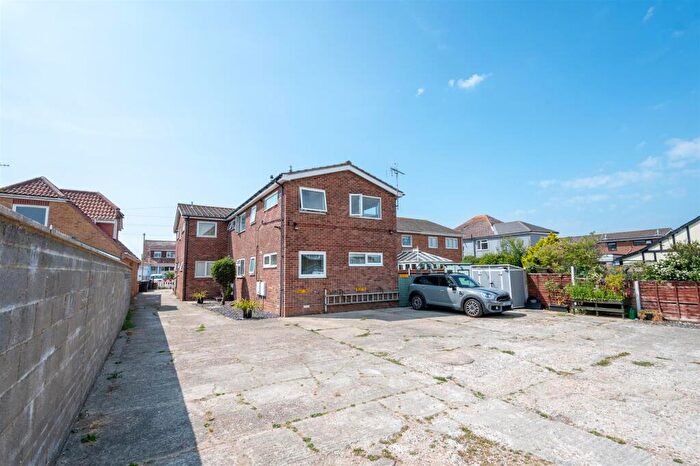
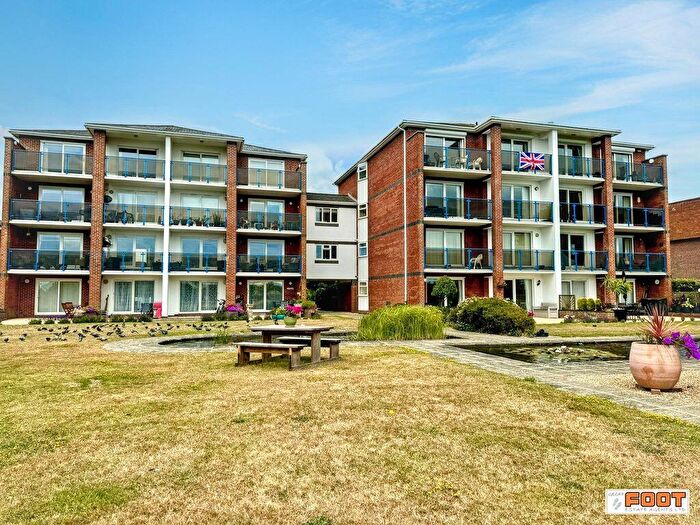
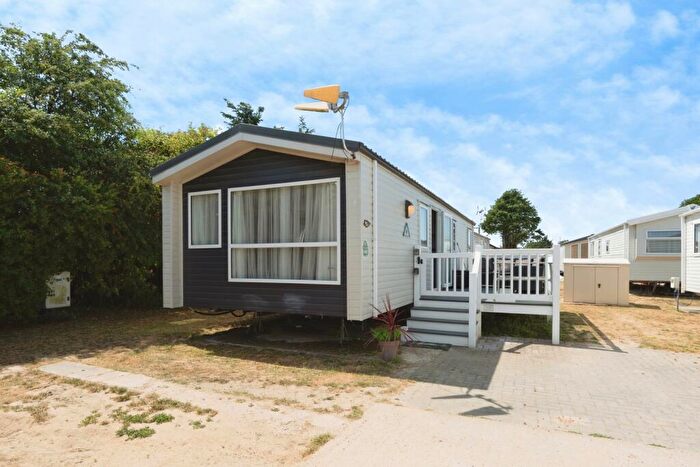
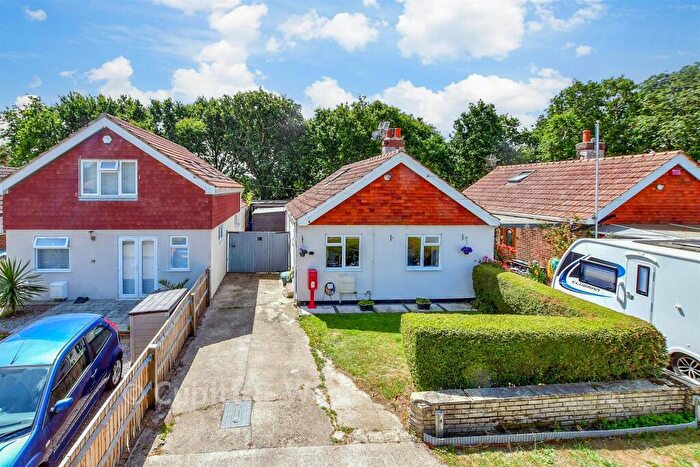
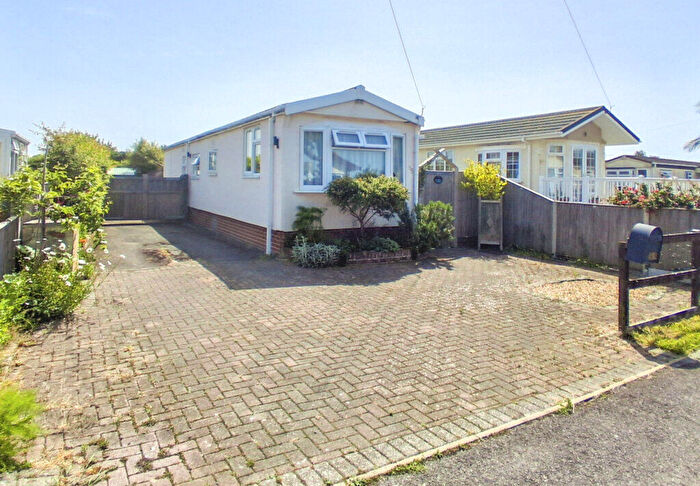
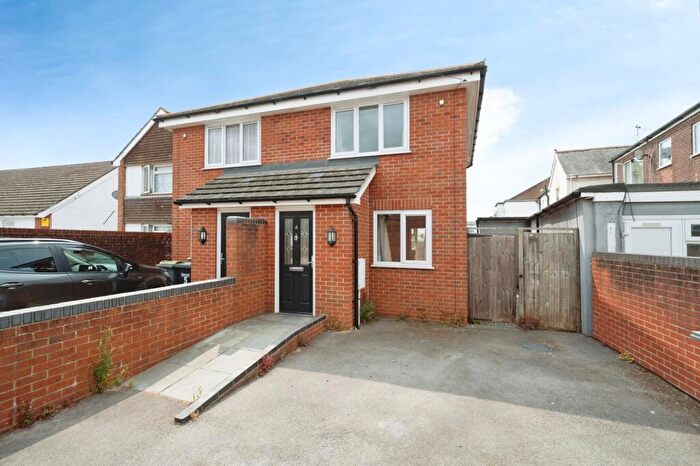
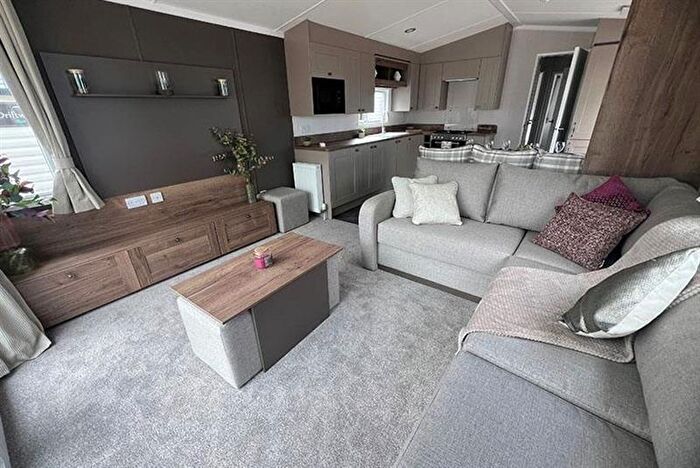
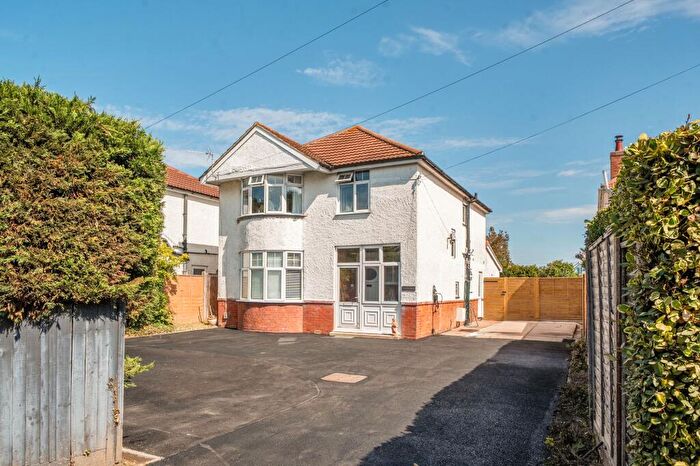
Houses and Flats for sale in PO11, Hayling Island
There are 352 results. Property prices in PO11 range from £22k to £2M with an average price of £421k.


![]()
If you are looking to sell your house, let it out, or receive a property valuation, an expert can help you.
Click the button below to get started.

Frequently Asked Questions about PO11
What is the average price for a property for sale in PO11?
The average price for a property for sale in PO11 is £370,019. There are 352 property listings for sale in PO11.
Which areas are included in the PO11 postcode district?
The main area within PO11 is Hayling Island.
What are the most common property types in PO11?
The most common property types in PO11 are Detached Houses, Flats, Semi Detached Houses and Terraced Houses.
What has been the average sold property price in PO11 over the last three years?
Detached Houses in PO11 have an average sold price of £493,516, while Flats have an average of £177,453. Semi Detached Houses have an average of £359,852 and Terraced Houses have an average of £313,468. The average sold property price in PO11 over the last three years is approximately £383,587.