
Properties for sale in PO19
Chichester
- Info
- Price Paid By Year
- Property Type Price
- Transport
House Prices in PO19
Properties in PO19 have an average house price of £423,069.00 and had 1412 Property Transactions within the last 3 years.
The most expensive property was sold for £3,430,445.00.
Property Price Paid in PO19 by Year
The average sold property price by year was:
| Year | Average Sold Price | Sold Properties |
|---|---|---|
| 2026 | £366,725.00 | 31 Properties |
| 2025 | £431,025.00 | 424 Properties |
| 2024 | £415,679.00 | 505 Properties |
| 2023 | £427,727.00 | 452 Properties |
| 2022 | £422,160.00 | 582 Properties |
| 2021 | £413,478.00 | 726 Properties |
| 2020 | £382,656.00 | 533 Properties |
| 2019 | £365,109.00 | 525 Properties |
| 2018 | £384,639.00 | 589 Properties |
| 2017 | £371,149.00 | 611 Properties |
| 2016 | £371,235.00 | 658 Properties |
| 2015 | £331,653.00 | 732 Properties |
| 2014 | £317,392.00 | 703 Properties |
| 2013 | £298,152.00 | 666 Properties |
| 2012 | £292,969.00 | 603 Properties |
| 2011 | £283,874.00 | 511 Properties |
| 2010 | £268,594.00 | 566 Properties |
| 2009 | £234,436.00 | 579 Properties |
| 2008 | £257,532.00 | 475 Properties |
| 2007 | £266,821.00 | 753 Properties |
| 2006 | £245,461.00 | 774 Properties |
| 2005 | £232,735.00 | 675 Properties |
| 2004 | £229,416.00 | 750 Properties |
| 2003 | £211,224.00 | 633 Properties |
| 2002 | £168,765.00 | 762 Properties |
| 2001 | £142,652.00 | 735 Properties |
| 2000 | £127,711.00 | 642 Properties |
| 1999 | £111,354.00 | 757 Properties |
| 1998 | £104,106.00 | 730 Properties |
| 1997 | £91,994.00 | 737 Properties |
| 1996 | £82,086.00 | 636 Properties |
| 1995 | £77,510.00 | 478 Properties |
Property Price per Property Type in PO19
Here you can find historic sold price data in order to help with your property search.
The average Property Paid Price for specific property types in the last three years are:
| Property Type | Average Sold Price | Sold Properties |
|---|---|---|
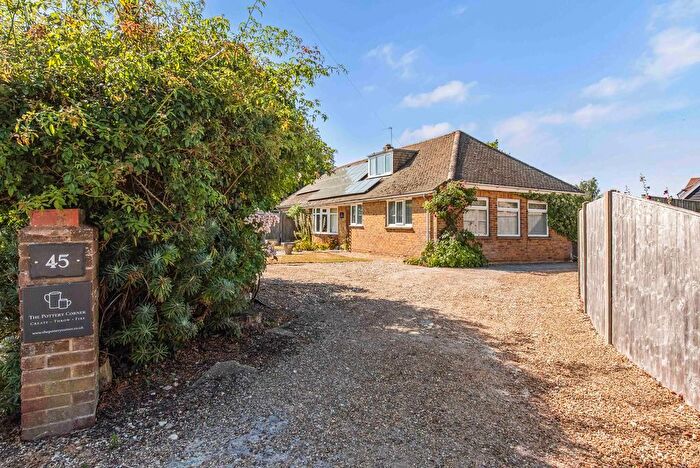
| Semi Detached House | £428,953.00 | 284 Semi Detached Houses |
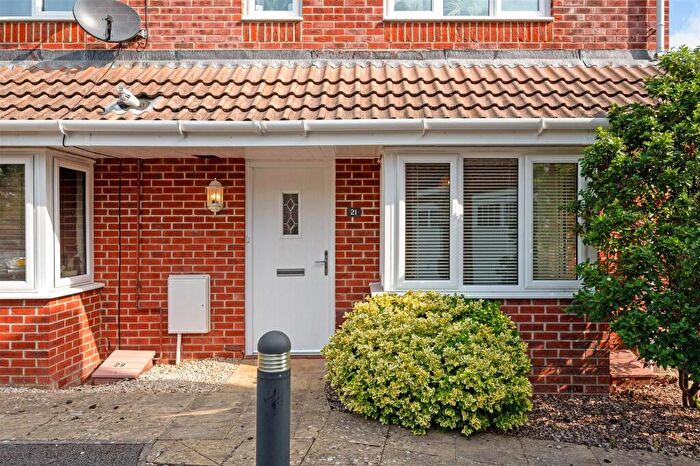
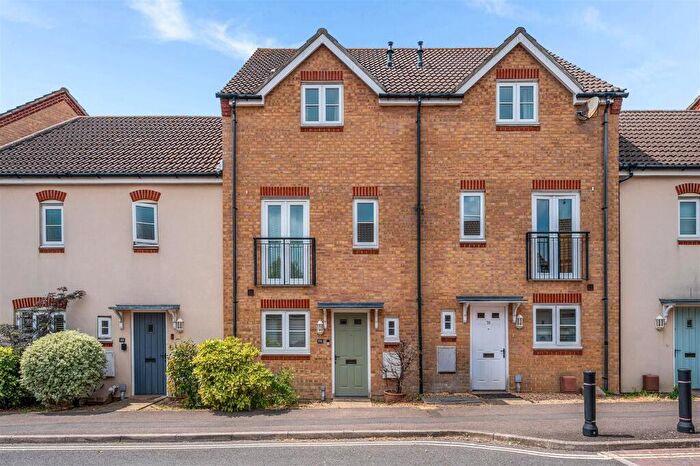
| Terraced House | £396,222.00 | 423 Terraced Houses |
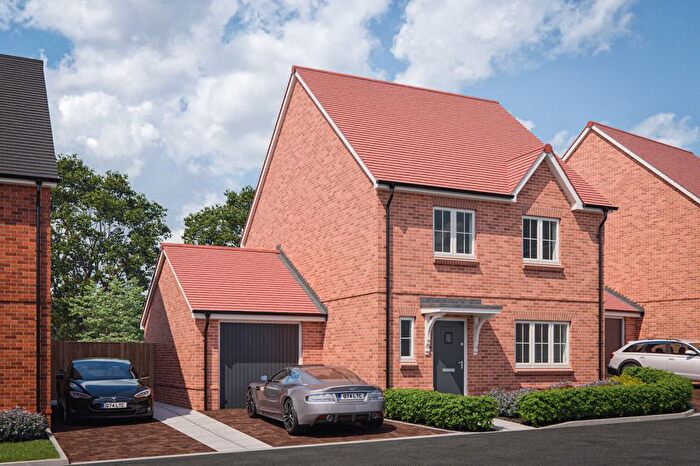
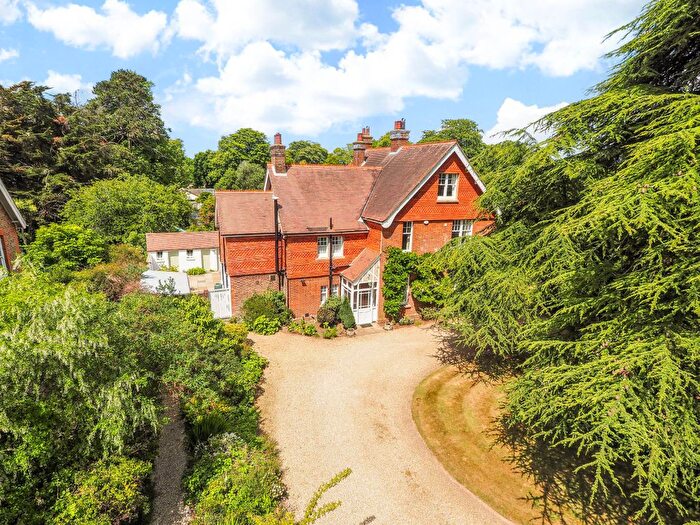
| Detached House | £726,224.00 | 269 Detached Houses |
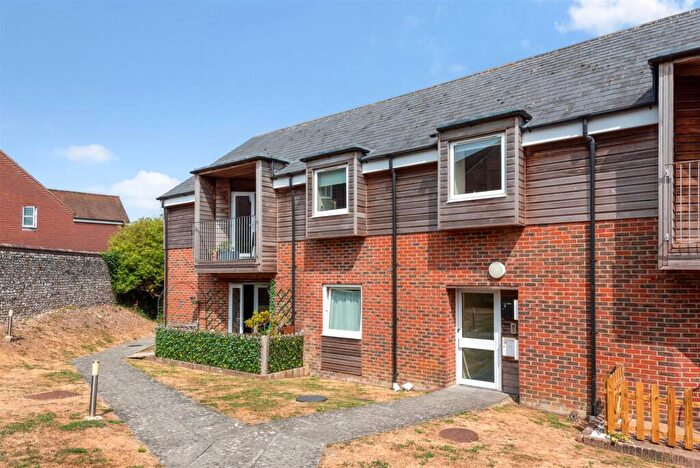
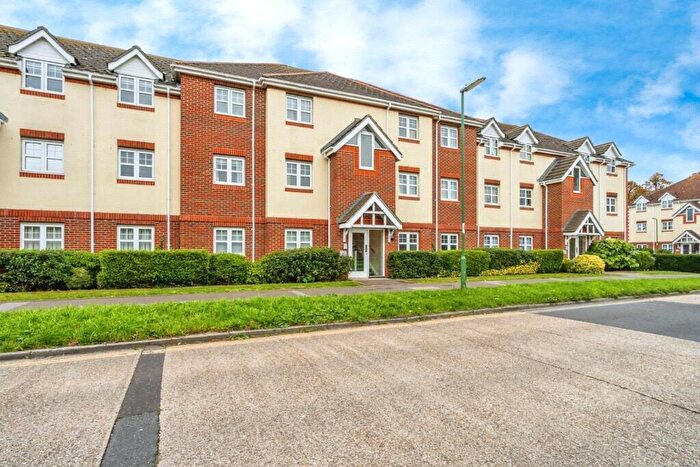
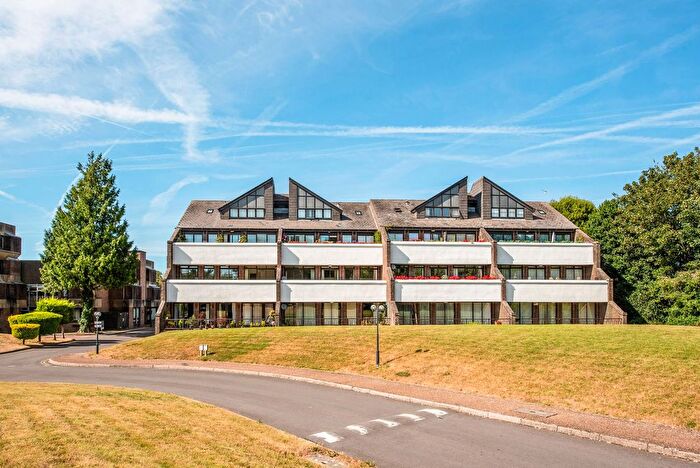
| Flat | £258,245.00 | 436 Flats |
Transport near PO19

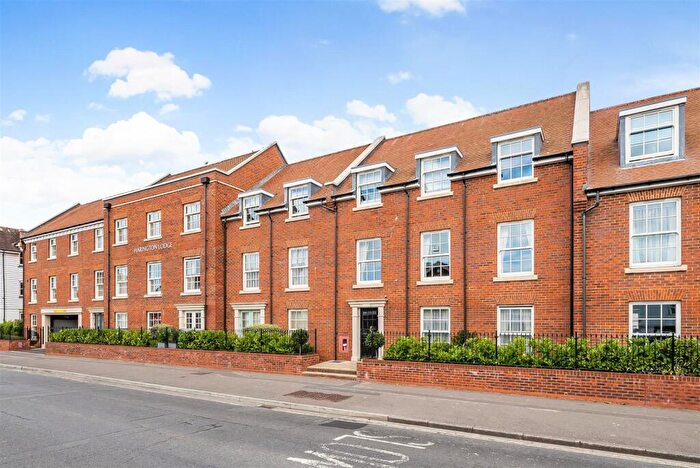
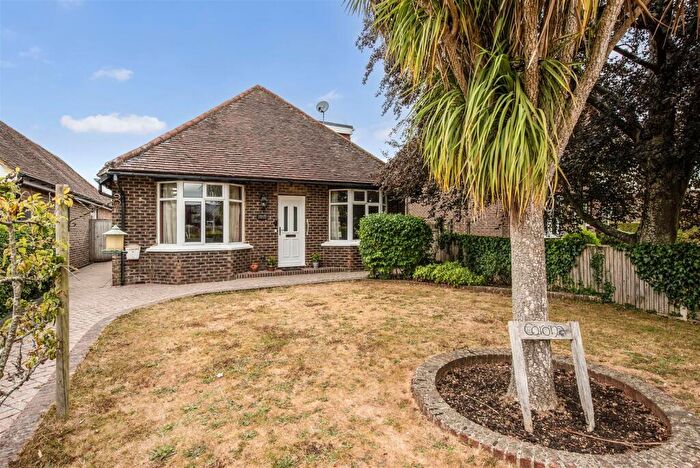
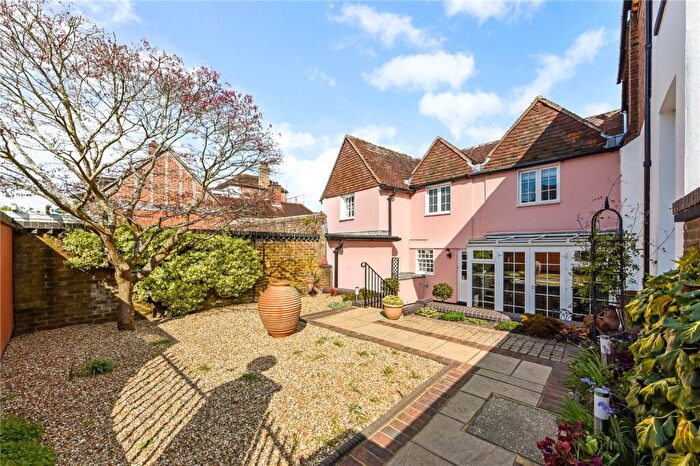
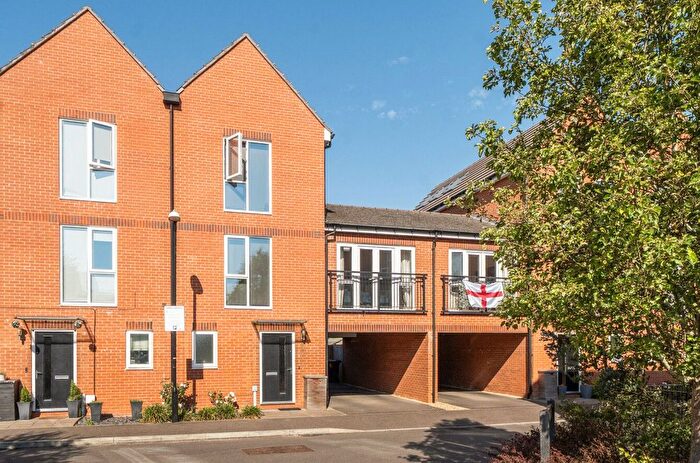
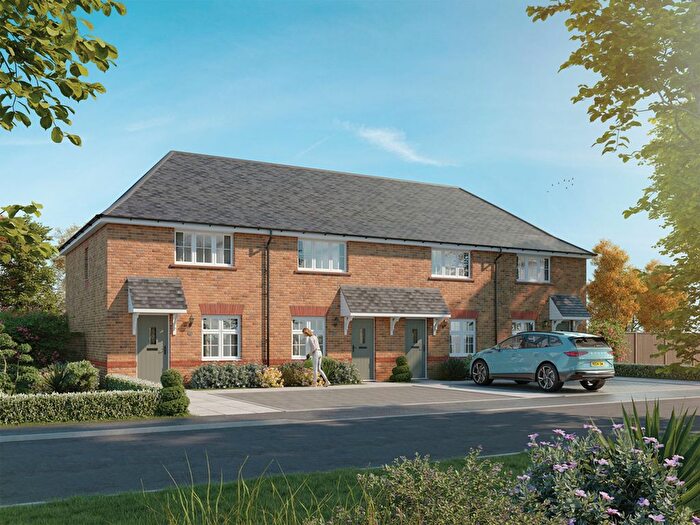
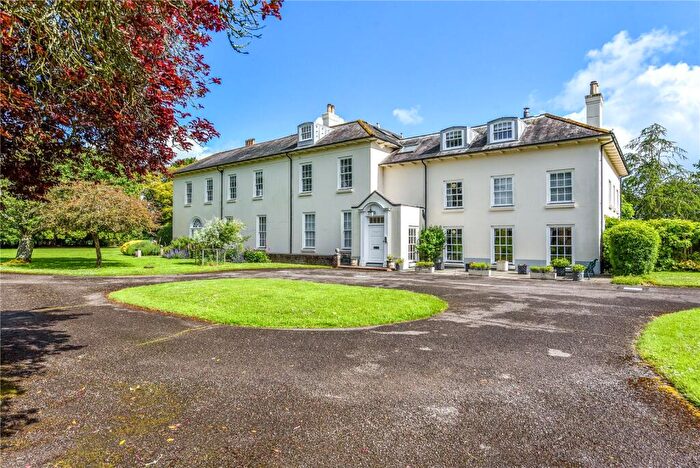
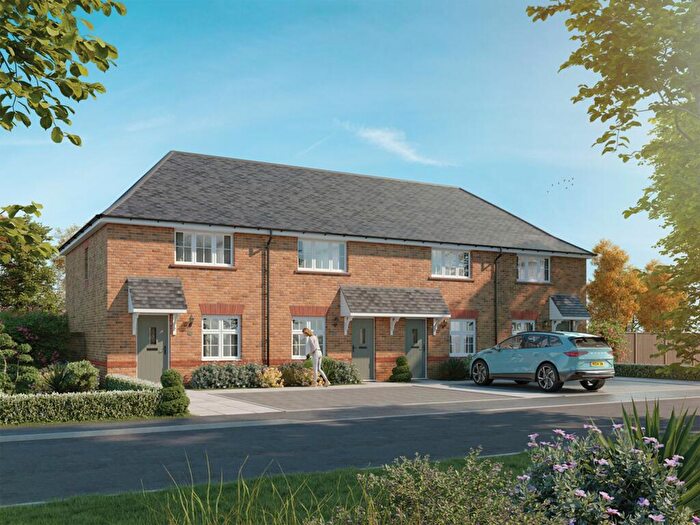
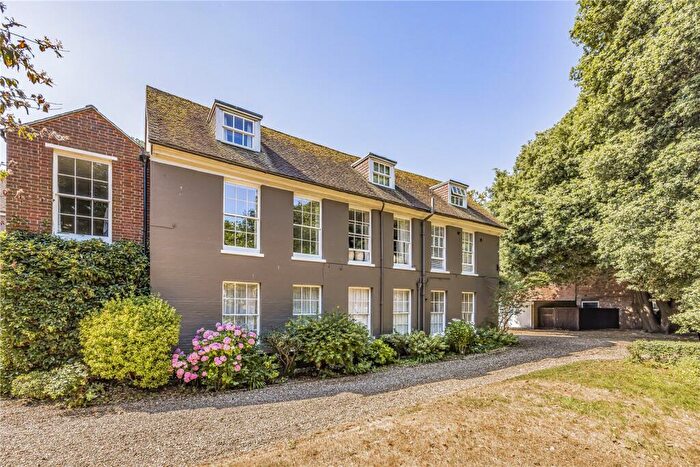
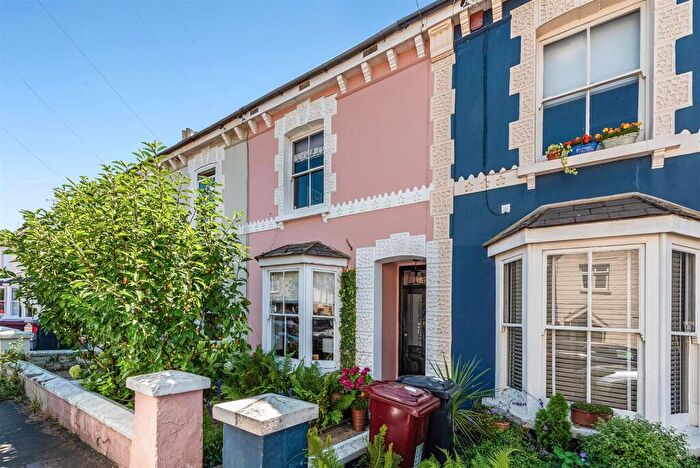
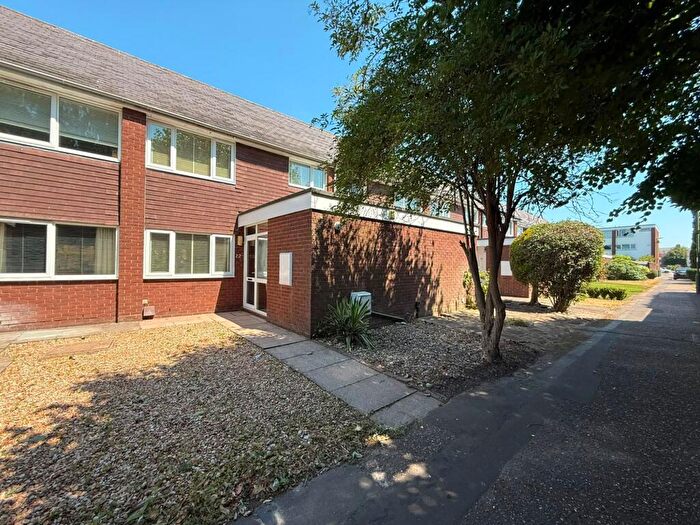
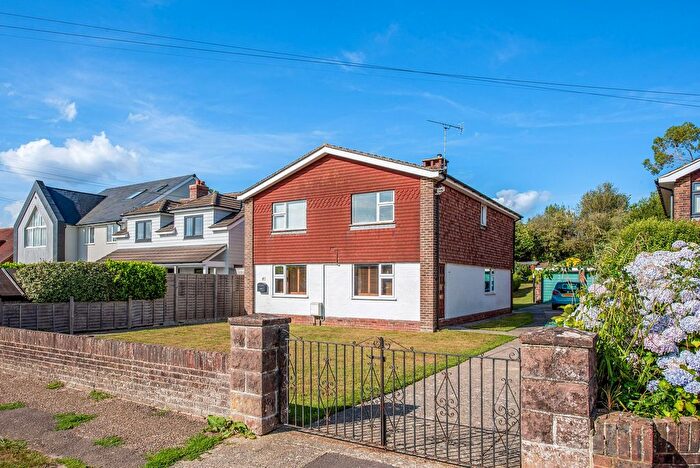
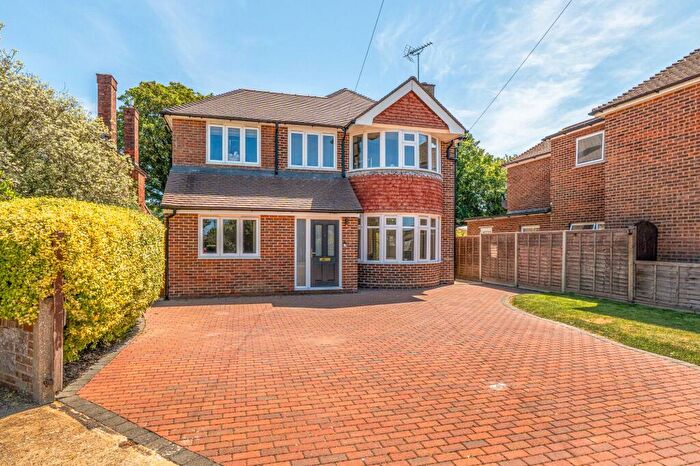
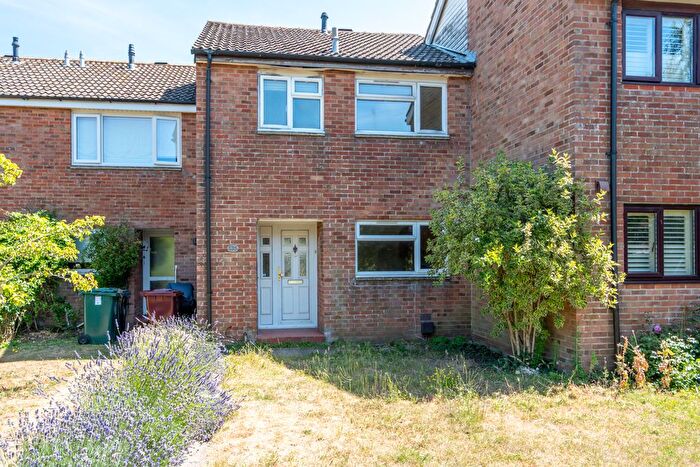
Houses and Flats for sale in PO19, Chichester
There are 337 results. Property prices in PO19 range from £55k to £2.75M with an average price of £444k.
![]()
If you are looking to sell your house, let it out, or receive a property valuation, an expert can help you.
Click the button below to get started.


Frequently Asked Questions about PO19
What is the average price for a property for sale in PO19?
The average price for a property for sale in PO19 is £423,069. There are 337 property listings for sale in PO19.
Which areas are included in the PO19 postcode district?
The main area within PO19 is Chichester.
What are the most common property types in PO19?
The most common property types in PO19 are Flats, Terraced Houses, Semi Detached Houses and Detached Houses.
What has been the average sold property price in PO19 over the last three years?
Flats in PO19 have an average sold price of £258,245, while Terraced Houses have an average of £396,222. Semi Detached Houses have an average of £428,953 and Detached Houses have an average of £726,224. The average sold property price in PO19 over the last three years is approximately £404,476.
Which train stations are available in PO19?
The train stations available in PO19 are Chichester Station and Fishbourne Station..