
Properties for sale in RG17
Hungerford
- Info
- Price Paid By Year
- Property Type Price
- Transport
House Prices in RG17
Properties in RG17 have an average house price of £507,468.00 and had 634 Property Transactions within the last 3 years.
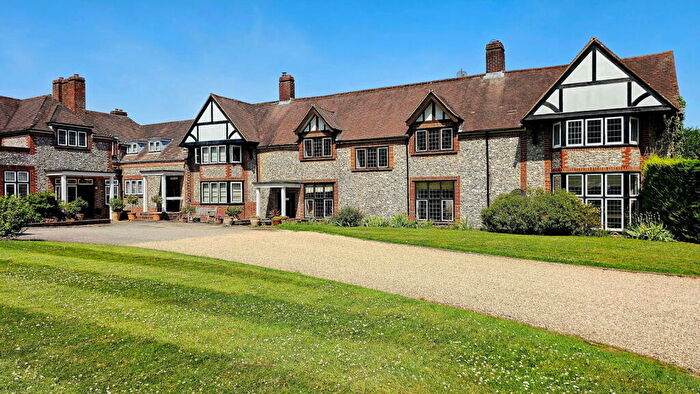
The most expensive property was sold for £4,300,000.00.
Property Price Paid in RG17 by Year
The average sold property price by year was:
| Year | Average Sold Price | Sold Properties |
|---|---|---|
| 2026 | £590,474.00 | 13 Properties |
| 2025 | £521,737.00 | 204 Properties |
| 2024 | £501,549.00 | 199 Properties |
| 2023 | £494,569.00 | 218 Properties |
| 2022 | £440,023.00 | 255 Properties |
| 2021 | £427,675.00 | 361 Properties |
| 2020 | £406,617.00 | 165 Properties |
| 2019 | £417,101.00 | 205 Properties |
| 2018 | £406,138.00 | 224 Properties |
| 2017 | £397,075.00 | 256 Properties |
| 2016 | £386,201.00 | 271 Properties |
| 2015 | £326,588.00 | 276 Properties |
| 2014 | £367,140.00 | 304 Properties |
| 2013 | £325,392.00 | 244 Properties |
| 2012 | £287,294.00 | 189 Properties |
| 2011 | £331,276.00 | 218 Properties |
| 2010 | £322,819.00 | 219 Properties |
| 2009 | £305,525.00 | 189 Properties |
| 2008 | £303,814.00 | 198 Properties |
| 2007 | £296,806.00 | 339 Properties |
| 2006 | £283,762.00 | 396 Properties |
| 2005 | £252,496.00 | 310 Properties |
| 2004 | £253,249.00 | 359 Properties |
| 2003 | £244,153.00 | 373 Properties |
| 2002 | £208,184.00 | 432 Properties |
| 2001 | £200,393.00 | 383 Properties |
| 2000 | £174,973.00 | 332 Properties |
| 1999 | £154,561.00 | 445 Properties |
| 1998 | £122,100.00 | 351 Properties |
| 1997 | £102,872.00 | 431 Properties |
| 1996 | £97,632.00 | 324 Properties |
| 1995 | £94,595.00 | 279 Properties |
Property Price per Property Type in RG17
Here you can find historic sold price data in order to help with your property search.
The average Property Paid Price for specific property types in the last three years are:
| Property Type | Average Sold Price | Sold Properties |
|---|---|---|
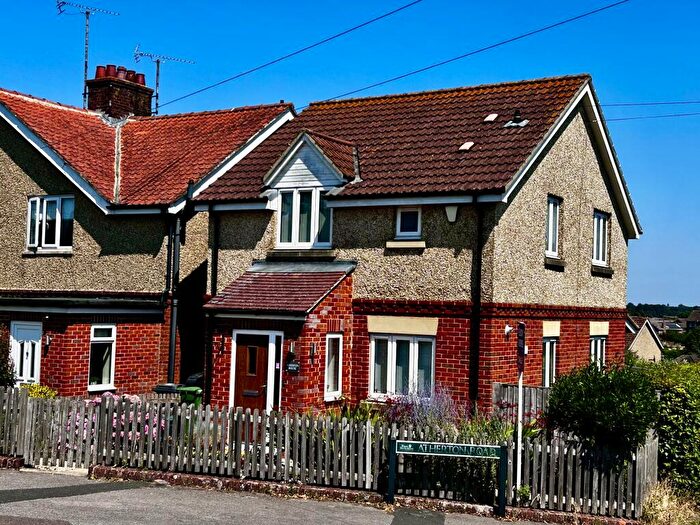
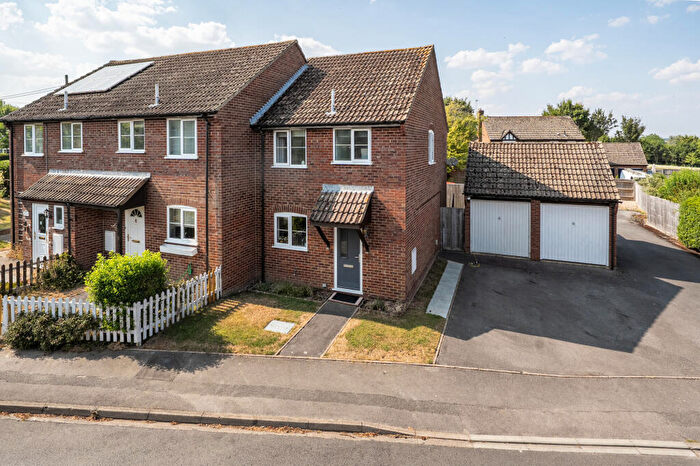
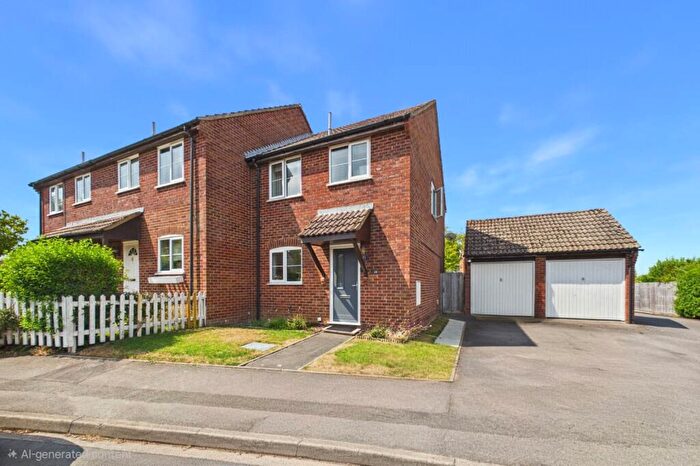
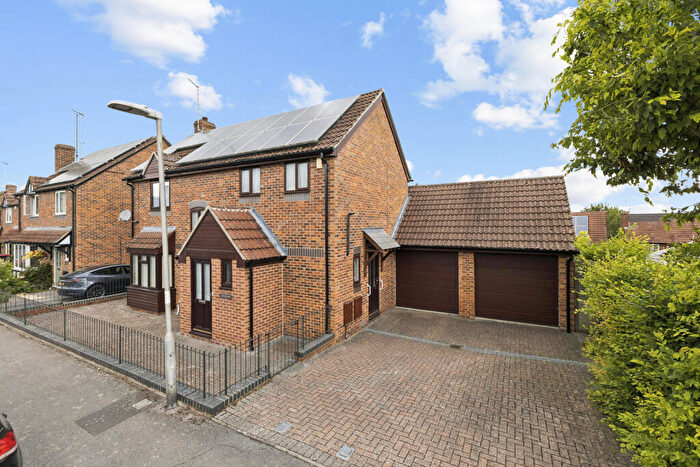
| Semi Detached House | £409,758.00 | 172 Semi Detached Houses |
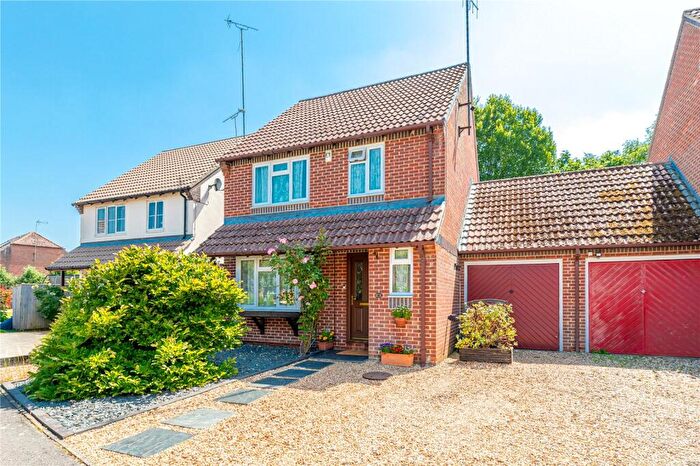
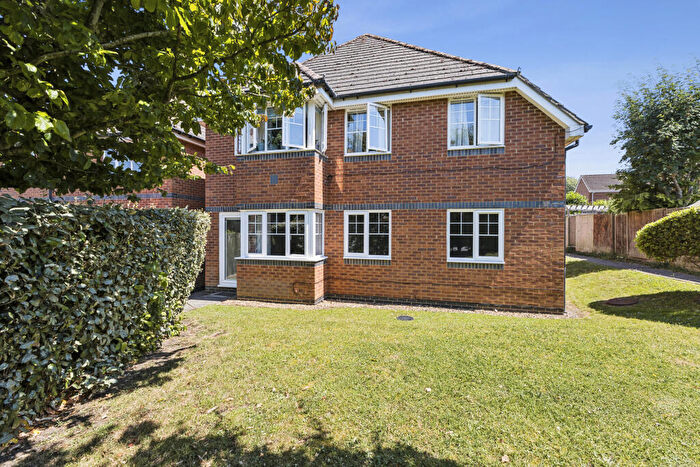
| Detached House | £810,890.00 | 212 Detached Houses |
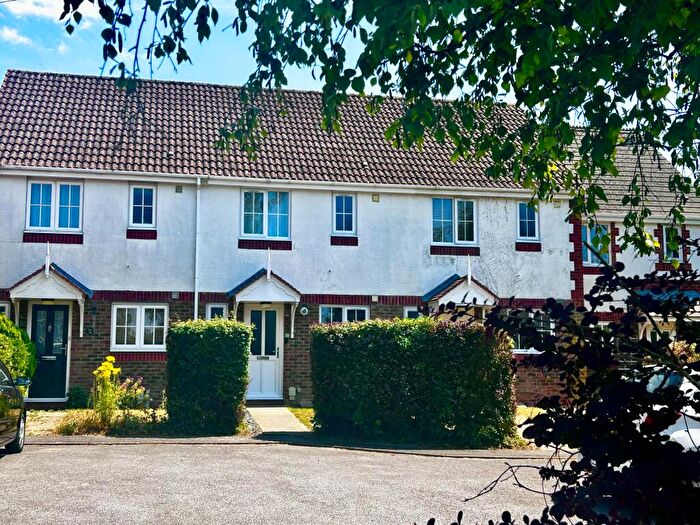
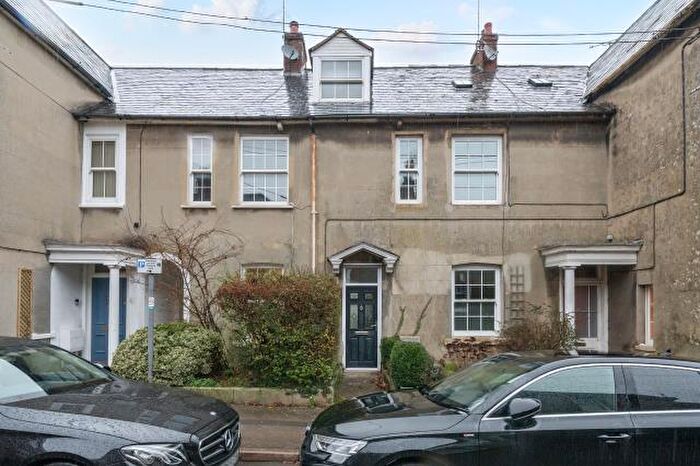
| Terraced House | £321,769.00 | 163 Terraced Houses |
| Flat | £309,188.00 | 87 Flats |
Transport near RG17

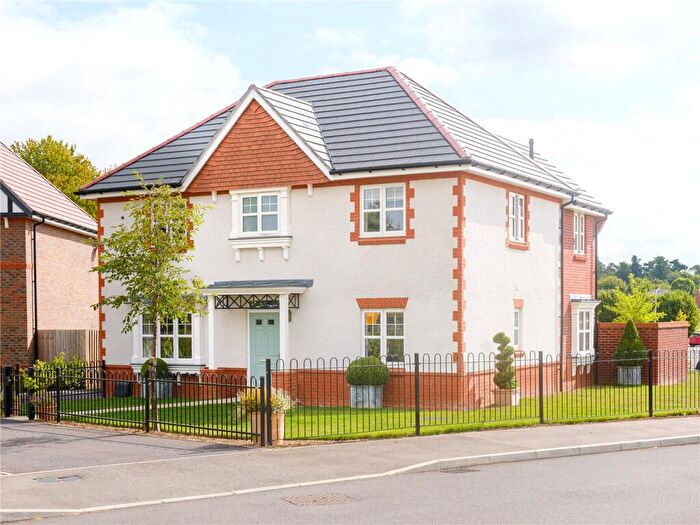
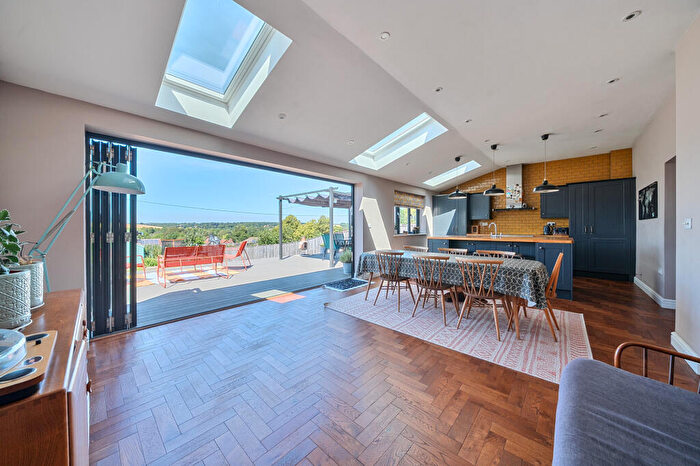
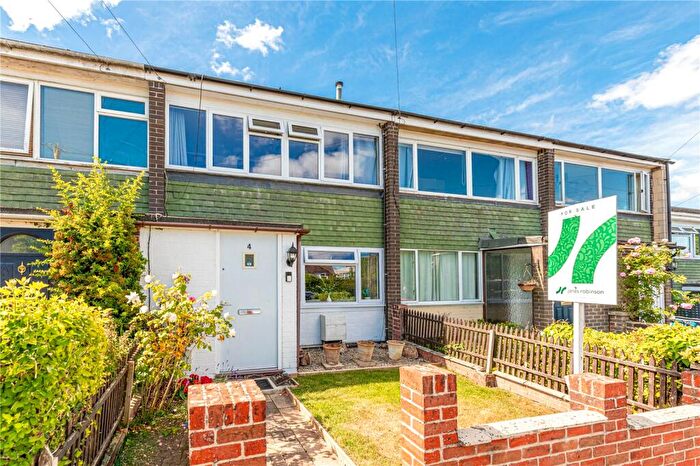
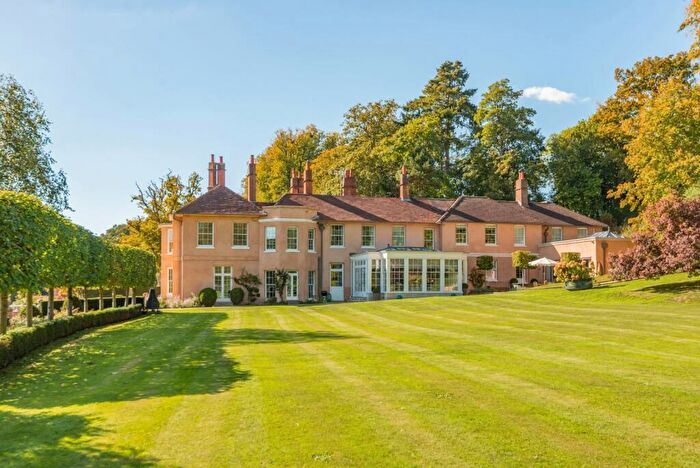
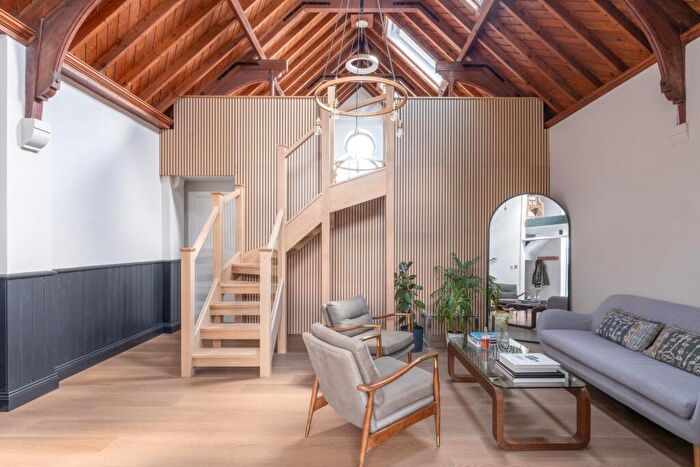
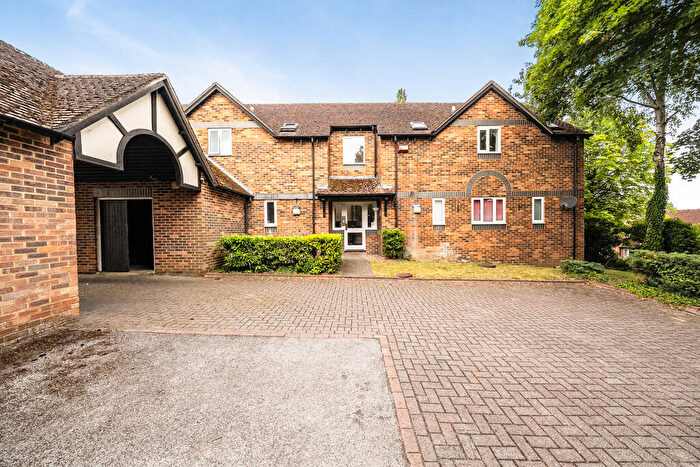
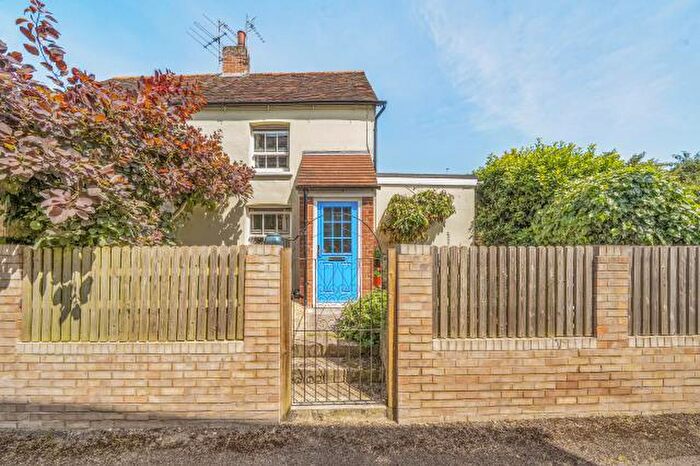
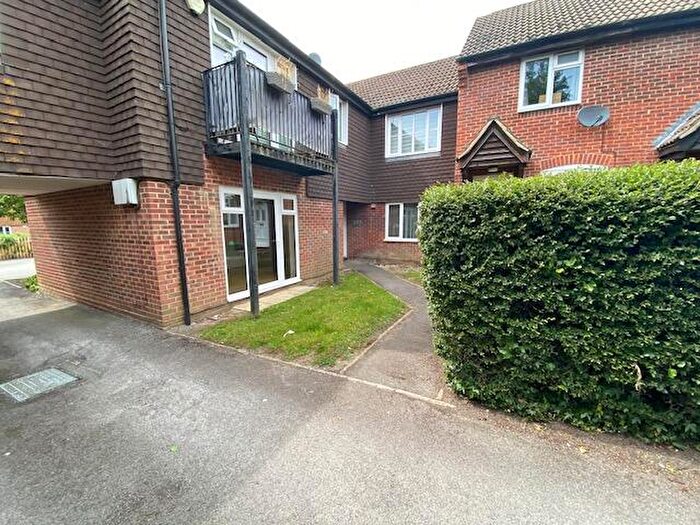
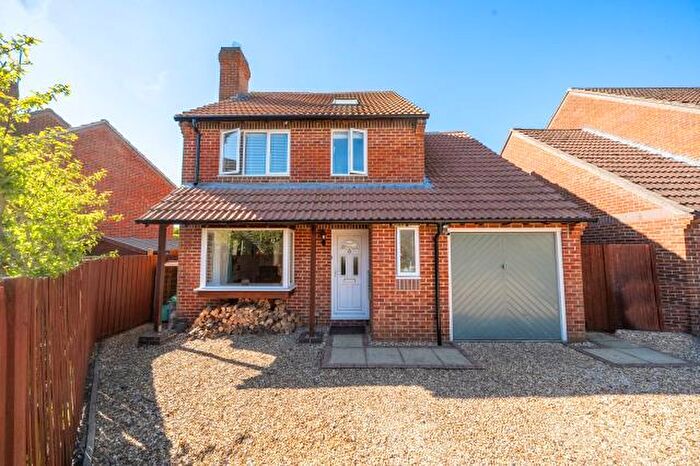
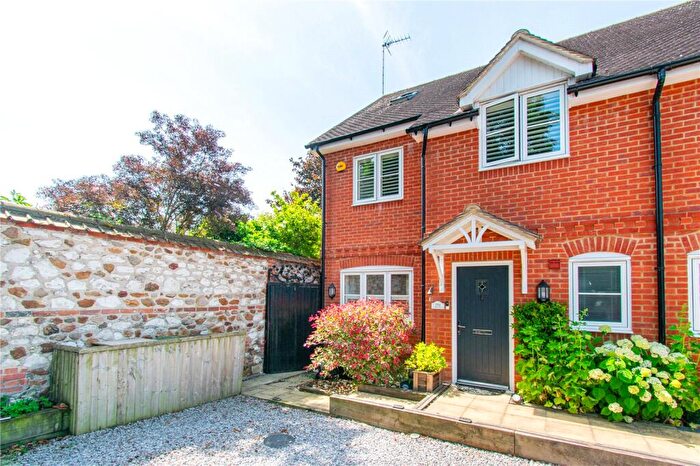
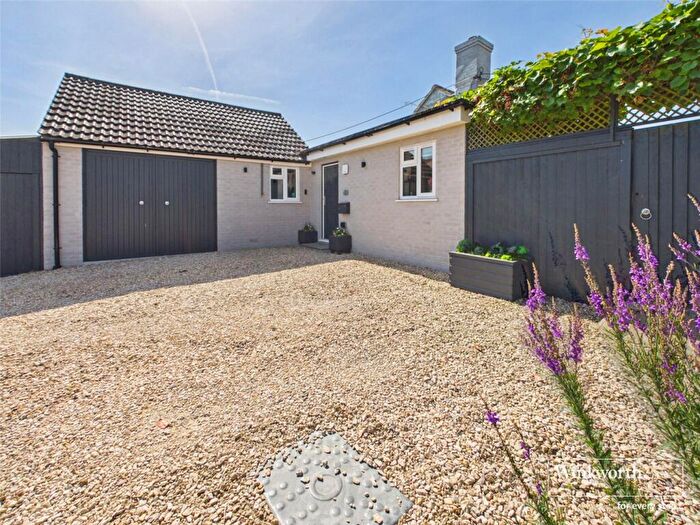
Houses and Flats for sale in RG17, Hungerford
There are 109 results. Property prices in RG17 range from £95k to £14.5M with an average price of £674k.
![]()
If you are looking to sell your house, let it out, or receive a property valuation, an expert can help you.
Click the button below to get started.

Frequently Asked Questions about RG17
What is the average price for a property for sale in RG17?
The average price for a property for sale in RG17 is £507,468. There are 109 property listings for sale in RG17.
Which areas are included in the RG17 postcode district?
The main area within RG17 is Hungerford.
What are the most common property types in RG17?
The most common property types in RG17 are Detached Houses, Semi Detached Houses, Terraced Houses and Flats.
What has been the average sold property price in RG17 over the last three years?
Detached Houses in RG17 have an average sold price of £810,890, while Semi Detached Houses have an average of £409,758. Terraced Houses have an average of £321,769 and Flats have an average of £309,188. The average sold property price in RG17 over the last three years is approximately £537,920.
Which train stations are available in RG17?
The train stations available in RG17 are Hungerford Station and Kintbury Station..