
Properties for sale in SM2
Belmont, South Sutton, East Ewell
- Info
- Price Paid By Year
- Property Type Price
- Transport
House Prices in SM2
Properties in SM2 have an average house price of £546,718.00 and had 1145 Property Transactions within the last 3 years.
The most expensive property was sold for £3,150,000.00.
Property Price Paid in SM2 by Year
The average sold property price by year was:
| Year | Average Sold Price | Sold Properties |
|---|---|---|
| 2026 | £524,375.00 | 4 Properties |
| 2025 | £525,543.00 | 330 Properties |
| 2024 | £559,217.00 | 426 Properties |
| 2023 | £551,269.00 | 385 Properties |
| 2022 | £543,360.00 | 512 Properties |
| 2021 | £544,861.00 | 581 Properties |
| 2020 | £509,155.00 | 379 Properties |
| 2019 | £494,246.00 | 432 Properties |
| 2018 | £474,741.00 | 383 Properties |
| 2017 | £461,584.00 | 450 Properties |
| 2016 | £475,803.00 | 507 Properties |
| 2015 | £406,426.00 | 591 Properties |
| 2014 | £366,349.00 | 572 Properties |
| 2013 | £342,739.00 | 522 Properties |
| 2012 | £310,672.00 | 446 Properties |
| 2011 | £336,166.00 | 439 Properties |
| 2010 | £318,280.00 | 410 Properties |
| 2009 | £297,984.00 | 410 Properties |
| 2008 | £313,463.00 | 410 Properties |
| 2007 | £305,926.00 | 861 Properties |
| 2006 | £284,095.00 | 787 Properties |
| 2005 | £267,018.00 | 659 Properties |
| 2004 | £248,354.00 | 792 Properties |
| 2003 | £219,791.00 | 705 Properties |
| 2002 | £208,964.00 | 840 Properties |
| 2001 | £175,250.00 | 907 Properties |
| 2000 | £153,979.00 | 850 Properties |
| 1999 | £128,978.00 | 898 Properties |
| 1998 | £108,793.00 | 881 Properties |
| 1997 | £100,185.00 | 902 Properties |
| 1996 | £95,294.00 | 807 Properties |
| 1995 | £92,994.00 | 771 Properties |
Property Price per Property Type in SM2
Here you can find historic sold price data in order to help with your property search.
The average Property Paid Price for specific property types in the last three years are:
| Property Type | Average Sold Price | Sold Properties |
|---|---|---|
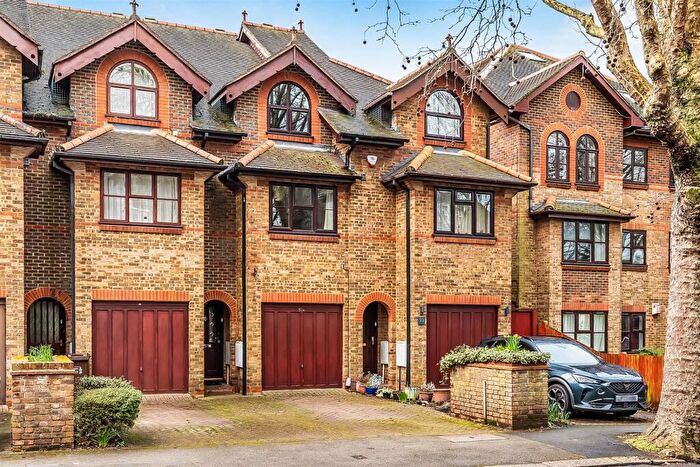
| Semi Detached House | £730,568.00 | 117 Semi Detached Houses |
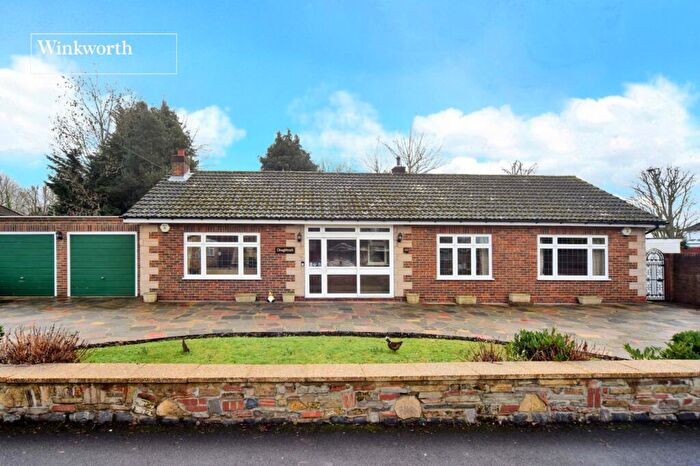
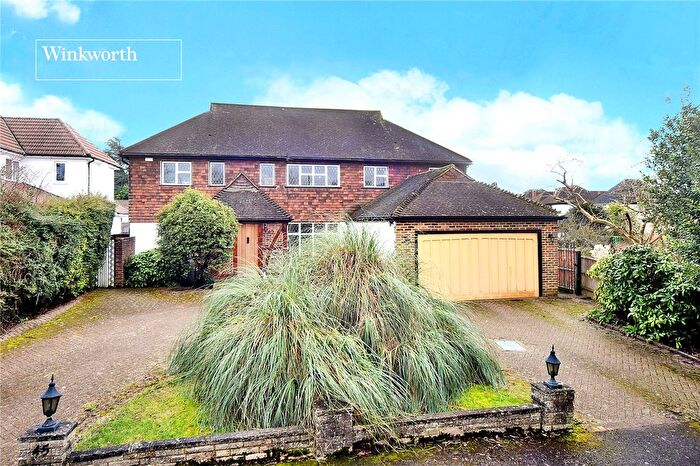
| Detached House | £1,136,637.00 | 245 Detached Houses |
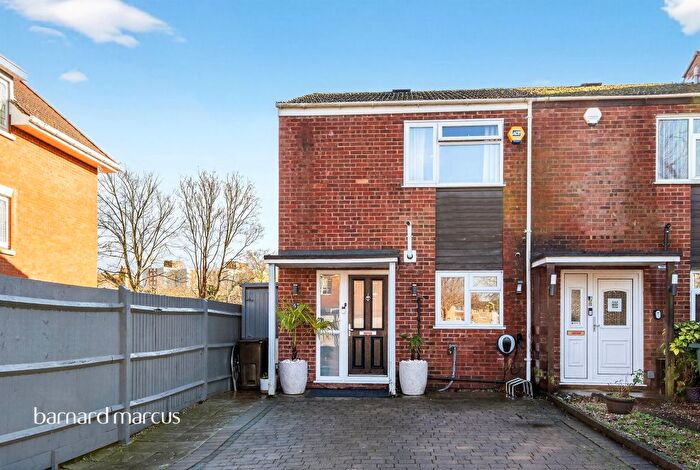
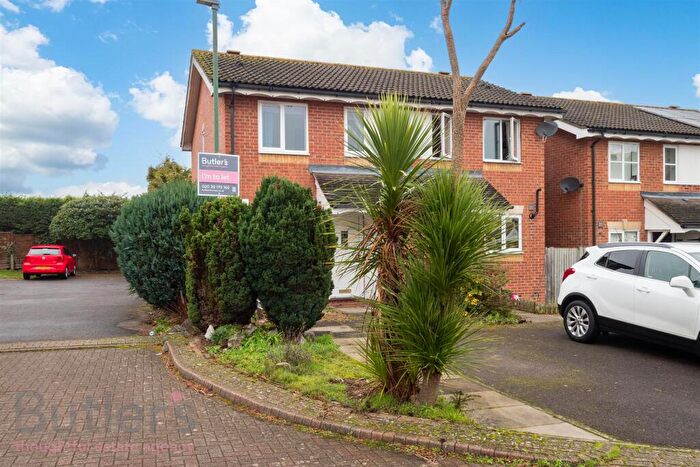
| Terraced House | £529,326.00 | 128 Terraced Houses |
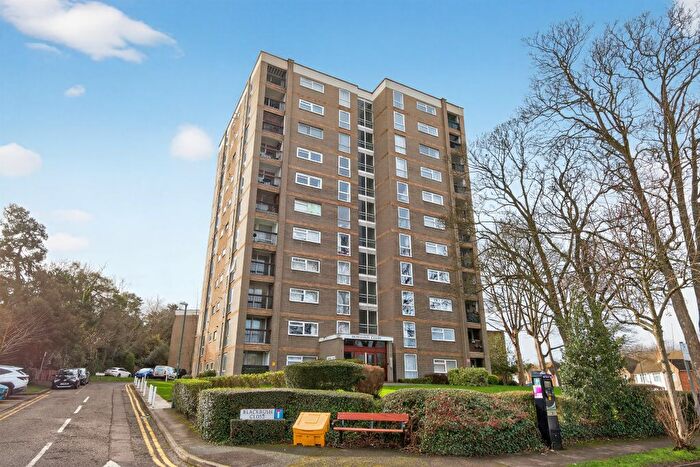
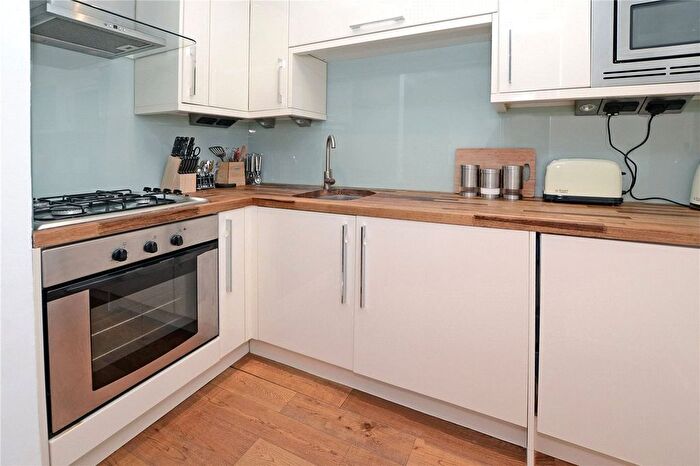
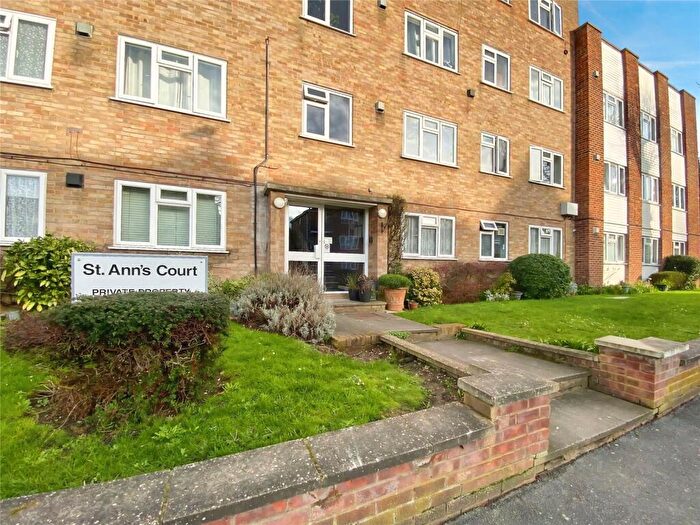
| Flat | £296,619.00 | 655 Flats |

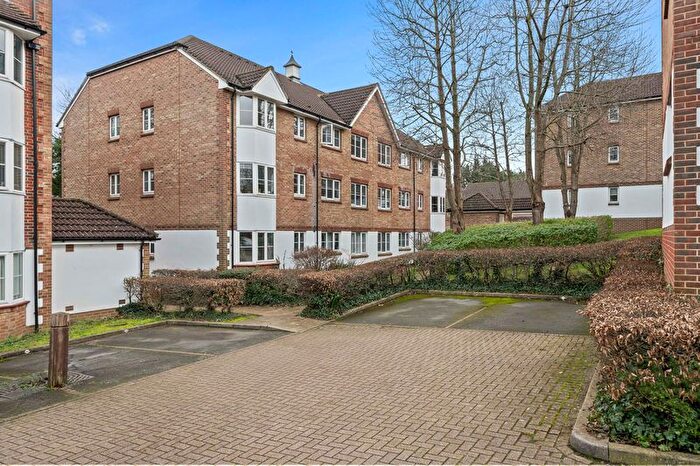
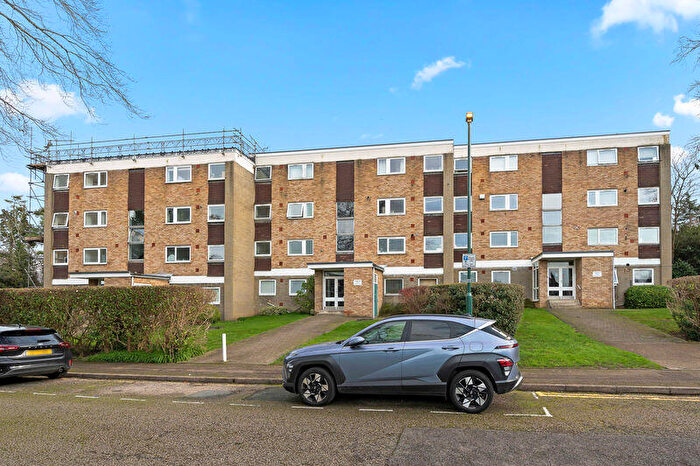
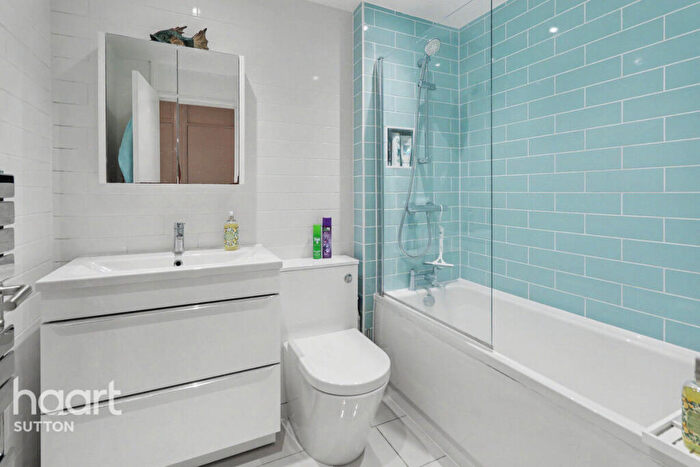
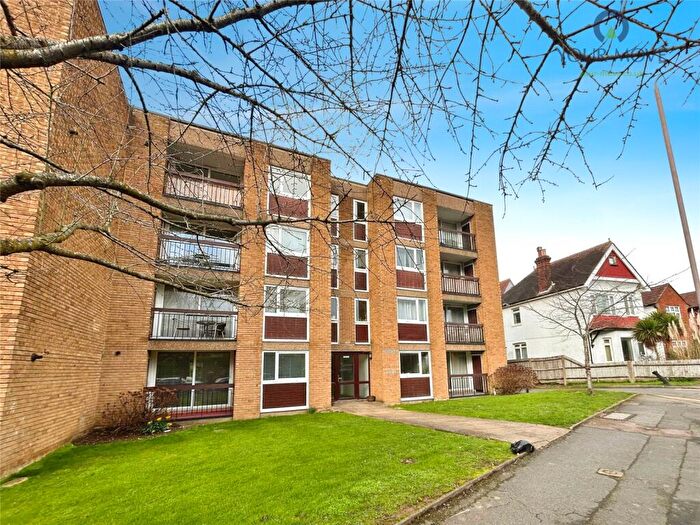
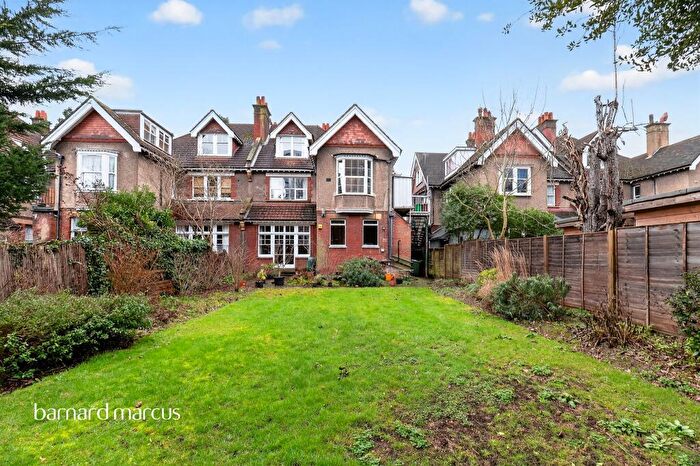
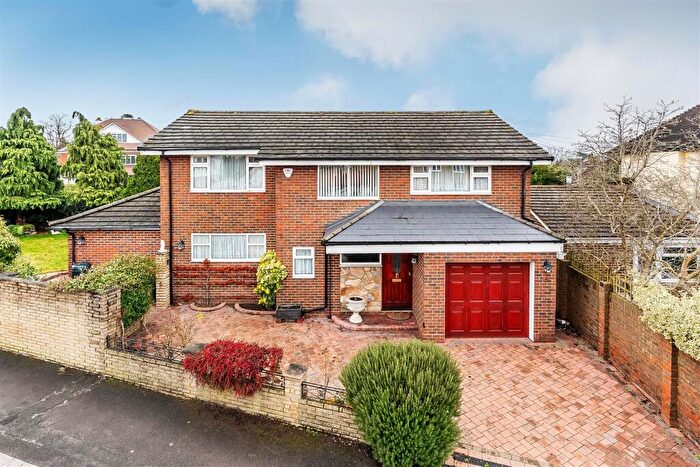
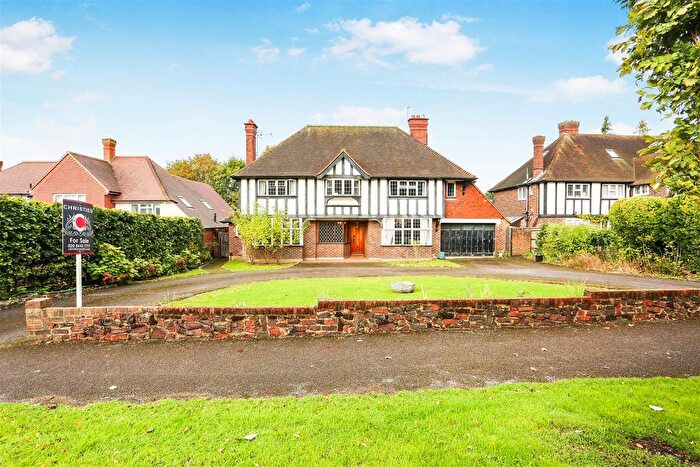
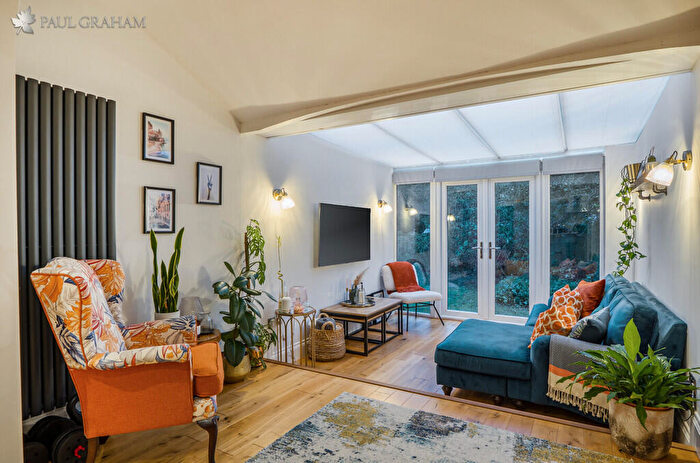
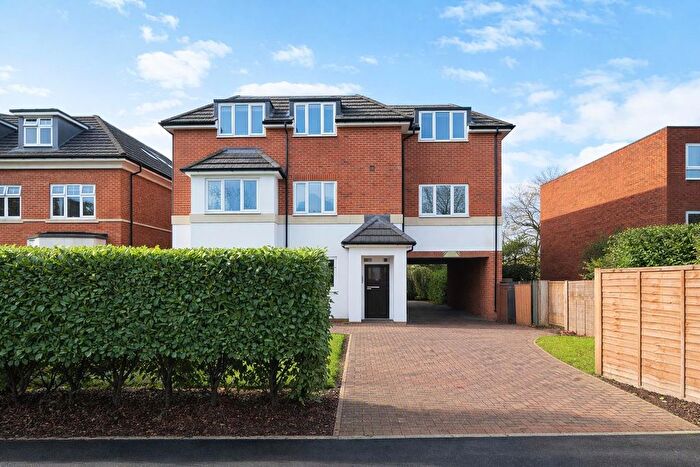
Houses and Flats for sale in SM2, Belmont, South Sutton, East Ewell
![]()
If you are looking to sell your house, let it out, or receive a property valuation, an expert can help you.
Click the button below to get started.


Frequently Asked Questions about SM2
What is the average price for a property for sale in SM2?
The average price for a property for sale in SM2 is £546,718. There are 208 property listings for sale in SM2.
Which areas are included in the SM2 postcode district?
The main areas within SM2 include Belmont, South Sutton and East Ewell.
What are the most common property types in SM2?
The most common property types in SM2 are Flats, Detached Houses, Terraced Houses and Semi Detached Houses.
What has been the average sold property price in SM2 over the last three years?
Flats in SM2 have an average sold price of £296,619, while Detached Houses have an average of £1,136,637. Terraced Houses have an average of £529,326 and Semi Detached Houses have an average of £730,568. The average sold property price in SM2 over the last three years is approximately £536,378.
Which train stations are available in SM2?
The train stations available in SM2 are Belmont Station and Cheam Station..
Which tube stations are available in SM2?
The tube stations available in SM2 are Belmont Station and Cheam Station.