
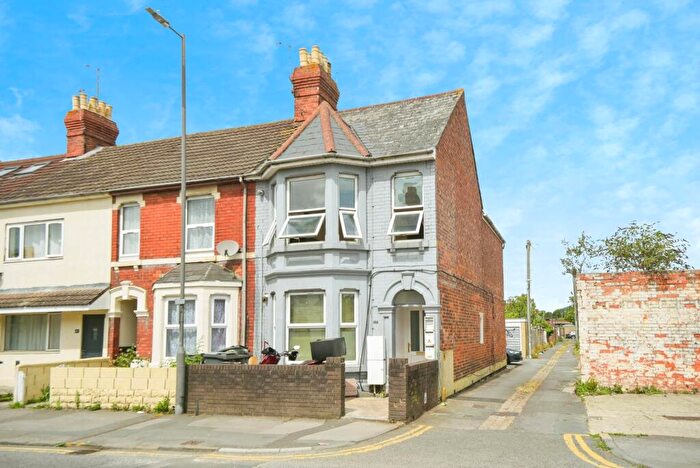
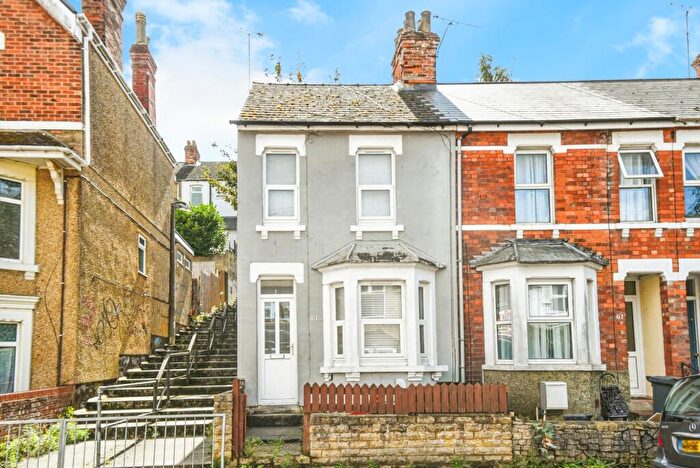
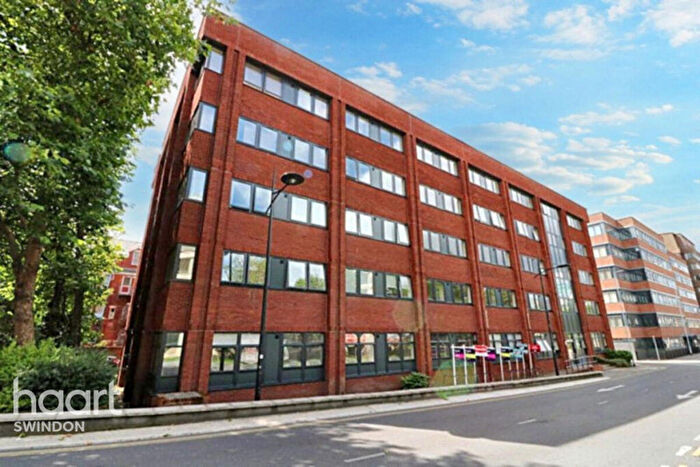
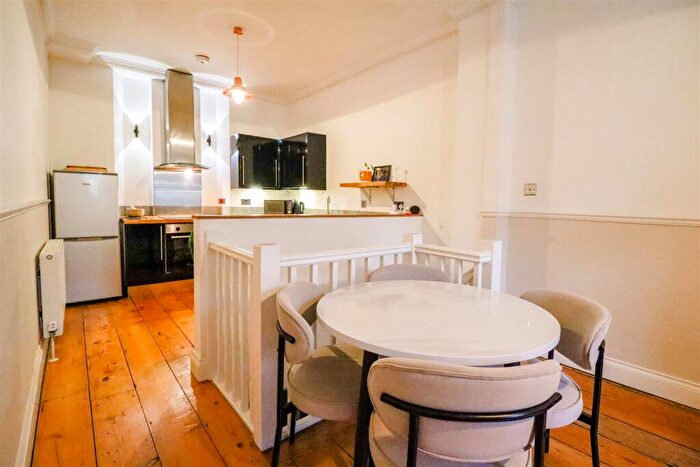
Properties for sale in SN1
Swindon Centre
- Info
- Price Paid By Year
- Property Type Price
- Transport
House Prices in SN1
Properties in SN1 have an average house price of £240,914.00 and had 1509 Property Transactions within the last 3 years.
The most expensive property was sold for £1,587,500.00.
Property Price Paid in SN1 by Year
The average sold property price by year was:
| Year | Average Sold Price | Sold Properties |
|---|---|---|
| 2025 | £244,105.00 | 395 Properties |
| 2024 | £246,535.00 | 535 Properties |
| 2023 | £233,543.00 | 579 Properties |
| 2022 | £230,353.00 | 657 Properties |
| 2021 | £221,344.00 | 746 Properties |
| 2020 | £214,633.00 | 504 Properties |
| 2019 | £203,609.00 | 620 Properties |
| 2018 | £208,871.00 | 690 Properties |
| 2017 | £202,240.00 | 765 Properties |
| 2016 | £182,578.00 | 928 Properties |
| 2015 | £175,645.00 | 812 Properties |
| 2014 | £166,890.00 | 791 Properties |
| 2013 | £167,149.00 | 659 Properties |
| 2012 | £153,970.00 | 513 Properties |
| 2011 | £153,828.00 | 526 Properties |
| 2010 | £156,513.00 | 535 Properties |
| 2009 | £154,471.00 | 510 Properties |
| 2008 | £159,134.00 | 561 Properties |
| 2007 | £168,008.00 | 1,268 Properties |
| 2006 | £156,431.00 | 1,041 Properties |
| 2005 | £147,556.00 | 793 Properties |
| 2004 | £138,188.00 | 858 Properties |
| 2003 | £132,491.00 | 879 Properties |
| 2002 | £127,224.00 | 889 Properties |
| 2001 | £107,231.00 | 935 Properties |
| 2000 | £91,998.00 | 767 Properties |
| 1999 | £71,203.00 | 916 Properties |
| 1998 | £65,485.00 | 807 Properties |
| 1997 | £58,046.00 | 805 Properties |
| 1996 | £52,701.00 | 675 Properties |
| 1995 | £50,243.00 | 575 Properties |
Property Price per Property Type in SN1
Here you can find historic sold price data in order to help with your property search.
The average Property Paid Price for specific property types in the last three years are:
| Property Type | Average Sold Price | Sold Properties |
|---|---|---|
| Semi Detached House | £307,544.00 | 228 Semi Detached Houses |
| Detached House | £463,058.00 | 95 Detached Houses |
| Terraced House | £241,568.00 | 801 Terraced Houses |
| Flat | £145,278.00 | 385 Flats |
Transport near SN1

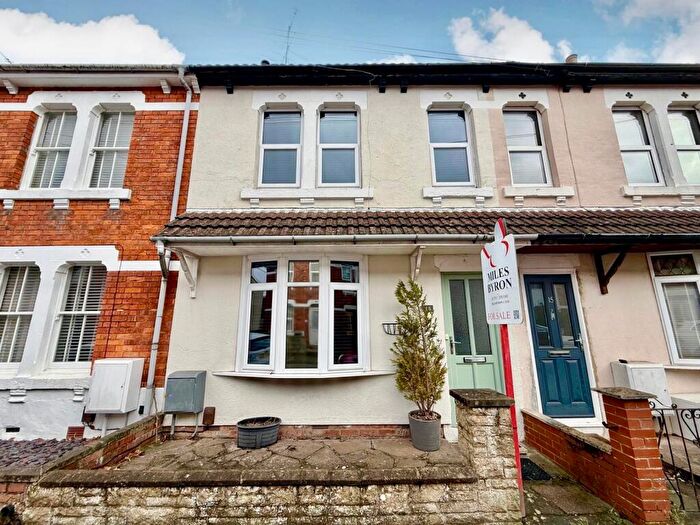
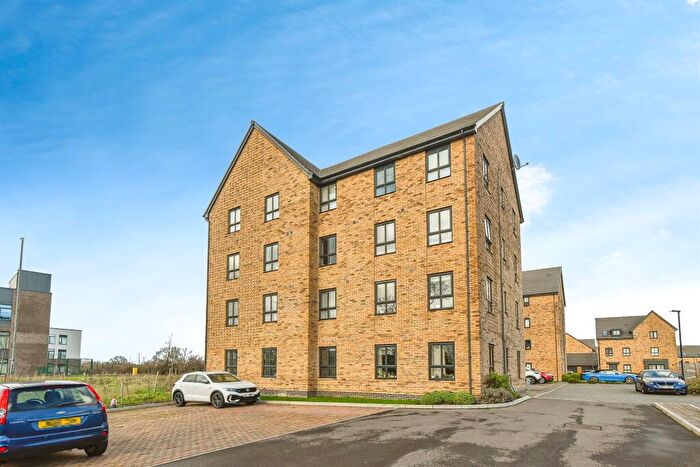
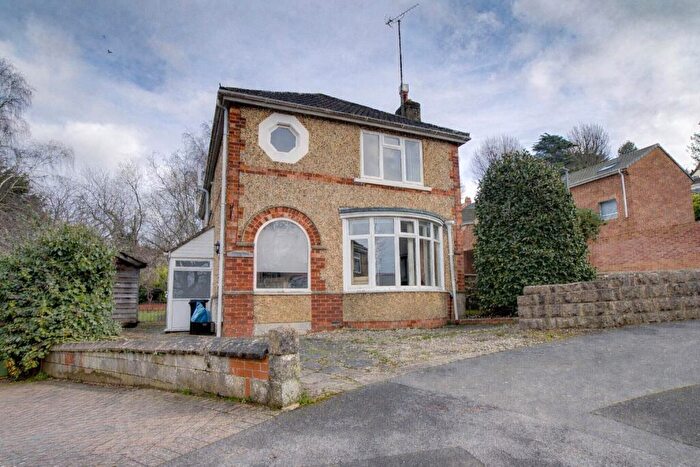
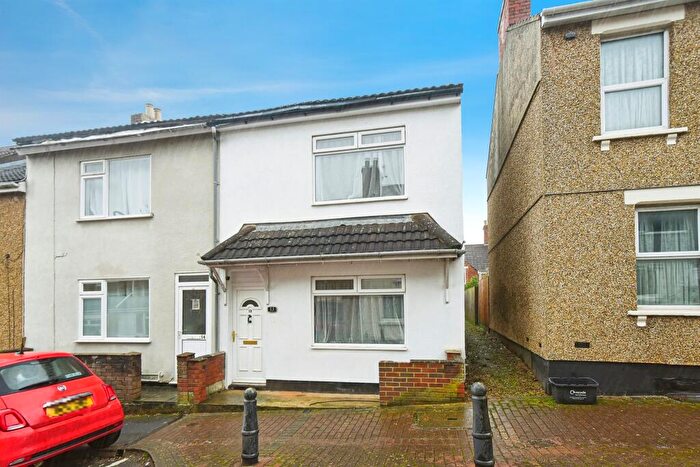
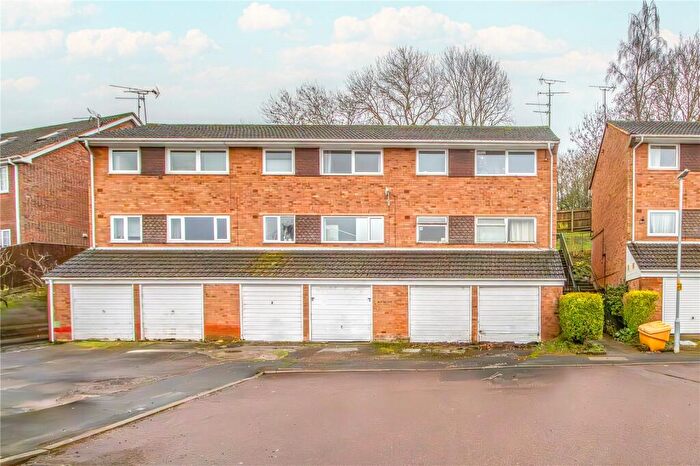
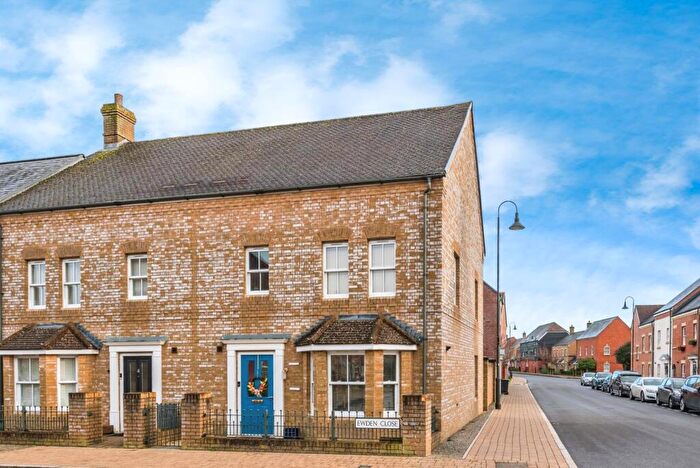
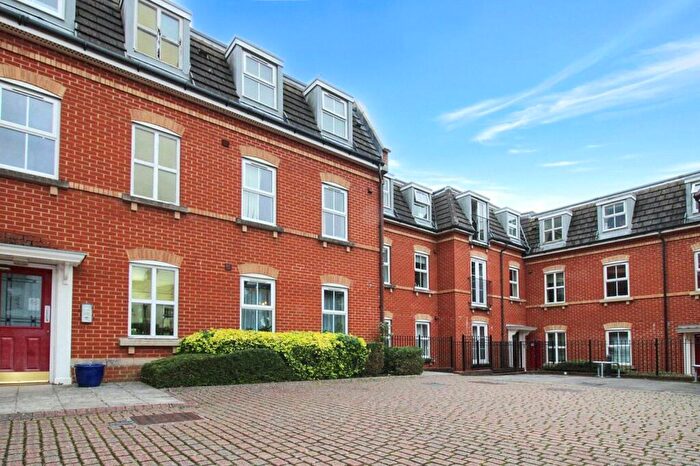
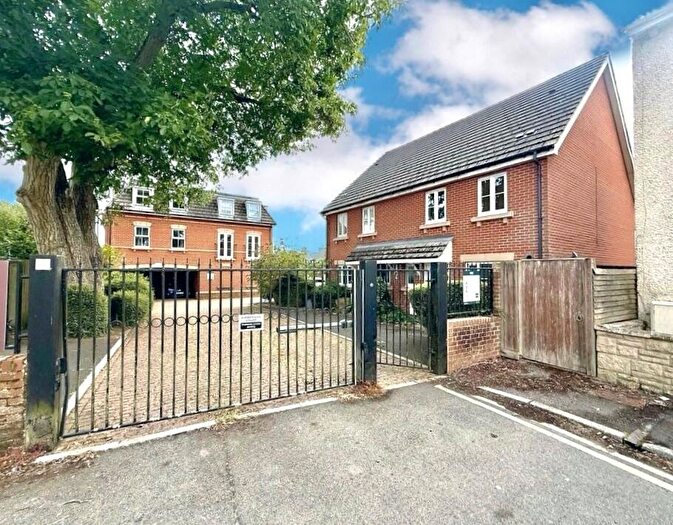
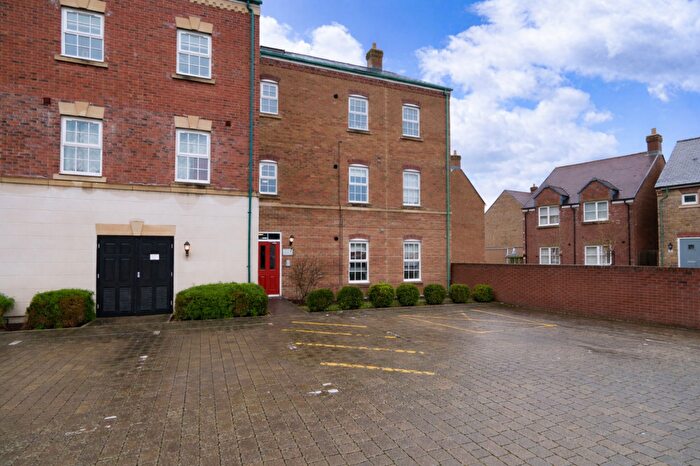
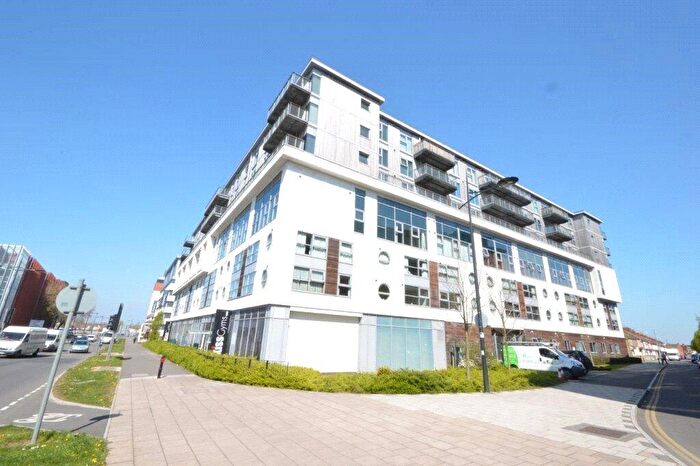
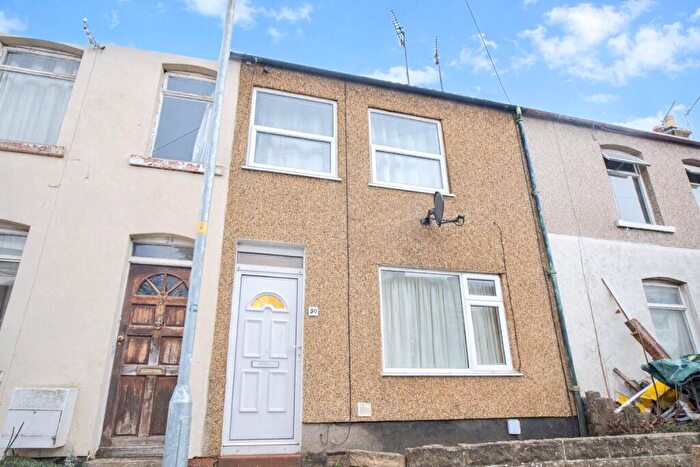
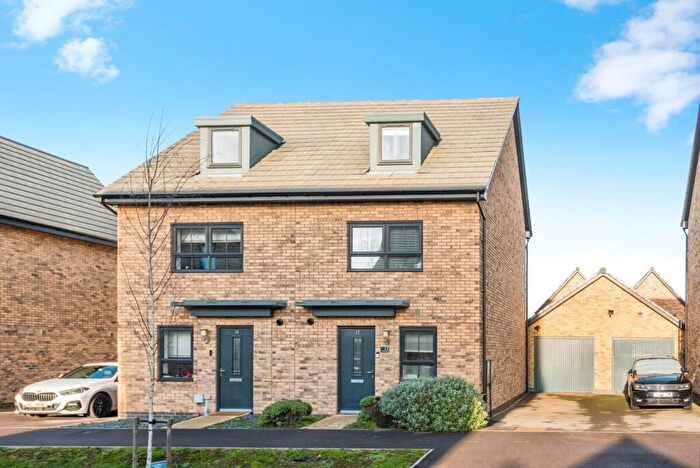
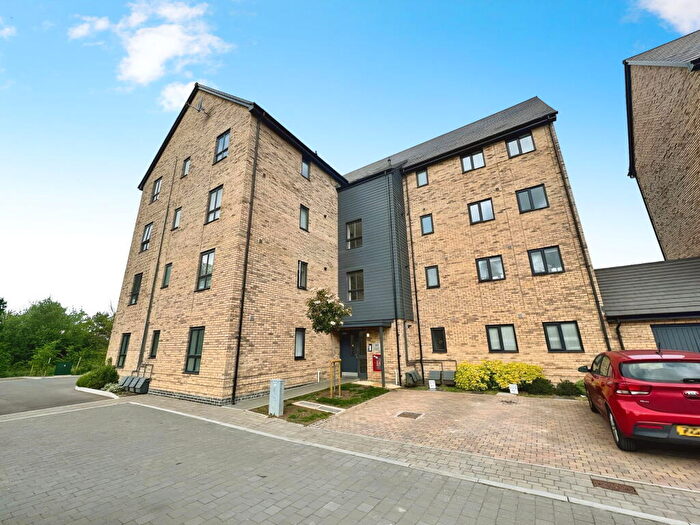
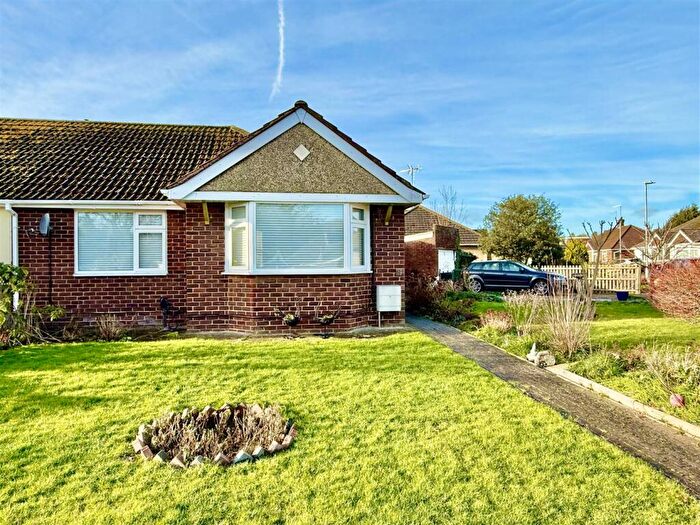
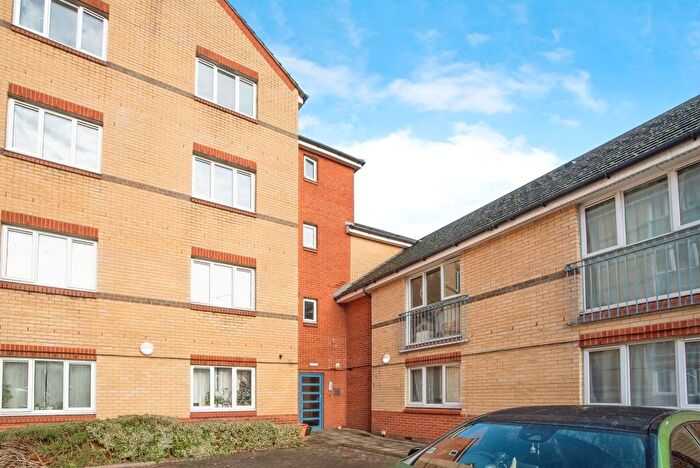
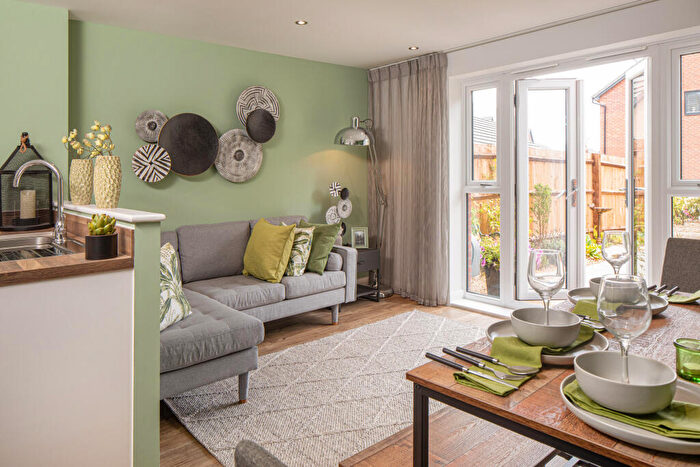
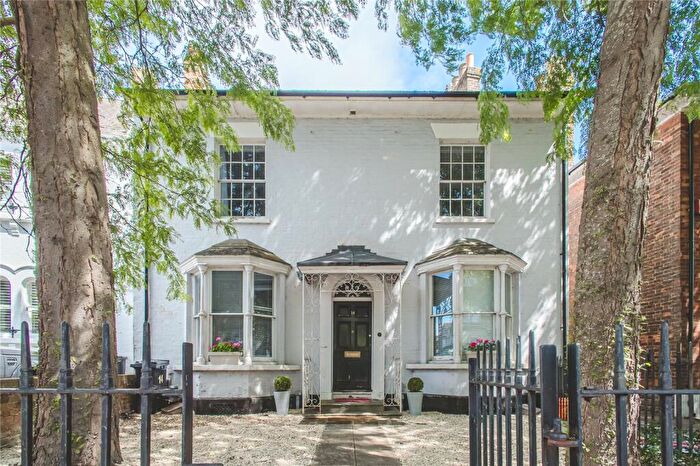
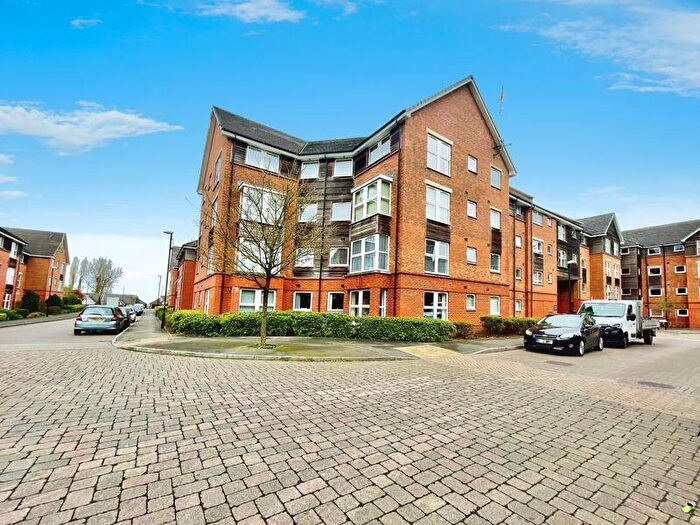
Houses and Flats for sale in SN1, Swindon Centre

![]()
If you are looking to sell your house, let it out, or receive a property valuation, an expert can help you.
Click the button below to get started.
Frequently Asked Questions about SN1
What is the average price for a property for sale in SN1?
The average price for a property for sale in SN1 is £240,914. There are 250 property listings for sale in SN1.
Which areas are included in the SN1 postcode district?
The main area within SN1 is Swindon Centre.
What are the most common property types in SN1?
The most common property types in SN1 are Terraced Houses, Flats, Semi Detached Houses and Detached Houses.
What has been the average sold property price in SN1 over the last three years?
Terraced Houses in SN1 have an average sold price of £241,568, while Flats have an average of £145,278. Semi Detached Houses have an average of £307,544 and Detached Houses have an average of £463,058. The average sold property price in SN1 over the last three years is approximately £241,394.
Which train stations are available in SN1?
The train stations available in SN1 are Chippenham Station, Melksham Station and Swindon Station..