
Properties for sale in SN2
Swindon
- Info
- Price Paid By Year
- Property Type Price
- Transport
House Prices in SN2
Properties in SN2 have an average house price of £238,782.00 and had 1714 Property Transactions within the last 3 years.
The most expensive property was sold for £700,000.00.
Property Price Paid in SN2 by Year
The average sold property price by year was:
| Year | Average Sold Price | Sold Properties |
|---|---|---|
| 2026 | £247,483.00 | 30 Properties |
| 2025 | £246,536.00 | 546 Properties |
| 2024 | £232,002.00 | 554 Properties |
| 2023 | £237,518.00 | 584 Properties |
| 2022 | £230,646.00 | 675 Properties |
| 2021 | £204,962.00 | 824 Properties |
| 2020 | £195,374.00 | 480 Properties |
| 2019 | £193,656.00 | 636 Properties |
| 2018 | £190,664.00 | 751 Properties |
| 2017 | £188,454.00 | 905 Properties |
| 2016 | £178,270.00 | 853 Properties |
| 2015 | £155,844.00 | 852 Properties |
| 2014 | £143,719.00 | 780 Properties |
| 2013 | £140,914.00 | 676 Properties |
| 2012 | £137,224.00 | 493 Properties |
| 2011 | £125,070.00 | 472 Properties |
| 2010 | £131,603.00 | 388 Properties |
| 2009 | £121,390.00 | 437 Properties |
| 2008 | £139,293.00 | 457 Properties |
| 2007 | £142,251.00 | 953 Properties |
| 2006 | £138,583.00 | 1,191 Properties |
| 2005 | £132,824.00 | 915 Properties |
| 2004 | £129,020.00 | 1,066 Properties |
| 2003 | £120,047.00 | 946 Properties |
| 2002 | £103,333.00 | 1,111 Properties |
| 2001 | £88,925.00 | 915 Properties |
| 2000 | £77,197.00 | 868 Properties |
| 1999 | £67,564.00 | 967 Properties |
| 1998 | £57,395.00 | 937 Properties |
| 1997 | £52,910.00 | 910 Properties |
| 1996 | £48,931.00 | 860 Properties |
| 1995 | £47,781.00 | 751 Properties |
Property Price per Property Type in SN2
Here you can find historic sold price data in order to help with your property search.
The average Property Paid Price for specific property types in the last three years are:
| Property Type | Average Sold Price | Sold Properties |
|---|---|---|
| Semi Detached House | £268,385.00 | 517 Semi Detached Houses |
| Detached House | £349,129.00 | 154 Detached Houses |
| Terraced House | £224,771.00 | 818 Terraced Houses |
| Flat | £146,171.00 | 225 Flats |

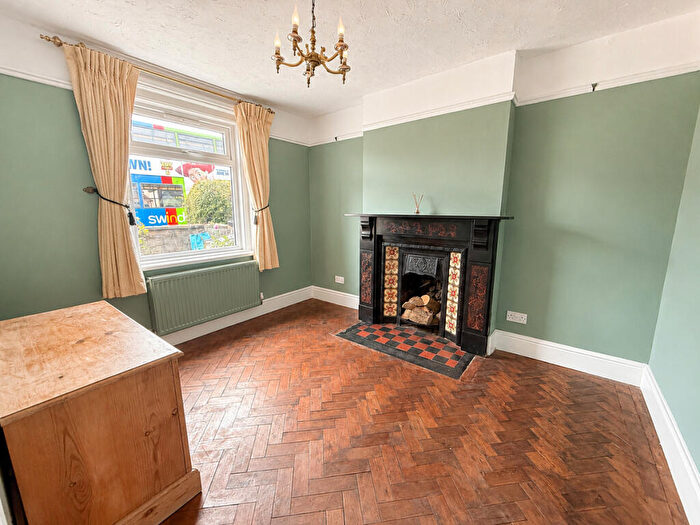
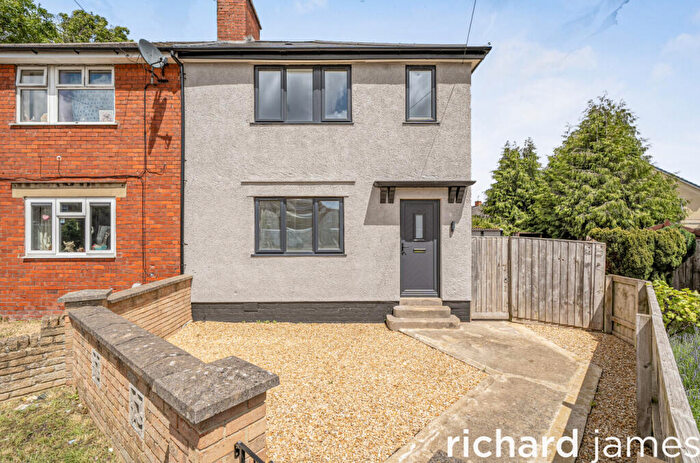
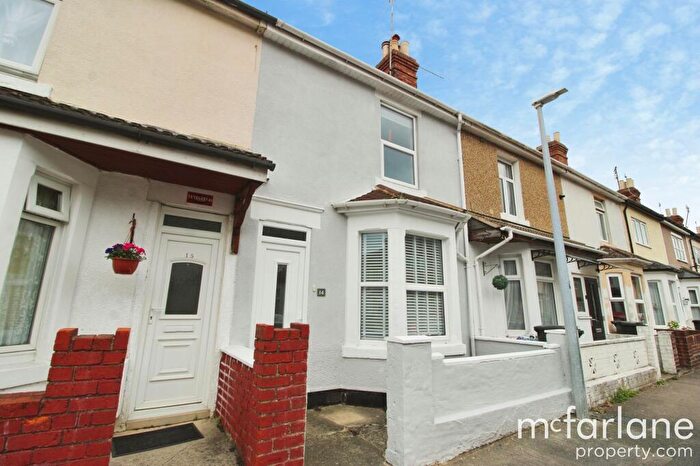
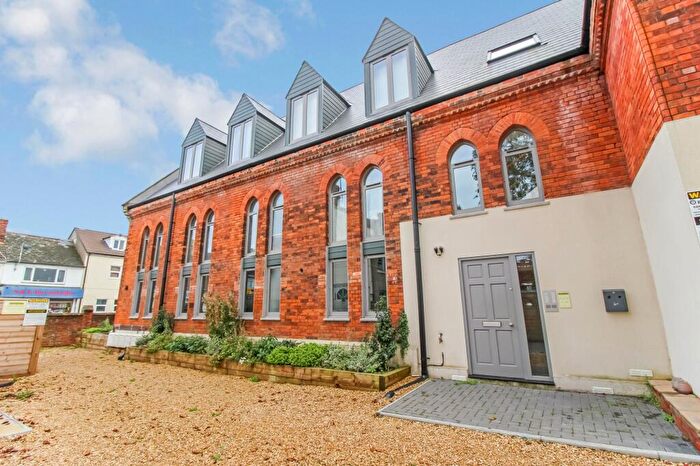
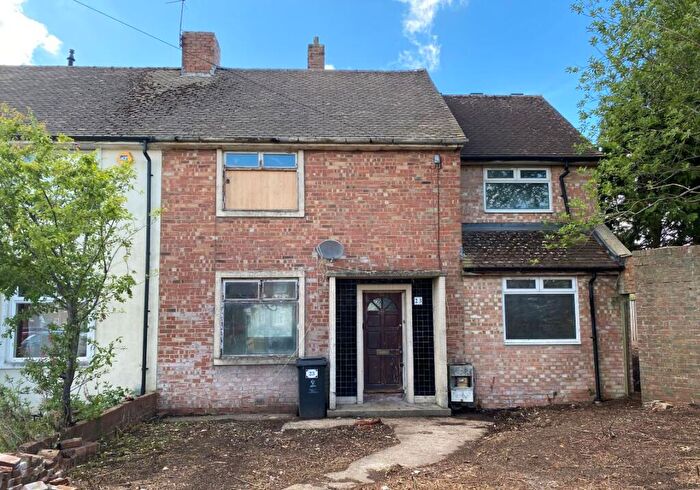
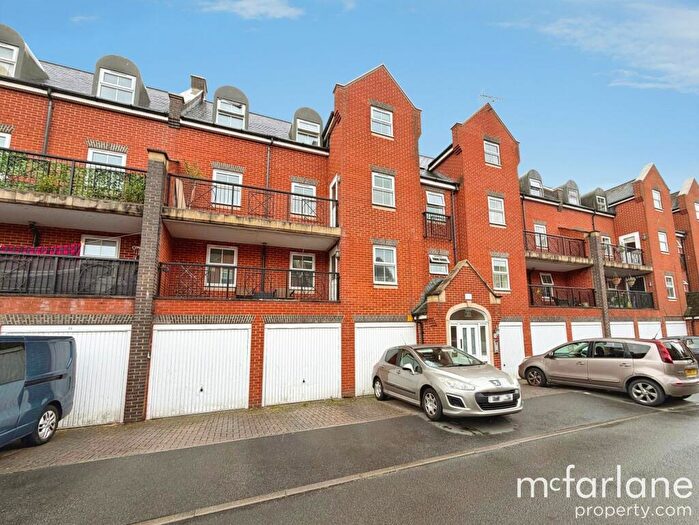
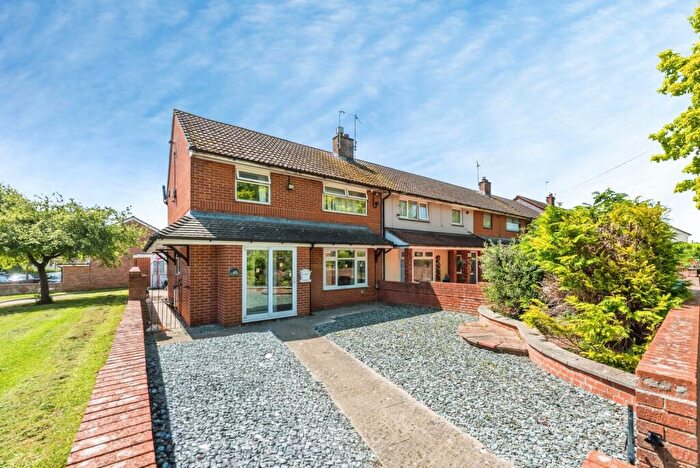
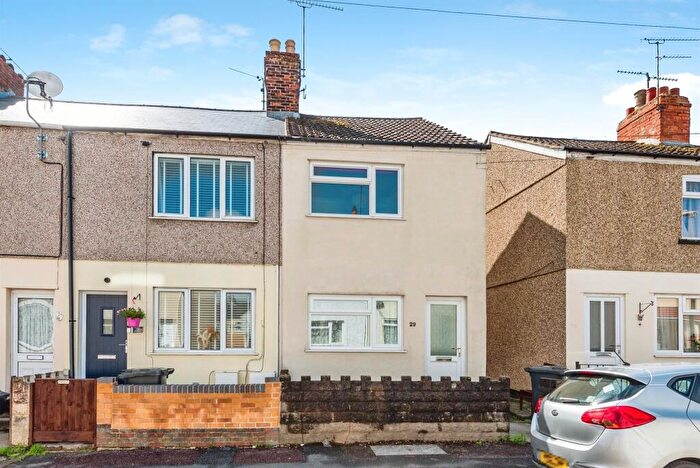
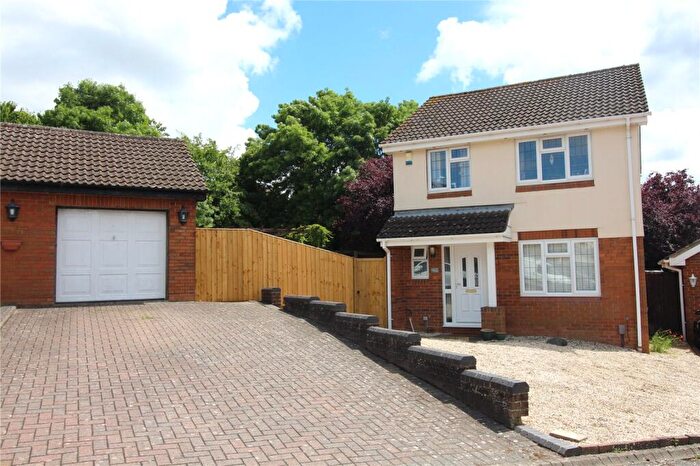
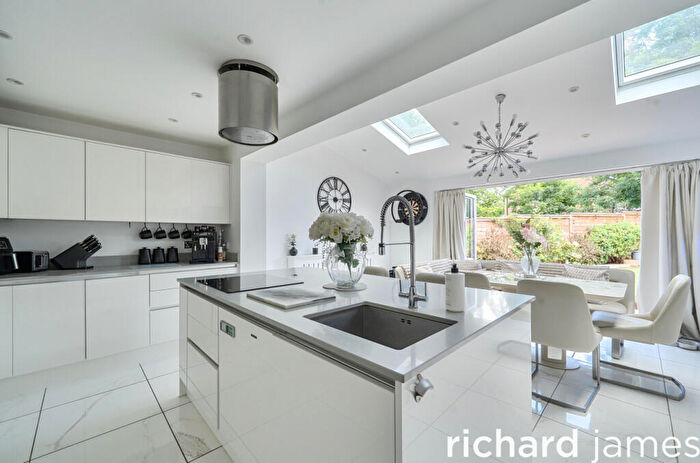
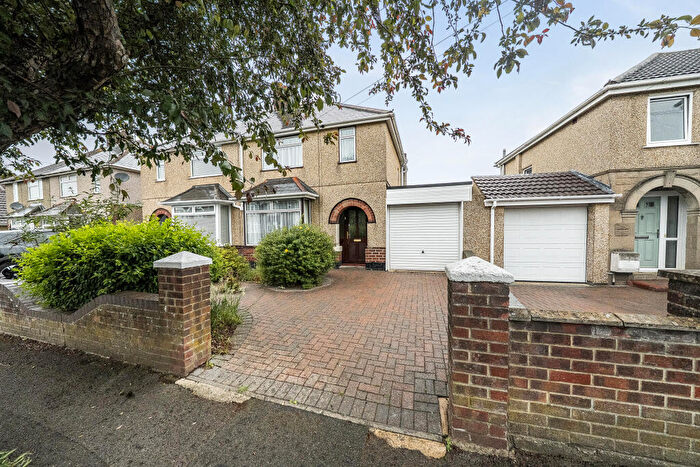
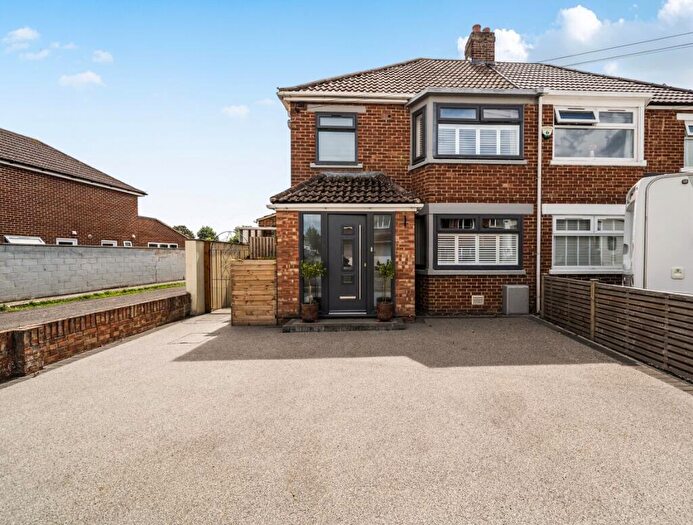
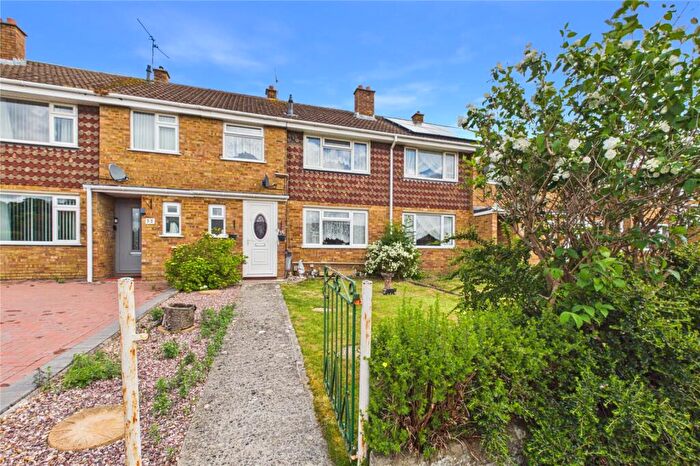
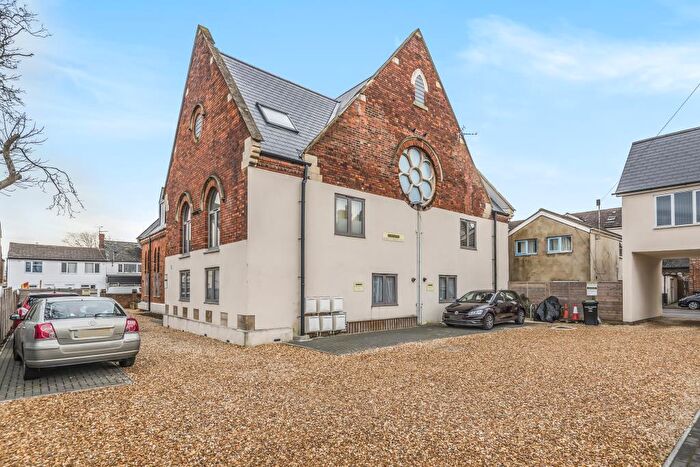
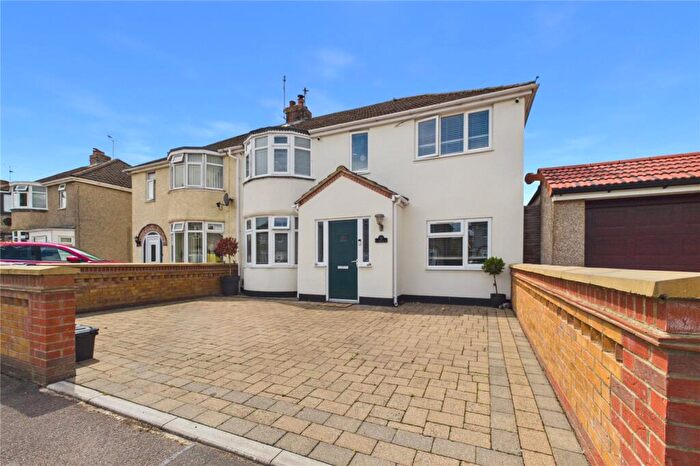
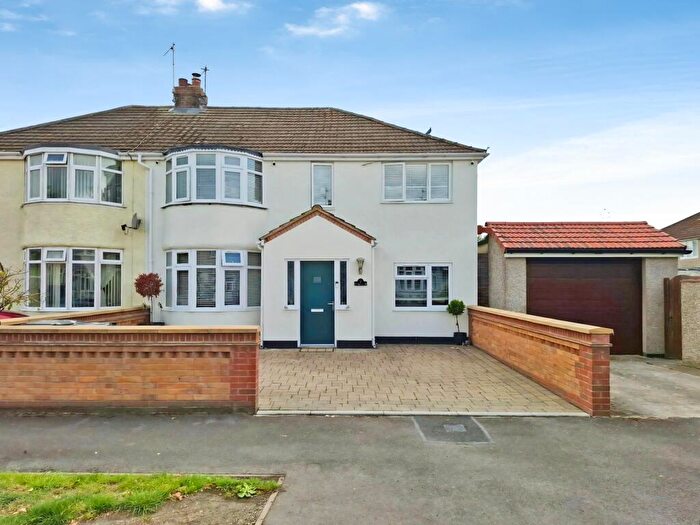
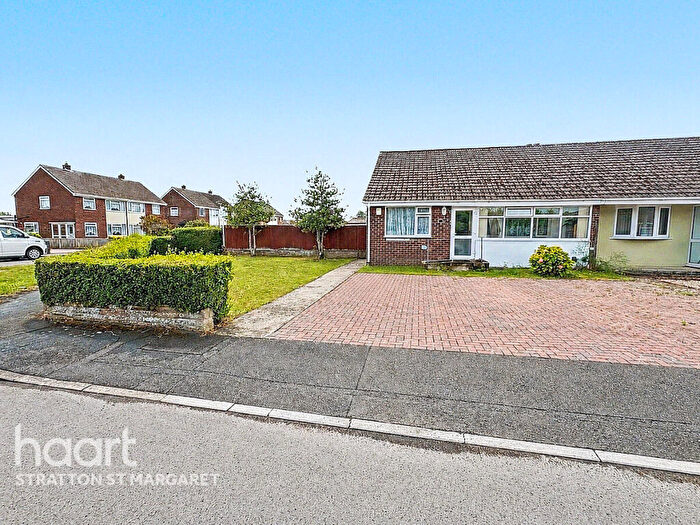
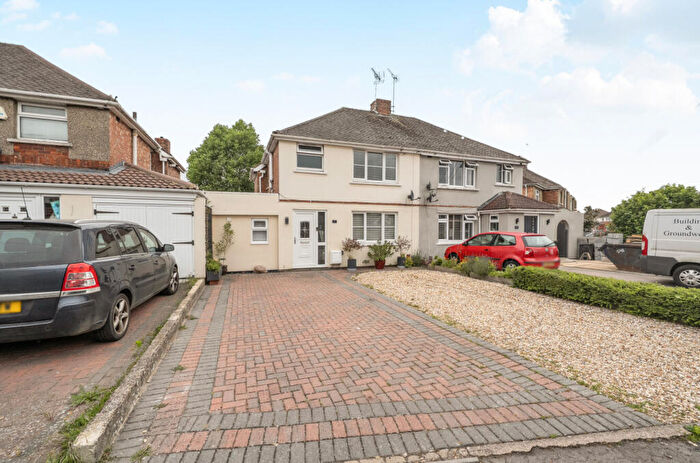
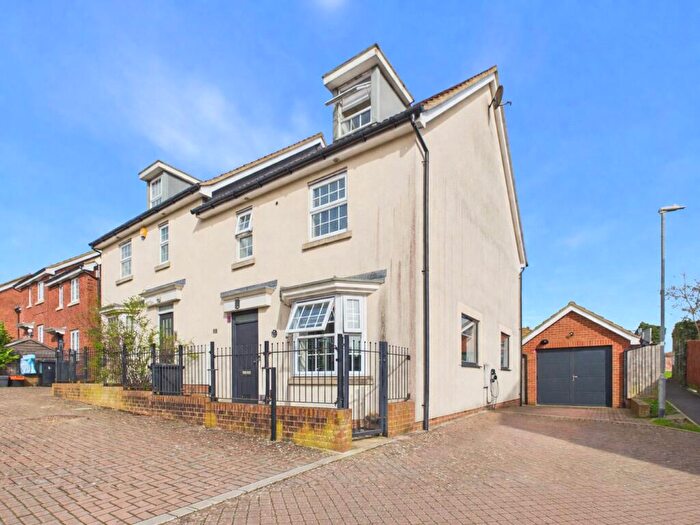
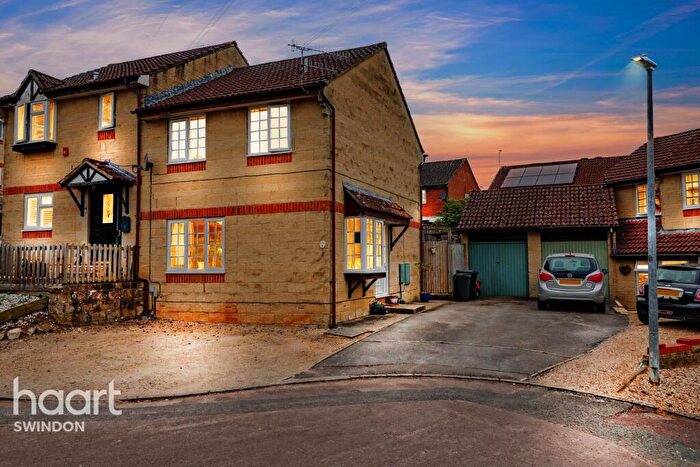
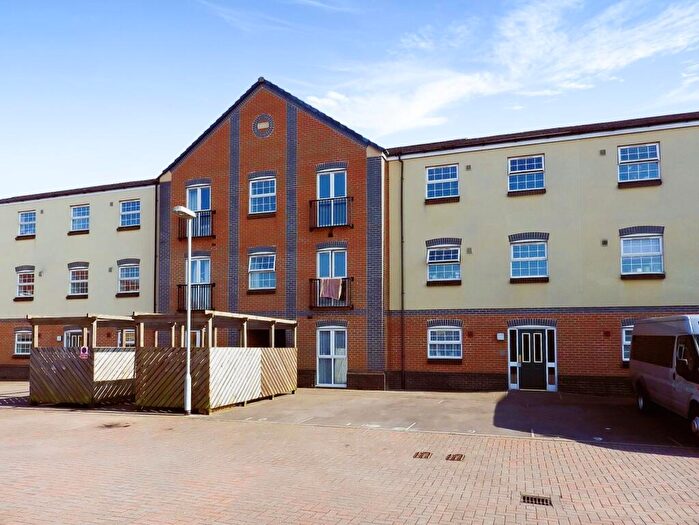
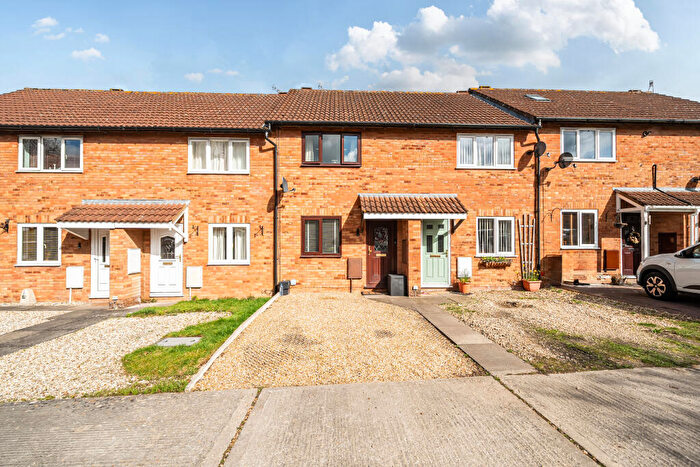
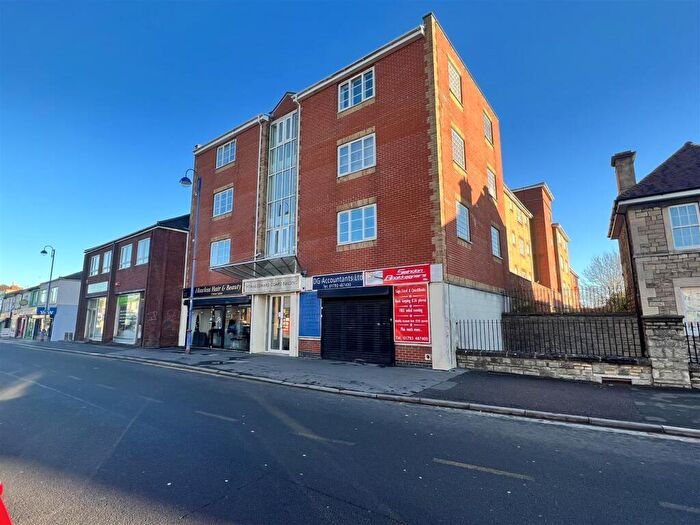
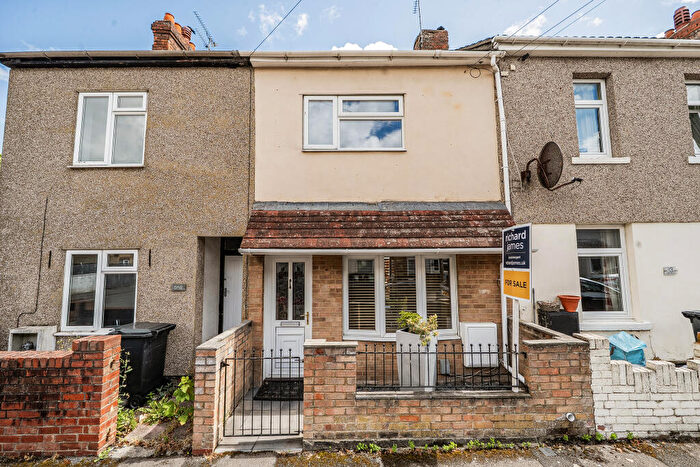
Houses and Flats for sale in SN2, Swindon
![]()
If you are looking to sell your house, let it out, or receive a property valuation, an expert can help you.
Click the button below to get started.
Frequently Asked Questions about SN2
What is the average price for a property for sale in SN2?
The average price for a property for sale in SN2 is £238,782. There are 138 property listings for sale in SN2.
Which areas are included in the SN2 postcode district?
The main area within SN2 is Swindon.
What are the most common property types in SN2?
The most common property types in SN2 are Terraced Houses, Semi Detached Houses, Flats and Detached Houses.
What has been the average sold property price in SN2 over the last three years?
Terraced Houses in SN2 have an average sold price of £224,771, while Semi Detached Houses have an average of £268,385. Flats have an average of £146,171 and Detached Houses have an average of £349,129. The average sold property price in SN2 over the last three years is approximately £242,007.