
Properties for sale in SN5
West Swindon
- Info
- Price Paid By Year
- Property Type Price
- Transport
House Prices in SN5
Properties in SN5 have an average house price of £298,919.00 and had 1517 Property Transactions within the last 3 years.
The most expensive property was sold for £1,465,000.00.
Property Price Paid in SN5 by Year
The average sold property price by year was:
| Year | Average Sold Price | Sold Properties |
|---|---|---|
| 2026 | £307,060.00 | 33 Properties |
| 2025 | £301,099.00 | 493 Properties |
| 2024 | £296,942.00 | 527 Properties |
| 2023 | £298,268.00 | 464 Properties |
| 2022 | £295,059.00 | 543 Properties |
| 2021 | £277,544.00 | 671 Properties |
| 2020 | £233,182.00 | 537 Properties |
| 2019 | £247,620.00 | 632 Properties |
| 2018 | £252,810.00 | 708 Properties |
| 2017 | £252,836.00 | 722 Properties |
| 2016 | £223,543.00 | 752 Properties |
| 2015 | £213,389.00 | 725 Properties |
| 2014 | £196,121.00 | 666 Properties |
| 2013 | £176,670.00 | 553 Properties |
| 2012 | £174,860.00 | 397 Properties |
| 2011 | £181,155.00 | 423 Properties |
| 2010 | £179,686.00 | 394 Properties |
| 2009 | £169,330.00 | 373 Properties |
| 2008 | £158,329.00 | 385 Properties |
| 2007 | £173,242.00 | 841 Properties |
| 2006 | £159,516.00 | 924 Properties |
| 2005 | £152,679.00 | 805 Properties |
| 2004 | £146,524.00 | 939 Properties |
| 2003 | £137,494.00 | 815 Properties |
| 2002 | £126,319.00 | 1,069 Properties |
| 2001 | £108,267.00 | 1,000 Properties |
| 2000 | £93,366.00 | 941 Properties |
| 1999 | £79,721.00 | 1,293 Properties |
| 1998 | £72,239.00 | 1,139 Properties |
| 1997 | £67,302.00 | 1,255 Properties |
| 1996 | £63,867.00 | 1,081 Properties |
| 1995 | £64,428.00 | 821 Properties |
Property Price per Property Type in SN5
Here you can find historic sold price data in order to help with your property search.
The average Property Paid Price for specific property types in the last three years are:
| Property Type | Average Sold Price | Sold Properties |
|---|---|---|
| Semi Detached House | £274,035.00 | 373 Semi Detached Houses |
| Detached House | £419,011.00 | 522 Detached Houses |
| Terraced House | £227,162.00 | 516 Terraced Houses |
| Flat | £144,393.00 | 106 Flats |
Transport near SN5

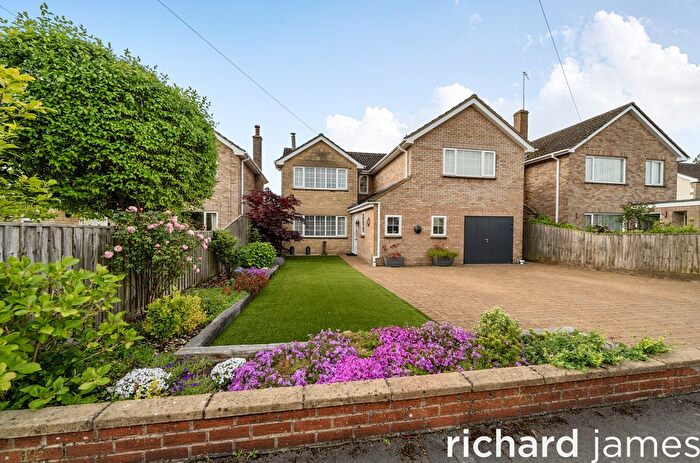
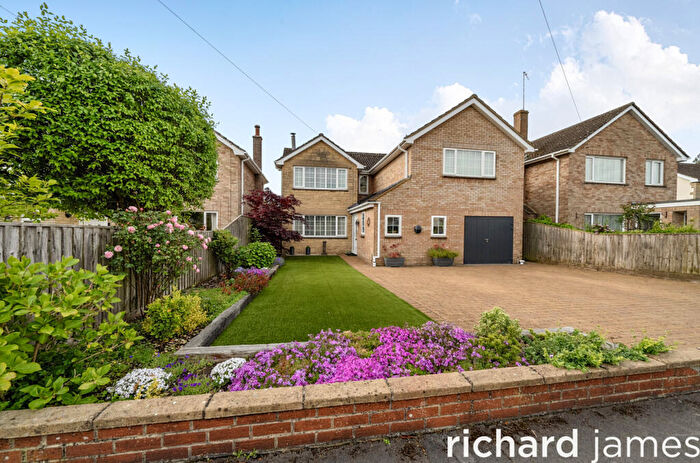
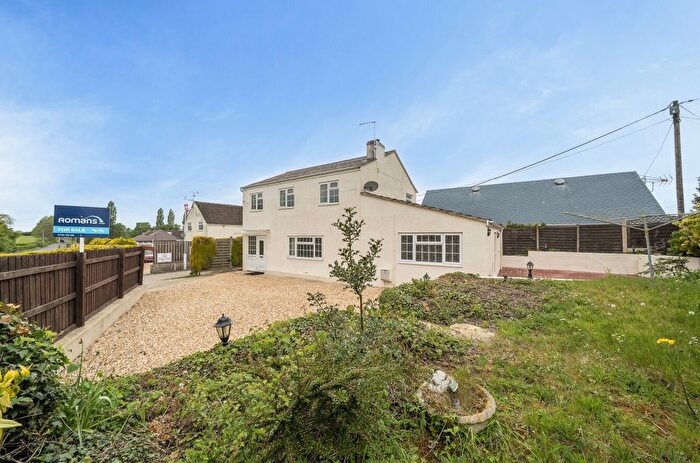
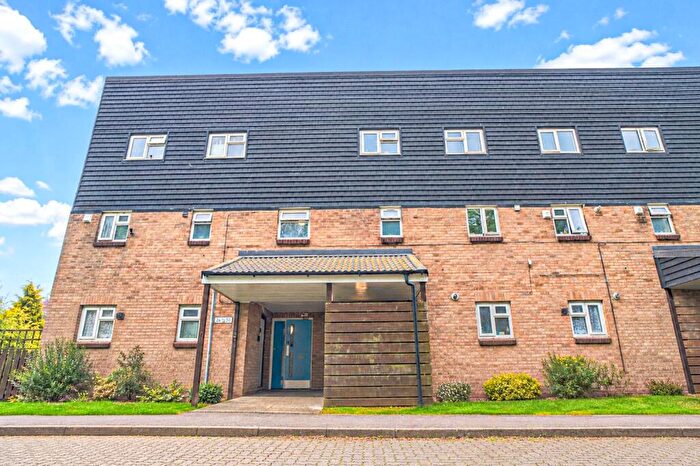
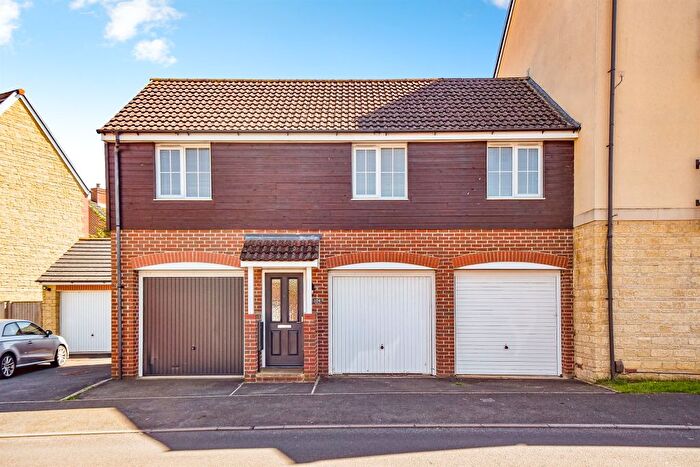
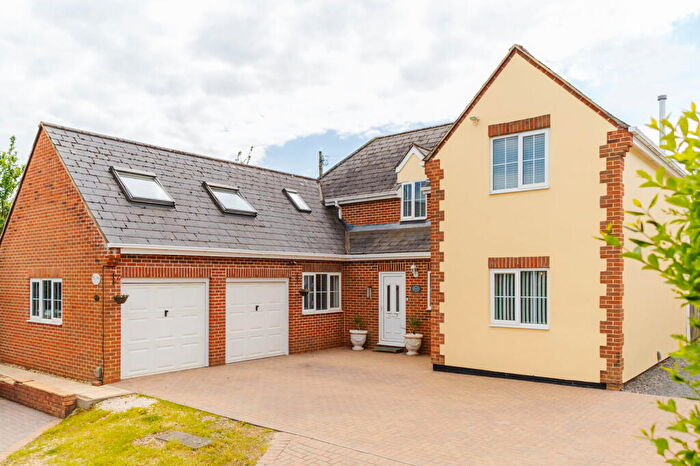
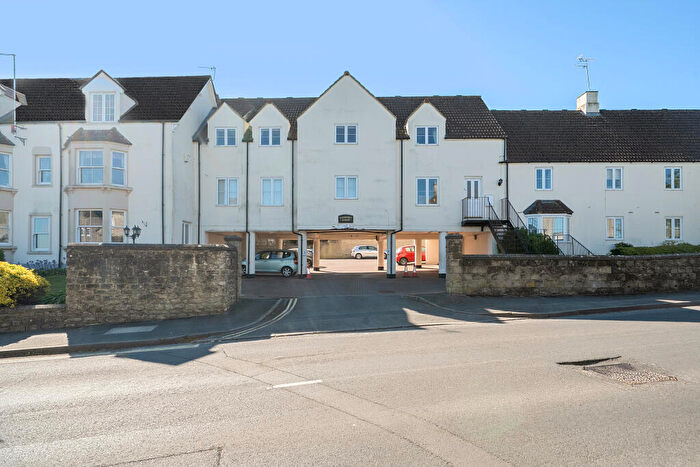
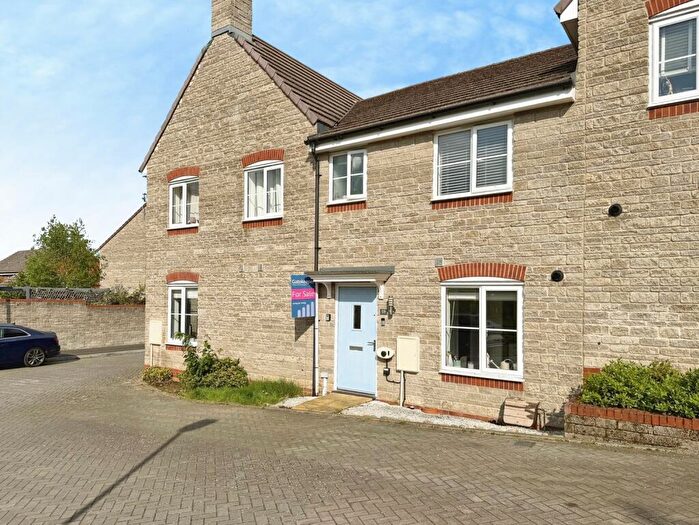
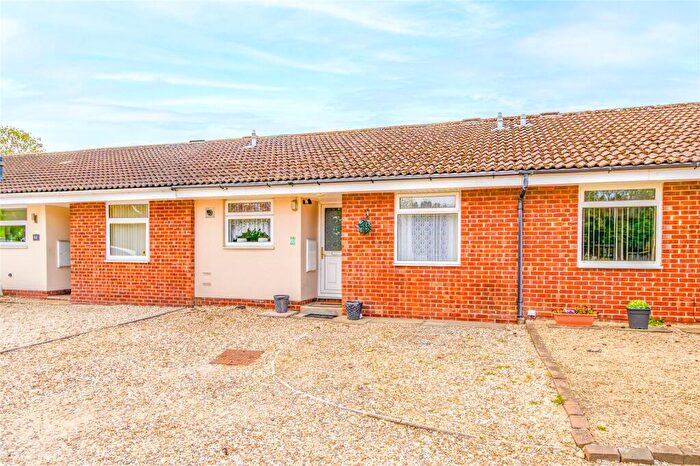
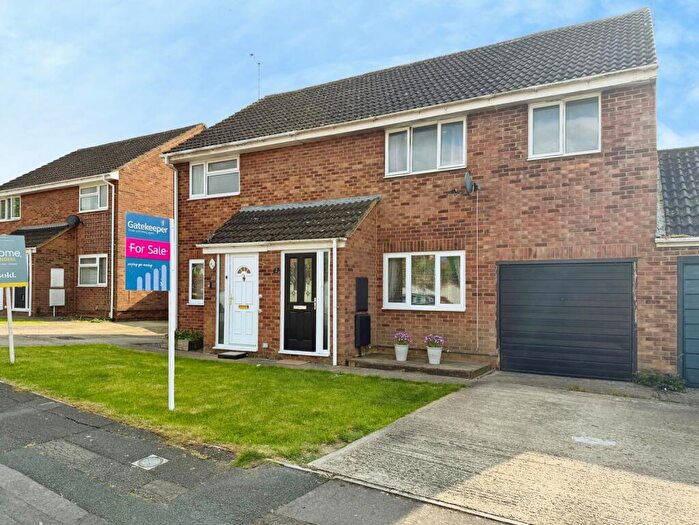
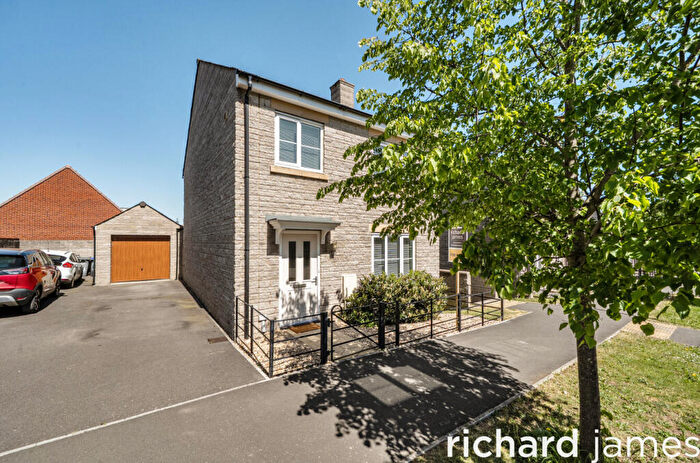
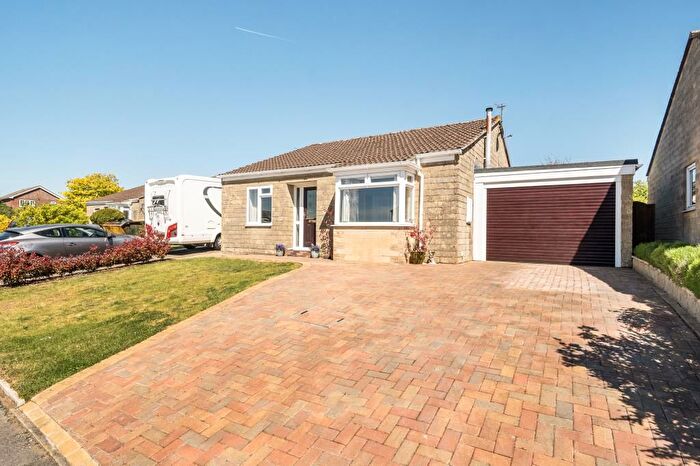
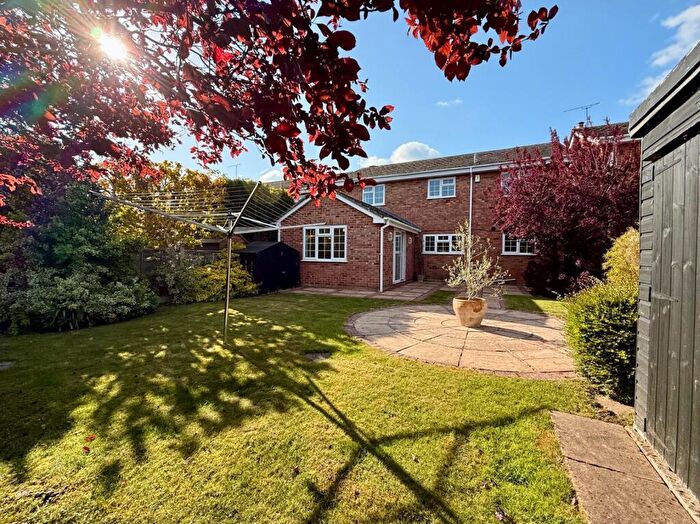
Houses and Flats for sale in SN5, West Swindon

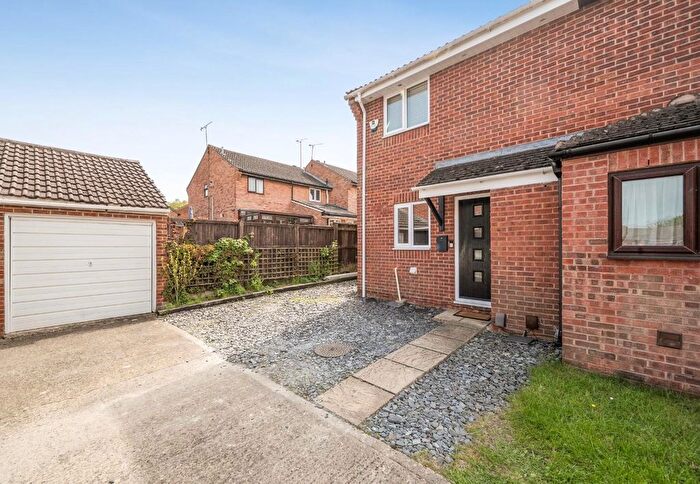
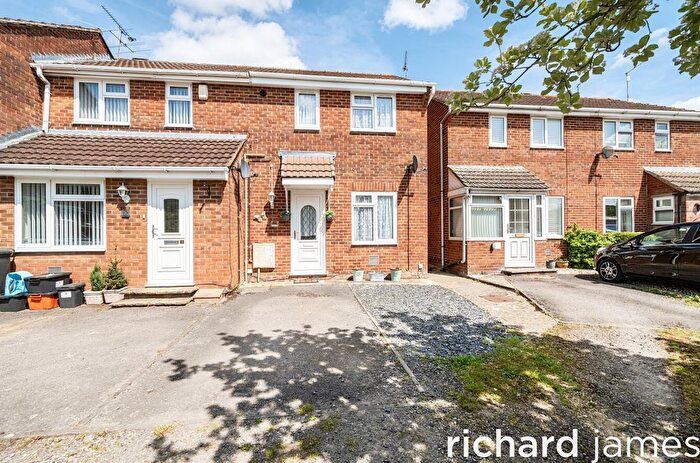
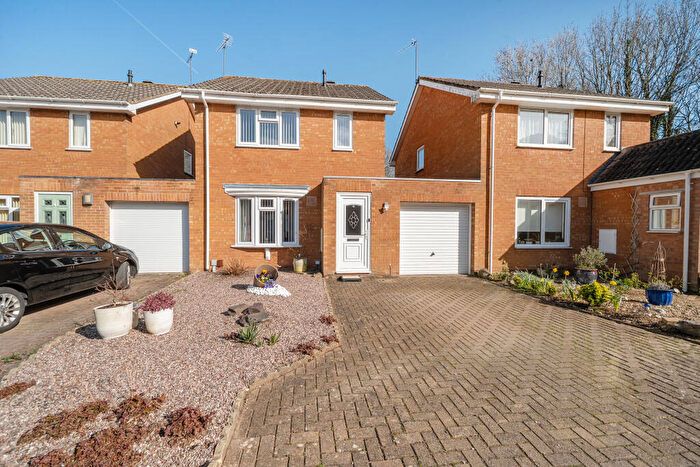
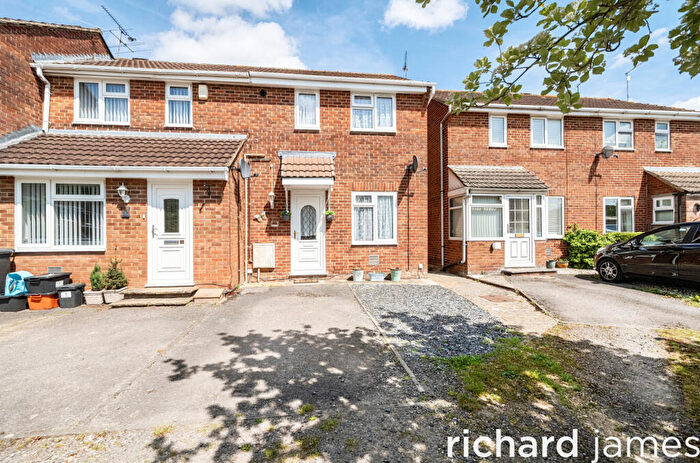
![]()
If you are looking to sell your house, let it out, or receive a property valuation, an expert can help you.
Click the button below to get started.


Frequently Asked Questions about SN5
What is the average price for a property for sale in SN5?
The average price for a property for sale in SN5 is £298,919. There are 150 property listings for sale in SN5.
Which areas are included in the SN5 postcode district?
The main area within SN5 is West Swindon.
What are the most common property types in SN5?
The most common property types in SN5 are Detached Houses, Terraced Houses, Semi Detached Houses and Flats.
What has been the average sold property price in SN5 over the last three years?
Detached Houses in SN5 have an average sold price of £419,011, while Terraced Houses have an average of £227,162. Semi Detached Houses have an average of £274,035 and Flats have an average of £144,393. The average sold property price in SN5 over the last three years is approximately £301,700.