
Properties for sale in SO50
Eastleigh Town Centre
- Info
- Price Paid By Year
- Property Type Price
- Transport
House Prices in SO50
Properties in SO50 have an average house price of £317,514.00 and had 1997 Property Transactions within the last 3 years.
The most expensive property was sold for £2,000,000.00.
Property Price Paid in SO50 by Year
The average sold property price by year was:
| Year | Average Sold Price | Sold Properties |
|---|---|---|
| 2026 | £342,928.00 | 21 Properties |
| 2025 | £315,984.00 | 642 Properties |
| 2024 | £314,641.00 | 667 Properties |
| 2023 | £321,061.00 | 667 Properties |
| 2022 | £331,699.00 | 870 Properties |
| 2021 | £312,262.00 | 1,127 Properties |
| 2020 | £310,164.00 | 824 Properties |
| 2019 | £294,732.00 | 876 Properties |
| 2018 | £290,473.00 | 948 Properties |
| 2017 | £302,797.00 | 1,083 Properties |
| 2016 | £269,129.00 | 1,068 Properties |
| 2015 | £250,878.00 | 1,020 Properties |
| 2014 | £223,101.00 | 903 Properties |
| 2013 | £208,177.00 | 784 Properties |
| 2012 | £207,181.00 | 549 Properties |
| 2011 | £208,883.00 | 567 Properties |
| 2010 | £198,508.00 | 580 Properties |
| 2009 | £185,288.00 | 632 Properties |
| 2008 | £199,170.00 | 547 Properties |
| 2007 | £211,804.00 | 1,107 Properties |
| 2006 | £192,086.00 | 1,216 Properties |
| 2005 | £189,078.00 | 857 Properties |
| 2004 | £181,032.00 | 1,005 Properties |
| 2003 | £170,774.00 | 1,055 Properties |
| 2002 | £145,105.00 | 1,031 Properties |
| 2001 | £123,006.00 | 1,017 Properties |
| 2000 | £109,881.00 | 919 Properties |
| 1999 | £94,292.00 | 1,140 Properties |
| 1998 | £80,938.00 | 909 Properties |
| 1997 | £77,101.00 | 910 Properties |
| 1996 | £66,918.00 | 935 Properties |
| 1995 | £64,010.00 | 717 Properties |
Property Price per Property Type in SO50
Here you can find historic sold price data in order to help with your property search.
The average Property Paid Price for specific property types in the last three years are:
| Property Type | Average Sold Price | Sold Properties |
|---|---|---|
| Semi Detached House | £342,396.00 | 539 Semi Detached Houses |
| Terraced House | £287,460.00 | 629 Terraced Houses |
| Detached House | £480,785.00 | 372 Detached Houses |
| Flat | £196,630.00 | 457 Flats |

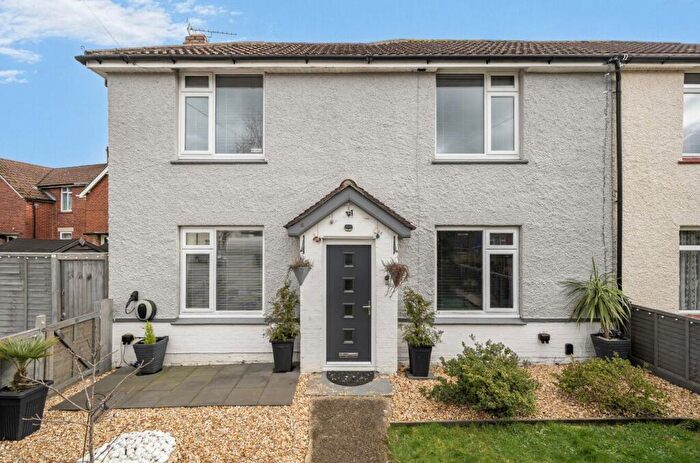
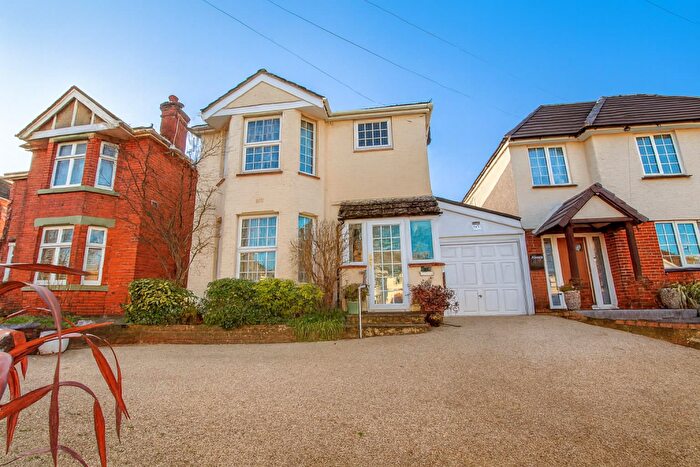
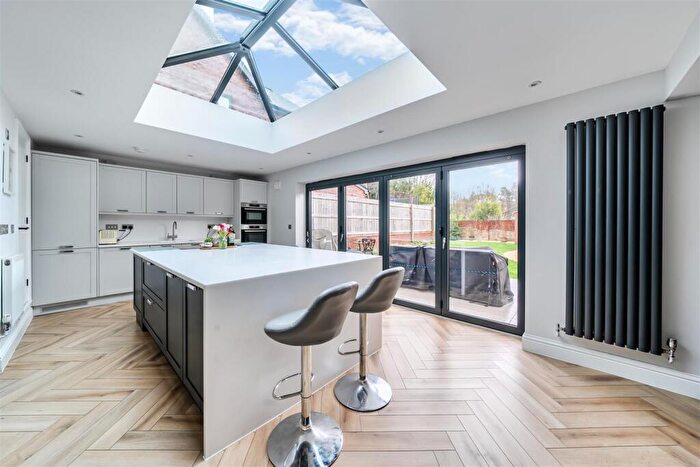
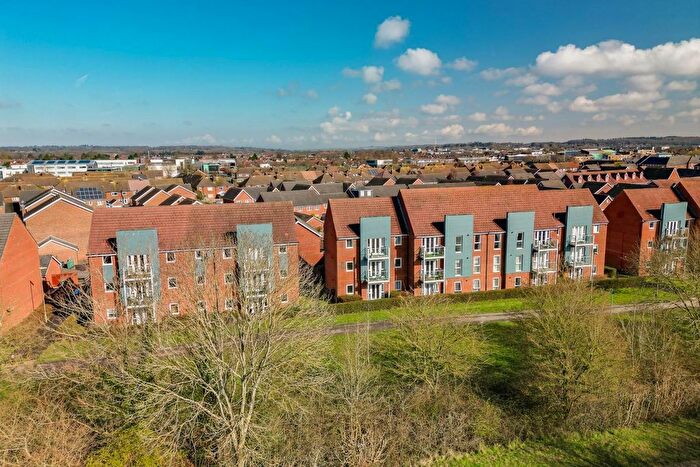
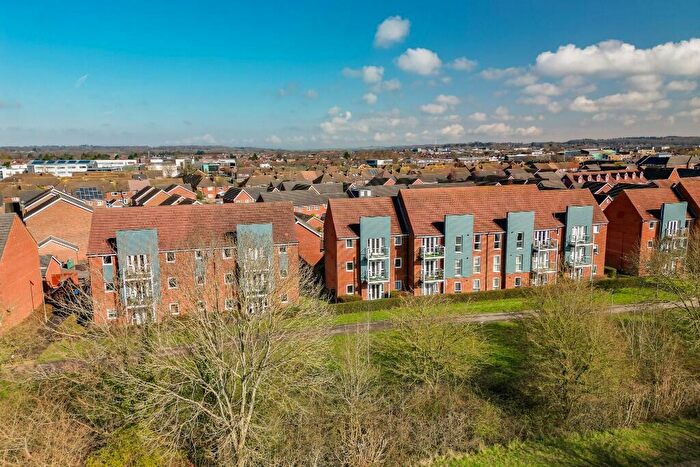
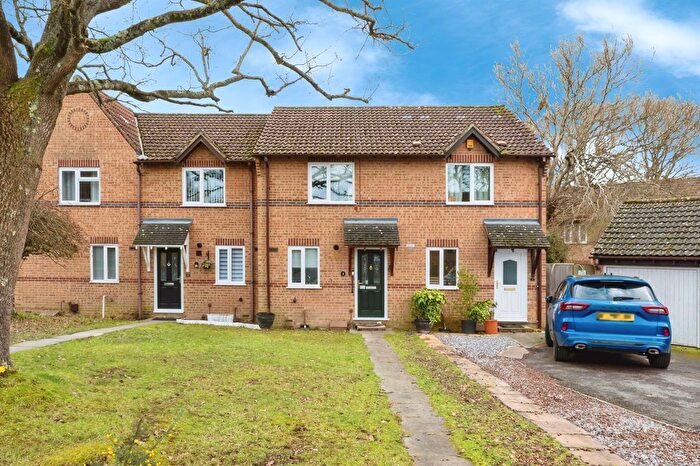
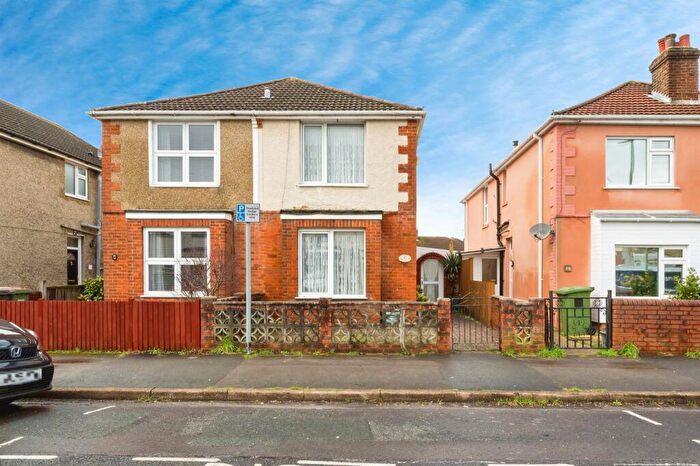
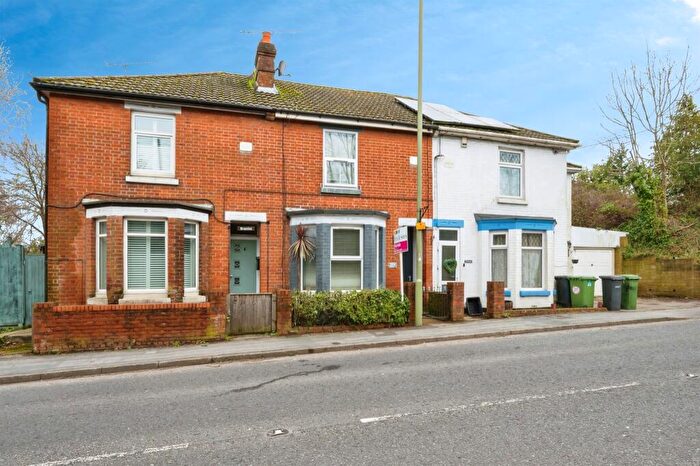
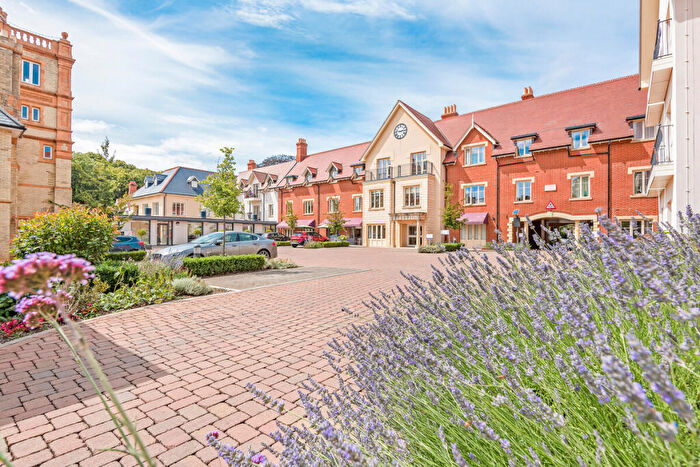
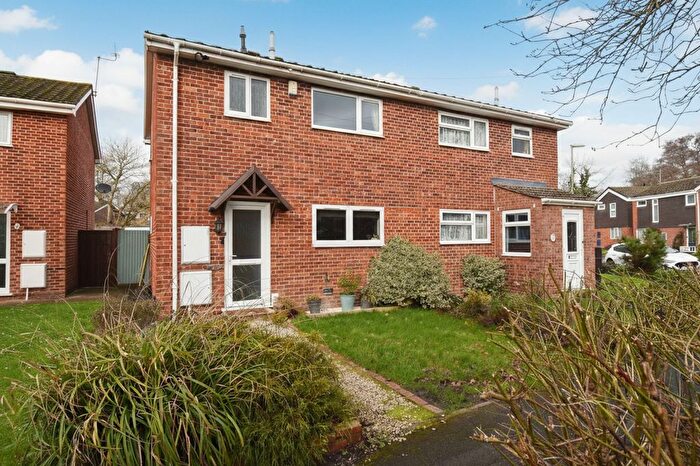
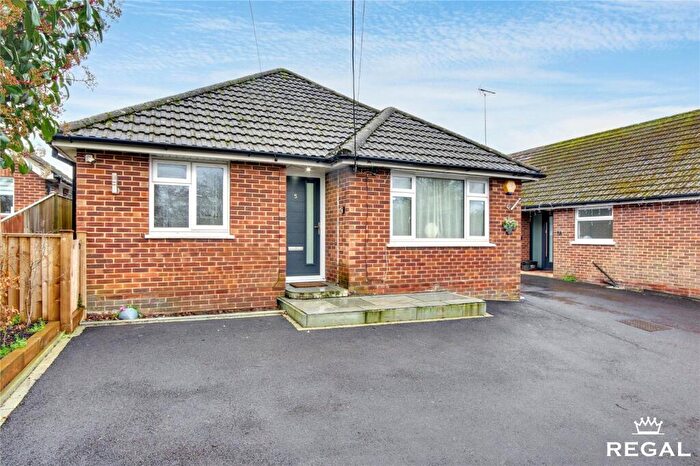
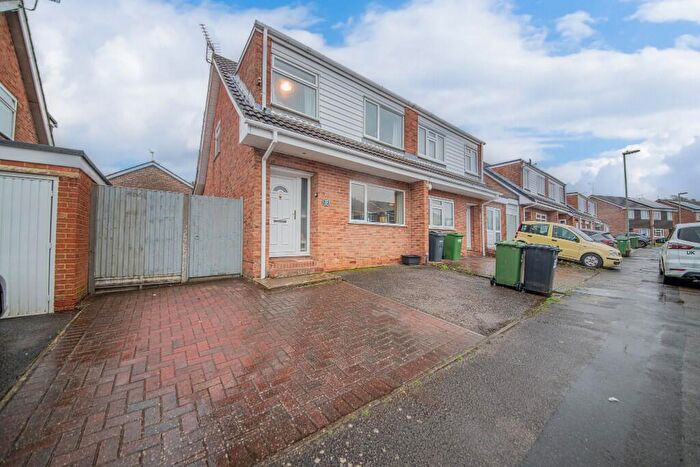
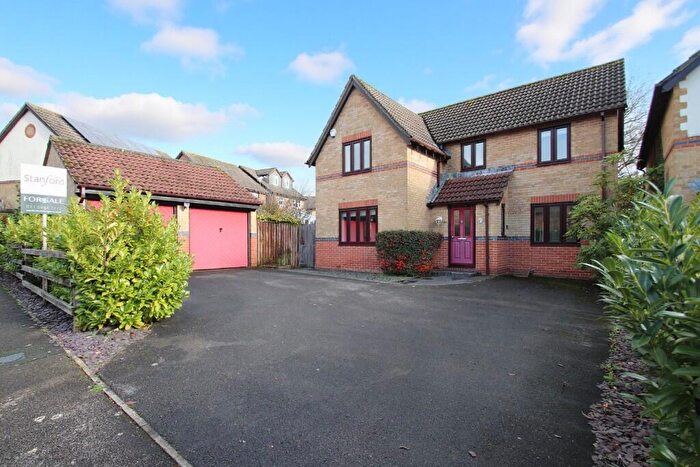
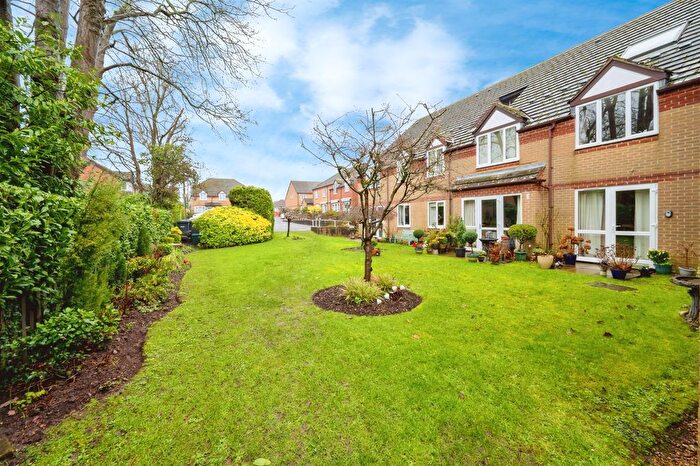
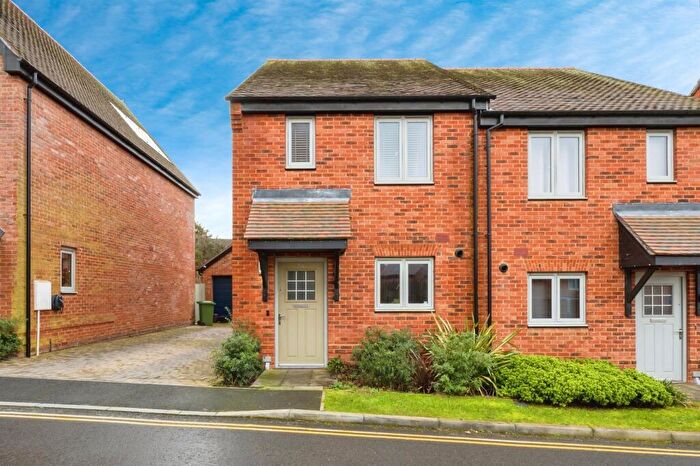
Houses and Flats for sale in SO50, Eastleigh Town Centre
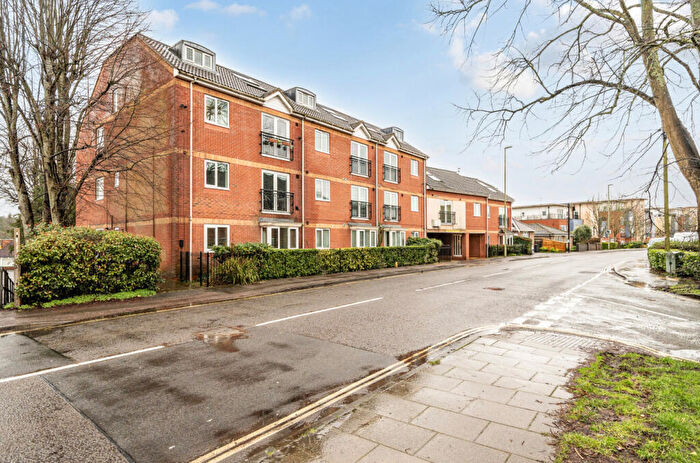
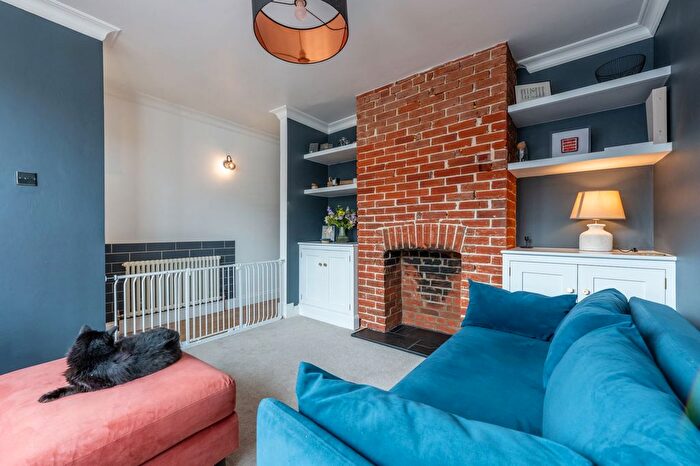
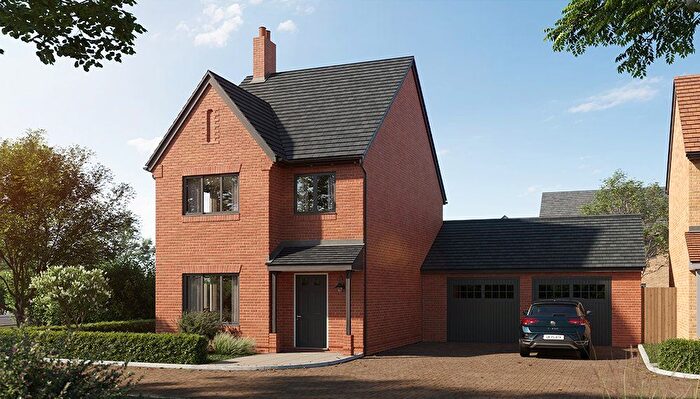

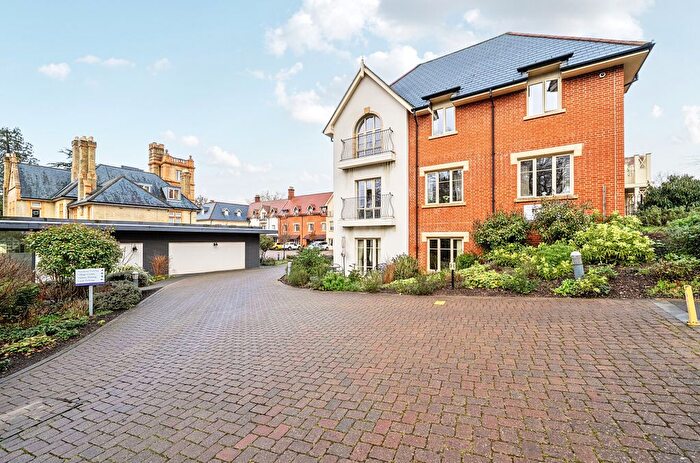
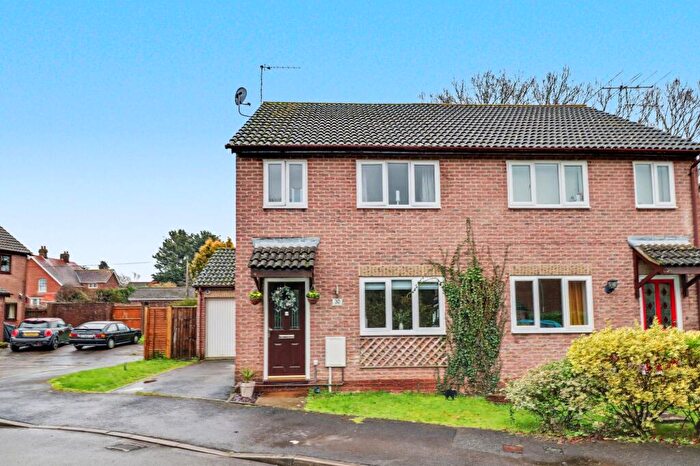
![]()
If you are looking to sell your house, let it out, or receive a property valuation, an expert can help you.
Click the button below to get started.


Frequently Asked Questions about SO50
What is the average price for a property for sale in SO50?
The average price for a property for sale in SO50 is £317,514. There are 320 property listings for sale in SO50.
Which areas are included in the SO50 postcode district?
The main area within SO50 is Eastleigh Town Centre.
What are the most common property types in SO50?
The most common property types in SO50 are Terraced Houses, Semi Detached Houses, Flats and Detached Houses.
What has been the average sold property price in SO50 over the last three years?
Terraced Houses in SO50 have an average sold price of £287,460, while Semi Detached Houses have an average of £342,396. Flats have an average of £196,630 and Detached Houses have an average of £480,785. The average sold property price in SO50 over the last three years is approximately £324,518.
Which train stations are available in SO50?
The train station available in SO50 is Eastleigh Station..