
Properties for sale in SO
Southampton
- Info
- Price Paid By Year
- Property Type Price
House Prices in SO
Properties in SO have an average house price of £395,792 and had 27478 Property Transactions within the last 3 years.
The most expensive property was sold for £14,011,076.
Property Price Paid in SO by Year
The average sold property price by year was:
| Year | Average Sold Price | Sold Properties |
|---|---|---|
| 2026 | £399,799.00 | 725 Properties |
| 2025 | £391,712.00 | 8,992 Properties |
| 2024 | £400,256.00 | 9,196 Properties |
| 2023 | £394,943.00 | 8,565 Properties |
| 2022 | £414,821.00 | 10,684 Properties |
| 2021 | £391,699.00 | 13,798 Properties |
| 2020 | £379,846.00 | 9,732 Properties |
| 2019 | £350,650.00 | 11,075 Properties |
| 2018 | £333,824.00 | 11,939 Properties |
| 2017 | £334,123.00 | 12,098 Properties |
| 2016 | £311,120.00 | 12,378 Properties |
| 2015 | £294,372.00 | 12,642 Properties |
| 2014 | £275,441.00 | 12,424 Properties |
| 2013 | £263,353.00 | 10,340 Properties |
| 2012 | £261,855.00 | 8,625 Properties |
| 2011 | £259,586.00 | 8,525 Properties |
| 2010 | £260,917.00 | 8,524 Properties |
| 2009 | £240,308.00 | 8,673 Properties |
| 2008 | £249,826.00 | 8,264 Properties |
| 2007 | £250,609.00 | 15,422 Properties |
| 2006 | £231,407.00 | 16,769 Properties |
| 2005 | £222,408.00 | 12,903 Properties |
| 2004 | £215,509.00 | 14,755 Properties |
| 2003 | £195,883.00 | 14,117 Properties |
| 2002 | £170,700.00 | 16,314 Properties |
| 2001 | £144,257.00 | 15,485 Properties |
| 2000 | £129,312.00 | 14,055 Properties |
| 1999 | £107,040.00 | 16,346 Properties |
| 1998 | £96,375.00 | 14,489 Properties |
| 1997 | £86,372.00 | 15,528 Properties |
| 1996 | £79,437.00 | 13,805 Properties |
| 1995 | £75,726.00 | 10,970 Properties |
Property Price per Property Type in SO
Here you can find historic sold price data in order to help with your property search.
The average Property Paid Price for specific property types in the last three years are:
| Property Type | Average Sold Price | Sold Properties |
|---|---|---|
| Semi Detached House | £371,894.00 | 6,626 Semi Detached Houses |
| Terraced House | £326,080.00 | 6,653 Terraced Houses |
| Detached House | £638,194.00 | 7,786 Detached Houses |
| Flat | £198,505.00 | 6,413 Flats |
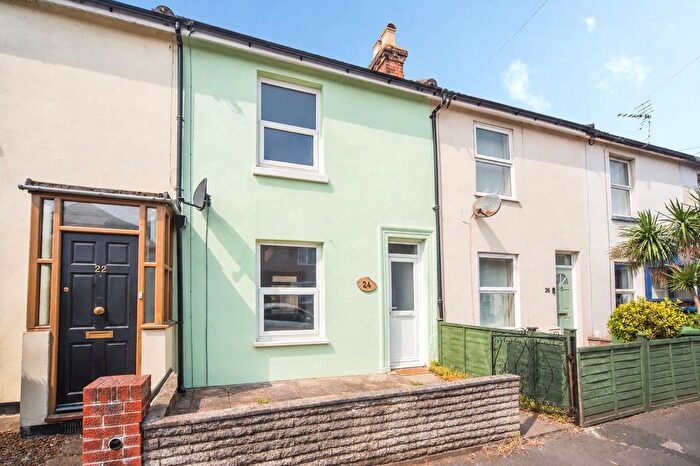
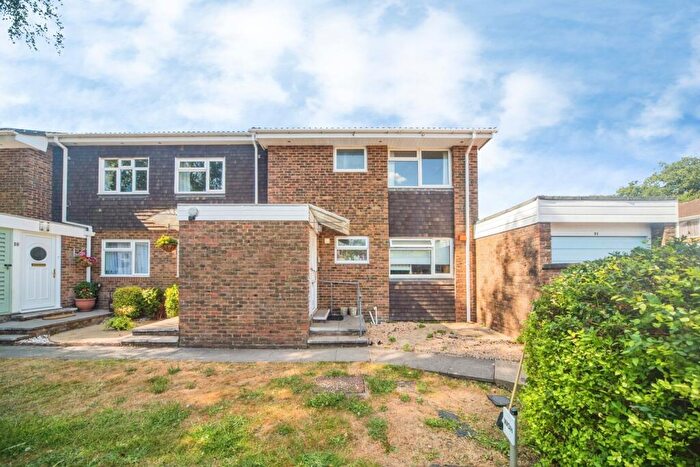
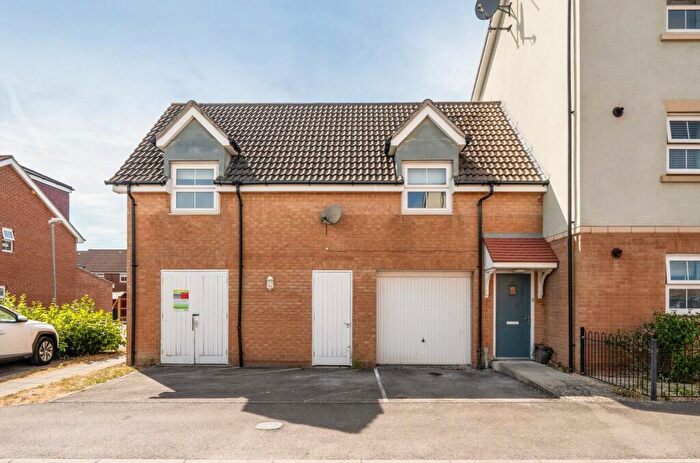
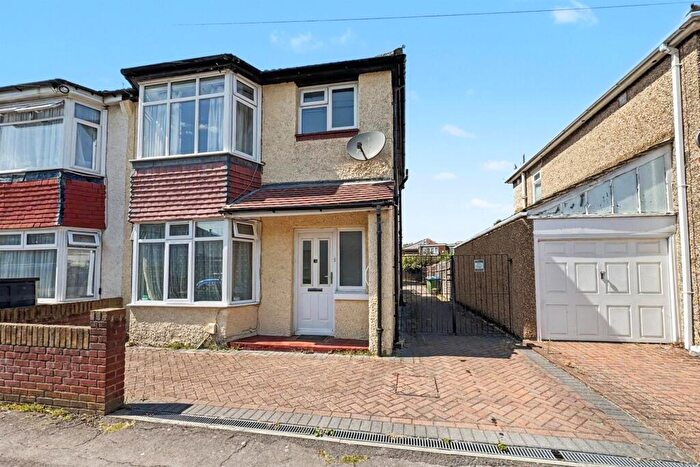
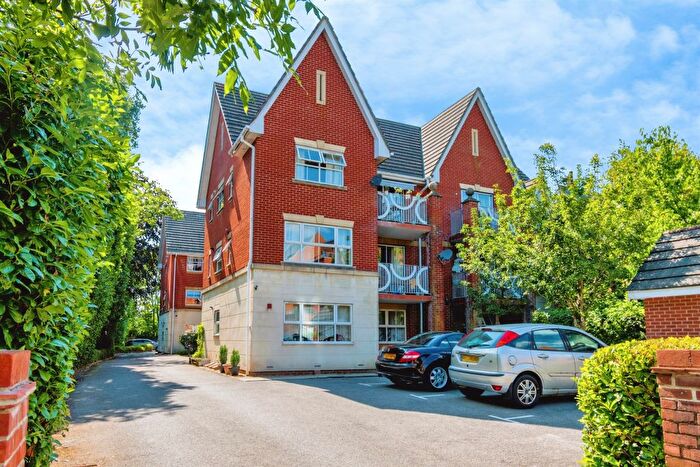
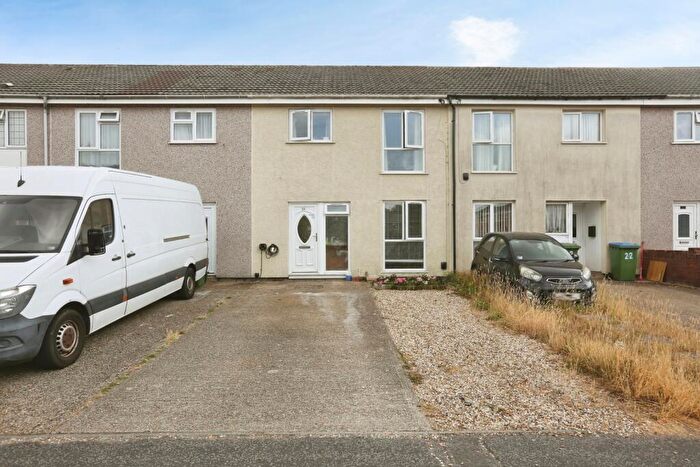
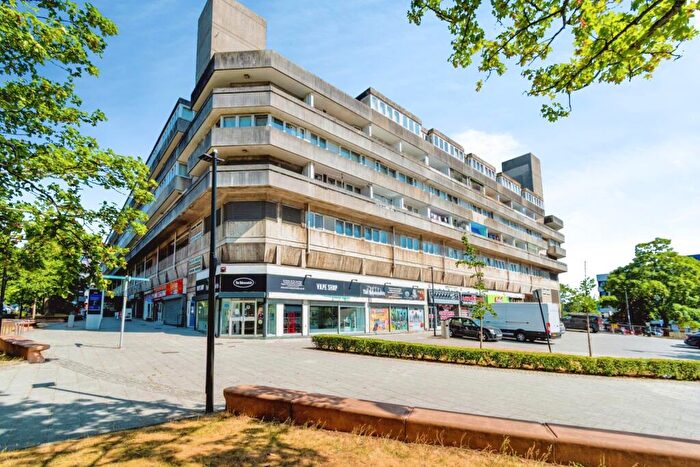
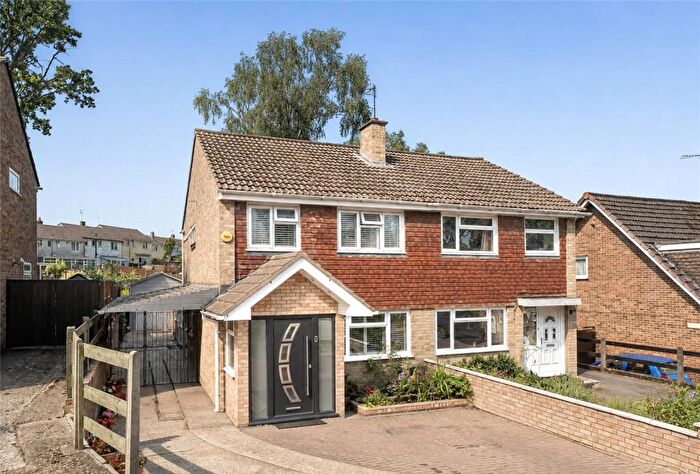
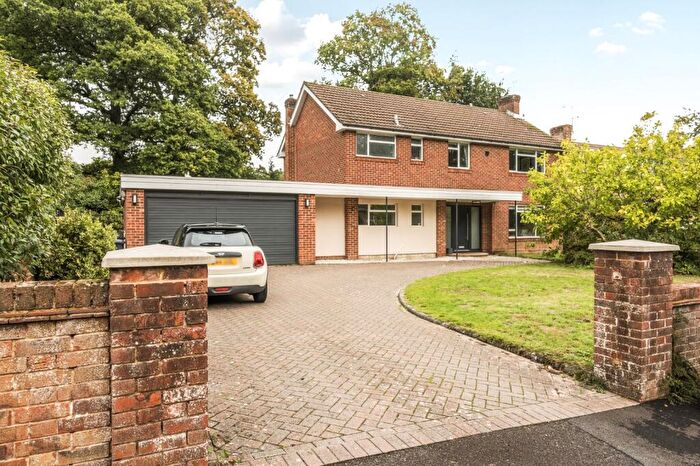
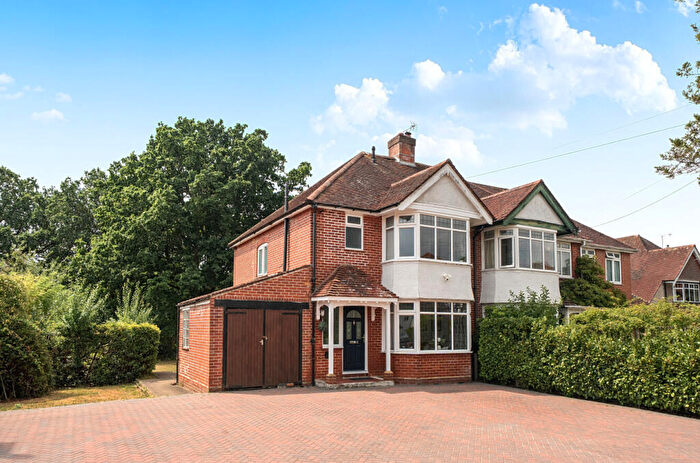
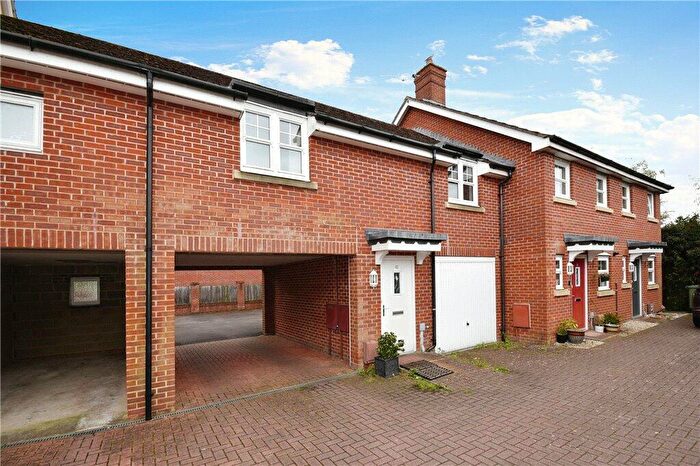
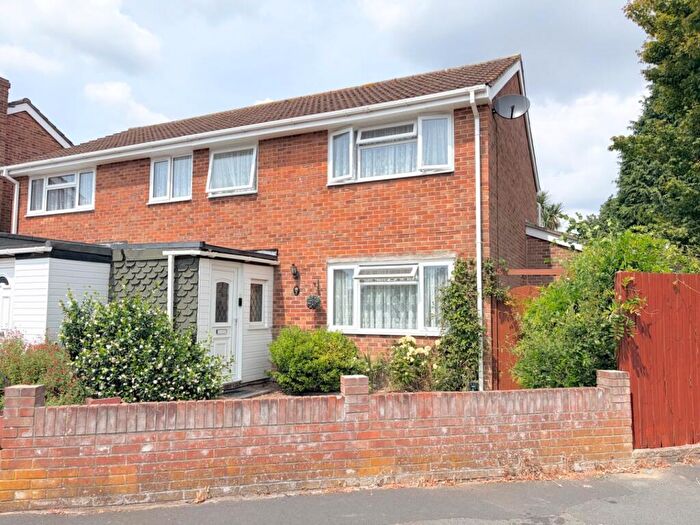
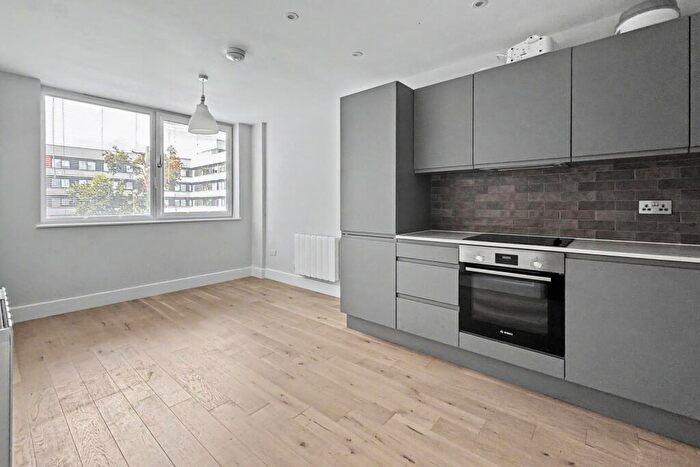
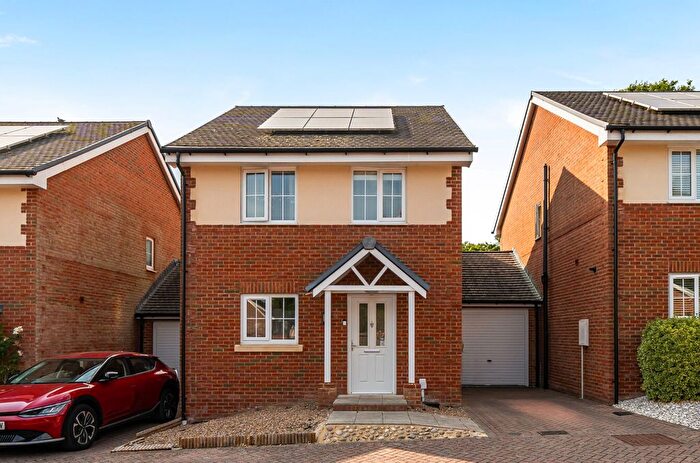
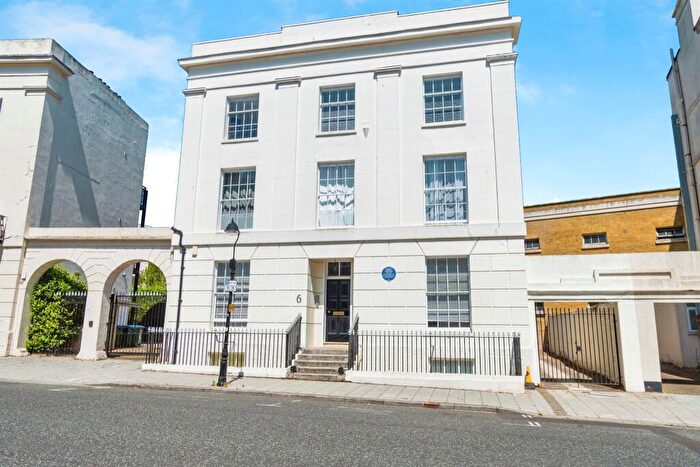
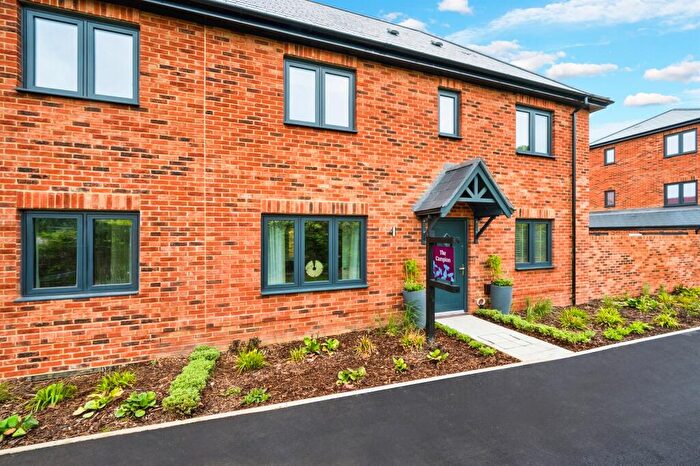
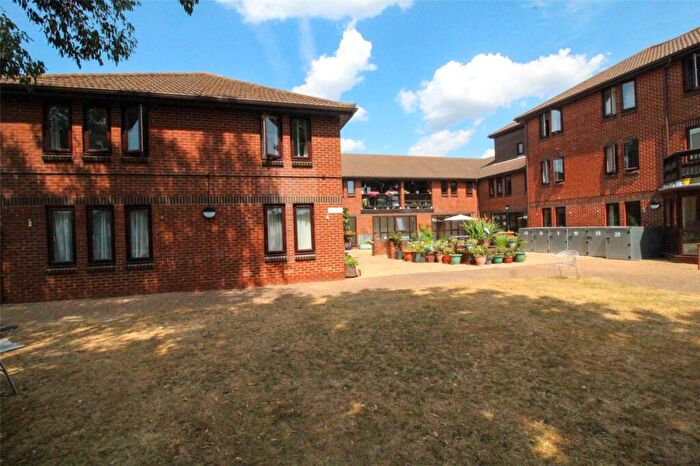
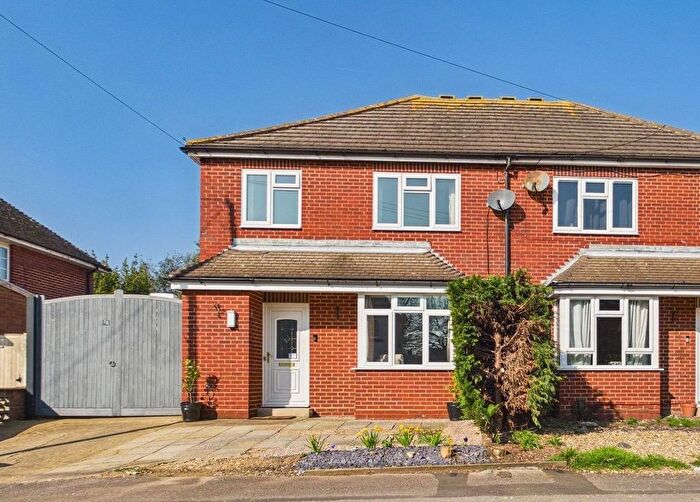
Houses and Flats for sale in SO, Southampton
There are 4,542 results. Property prices in SO range from £10k to £9.95M with an average price of £483k.
![]()
If you are looking to sell your house, let it out, or receive a property valuation, an expert can help you.
Click the button below to get started.
Postcode districts in SO, Southampton
Navigate through our locations to find the location of your next house in SO, Southampton, England for sale or to rent.
Transport in SO, Southampton
Please see below transportation links in this area:
-
 Swaythling Station
 -
St.Denys Station
-
Southampton Airport (Parkway) Station
-
Bitterne Station
-
Southampton Central Station
-
Eastleigh Station
-
Millbrook (Hampshire) Station
-
Woolston Station
Frequently asked questions about SO
What is the average price for a property for sale in SO?
The average price for a property for sale in SO is £395,792. This amount is 10% higher than the average price in England. There are 4,542 property listings for sale in SO.
What locations have the most expensive properties for sale in SO?
The locations with the most expensive properties for sale in SO are SO42 at an average of £980,022, SO20 at an average of £744,606 and SO21 at an average of £702,486.
What locations have the most affordable properties for sale in SO?
The locations with the most affordable properties for sale in SO are SO14 at an average of £231,512, SO17 at an average of £241,077 and SO19 at an average of £255,807.
Which train stations are available in or near SO?
Some of the train stations available in or near SO are Swaythling, St.Denys and Southampton Airport (Parkway).