
Properties for sale in SO53
Chandler's Ford
- Info
- Price Paid By Year
- Property Type Price
- Transport
House Prices in SO53
Properties in SO53 have an average house price of £444,372.00 and had 1458 Property Transactions within the last 3 years.
The most expensive property was sold for £1,640,000.00.
Property Price Paid in SO53 by Year
The average sold property price by year was:
| Year | Average Sold Price | Sold Properties |
|---|---|---|
| 2025 | £432,217.00 | 185 Properties |
| 2024 | £434,397.00 | 432 Properties |
| 2023 | £457,970.00 | 396 Properties |
| 2022 | £447,006.00 | 445 Properties |
| 2021 | £432,812.00 | 618 Properties |
| 2020 | £371,995.00 | 425 Properties |
| 2019 | £377,140.00 | 510 Properties |
| 2018 | £361,615.00 | 466 Properties |
| 2017 | £371,929.00 | 487 Properties |
| 2016 | £356,457.00 | 508 Properties |
| 2015 | £326,312.00 | 568 Properties |
| 2014 | £290,756.00 | 587 Properties |
| 2013 | £283,993.00 | 494 Properties |
| 2012 | £287,039.00 | 520 Properties |
| 2011 | £263,989.00 | 481 Properties |
| 2010 | £269,935.00 | 493 Properties |
| 2009 | £254,985.00 | 493 Properties |
| 2008 | £271,928.00 | 440 Properties |
| 2007 | £272,755.00 | 721 Properties |
| 2006 | £251,959.00 | 893 Properties |
| 2005 | £239,481.00 | 762 Properties |
| 2004 | £245,267.00 | 769 Properties |
| 2003 | £214,946.00 | 698 Properties |
| 2002 | £188,668.00 | 811 Properties |
| 2001 | £158,022.00 | 884 Properties |
| 2000 | £144,679.00 | 778 Properties |
| 1999 | £121,449.00 | 1,207 Properties |
| 1998 | £117,298.00 | 908 Properties |
| 1997 | £101,489.00 | 906 Properties |
| 1996 | £87,420.00 | 725 Properties |
| 1995 | £84,186.00 | 566 Properties |
Property Price per Property Type in SO53
Here you can find historic sold price data in order to help with your property search.
The average Property Paid Price for specific property types in the last three years are:
| Property Type | Average Sold Price | Sold Properties |
|---|---|---|
| Semi Detached House | £391,202.00 | 267 Semi Detached Houses |
| Terraced House | £328,929.00 | 285 Terraced Houses |
| Flat | £210,971.00 | 240 Flats |
| Detached House | £599,196.00 | 666 Detached Houses |

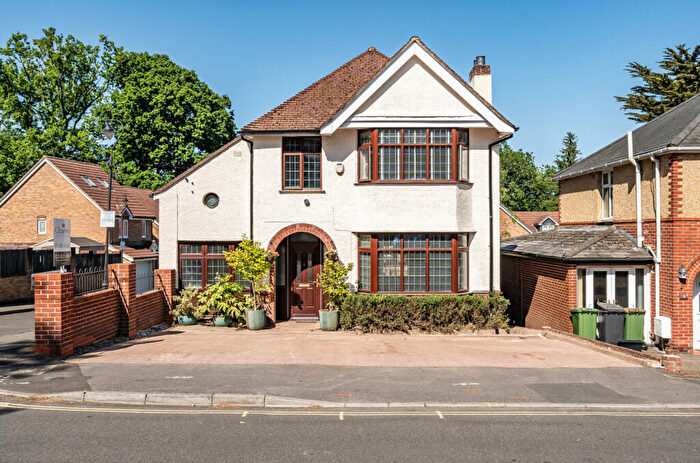
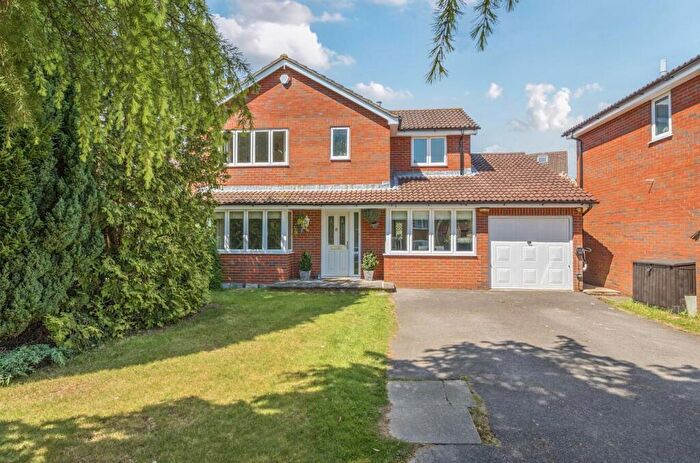
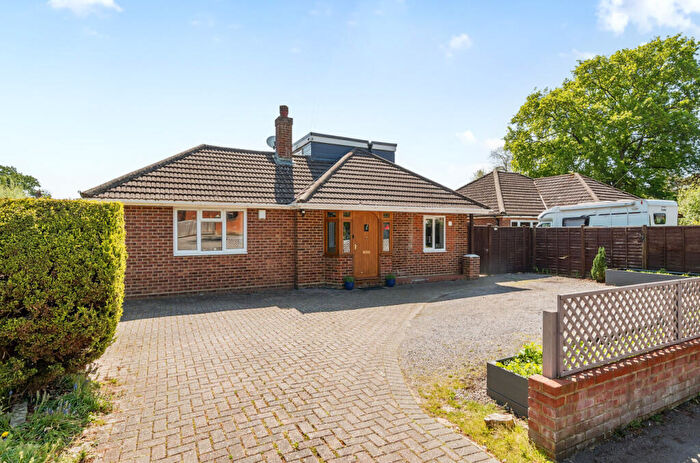
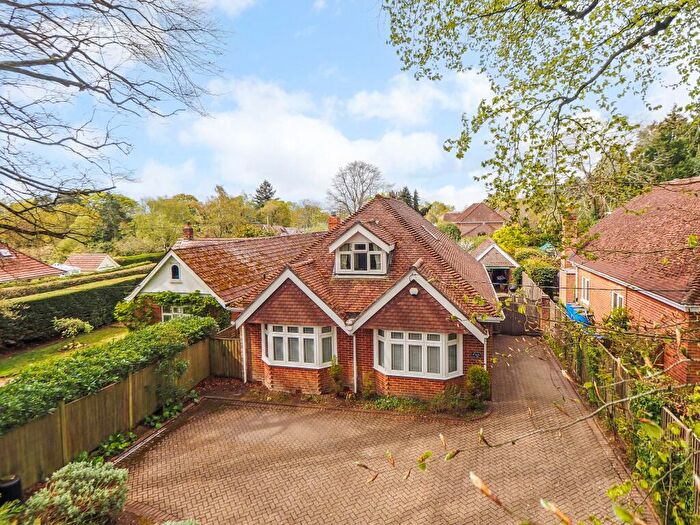
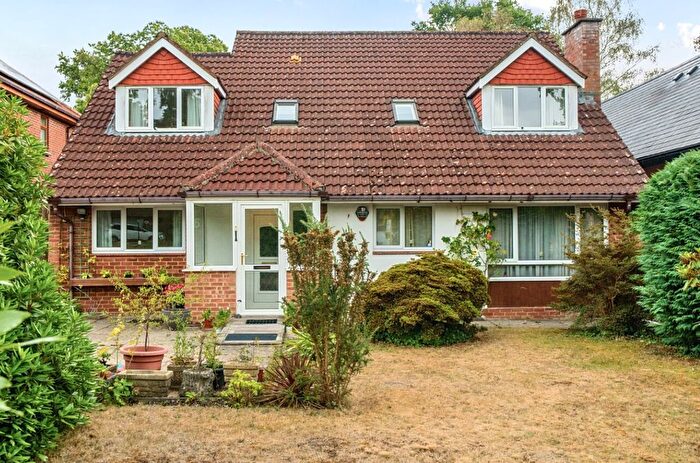
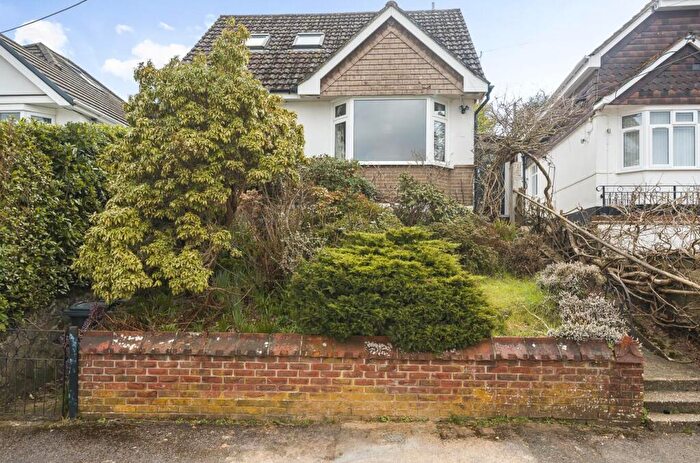
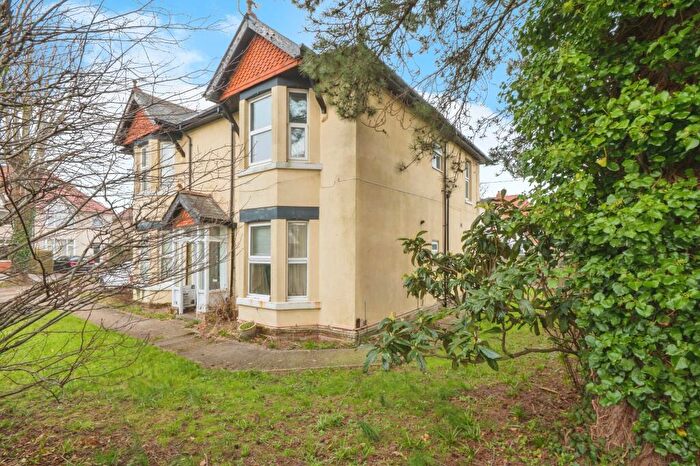
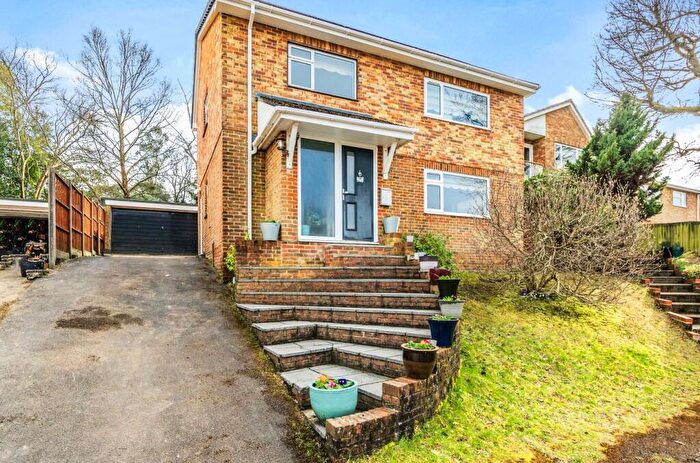
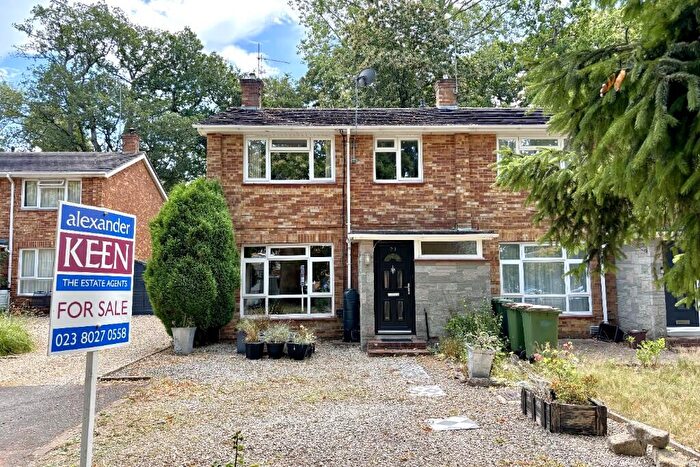
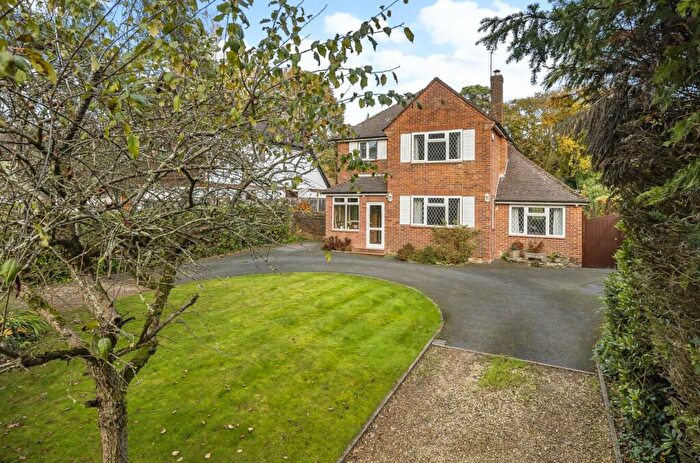
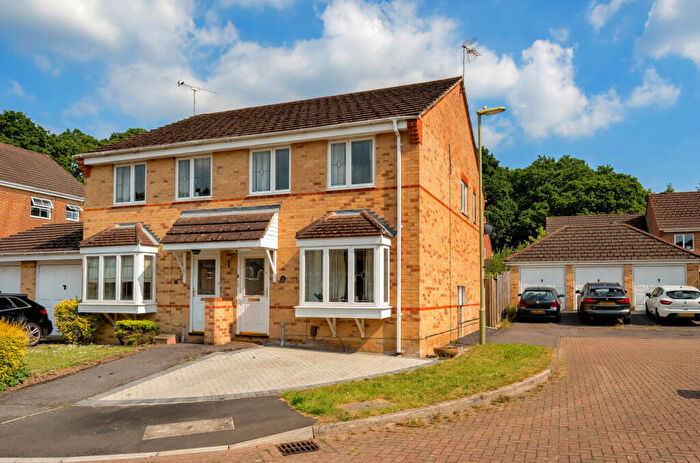
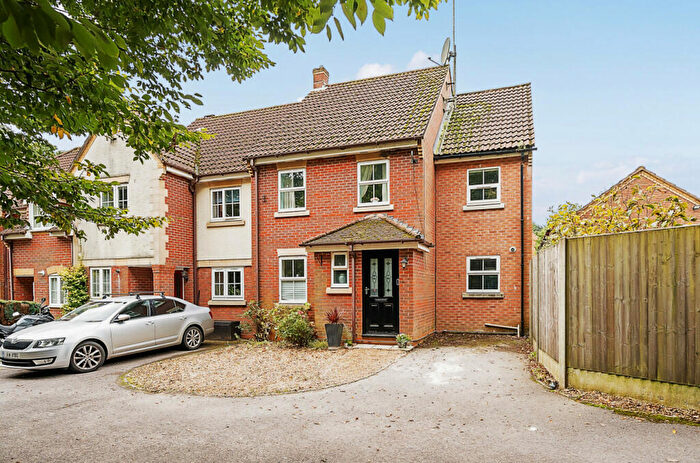
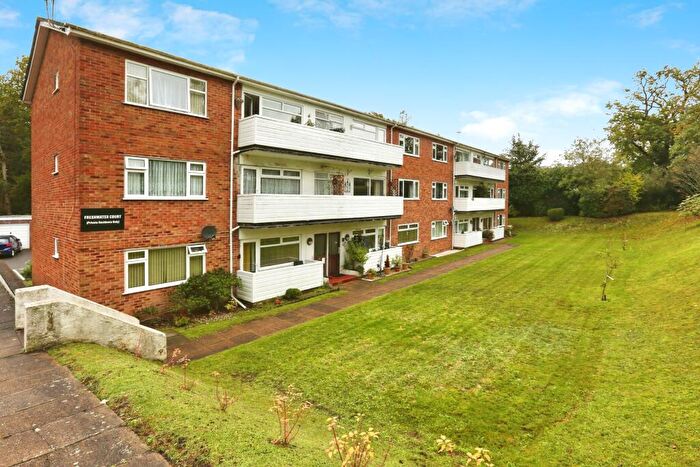
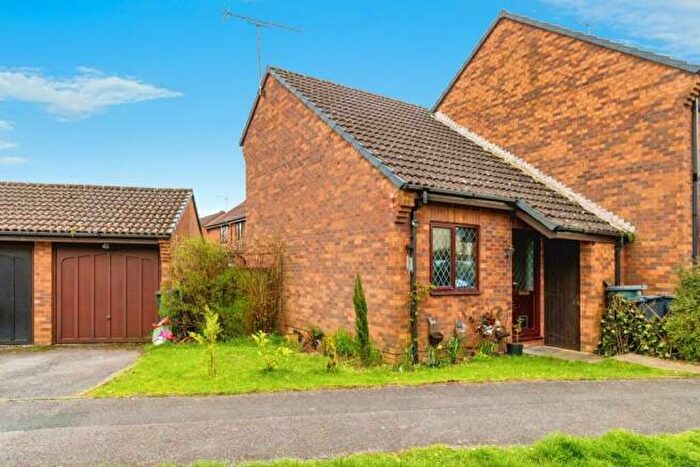
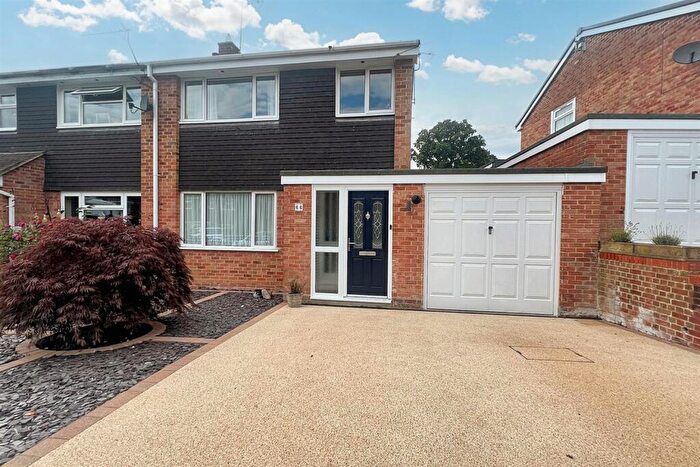
Houses and Flats for sale in SO53, Chandler's Ford
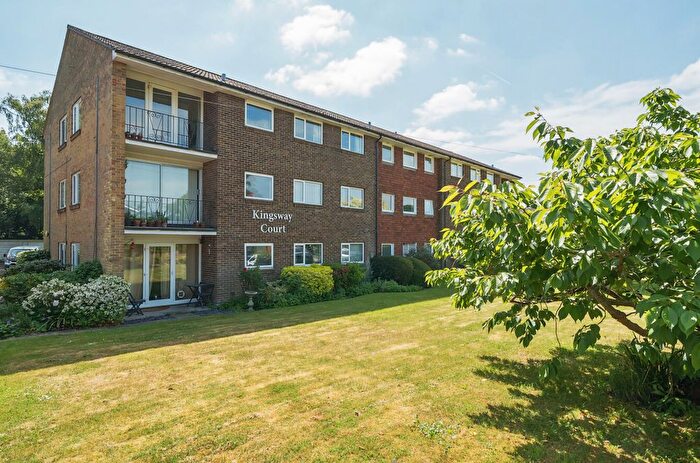
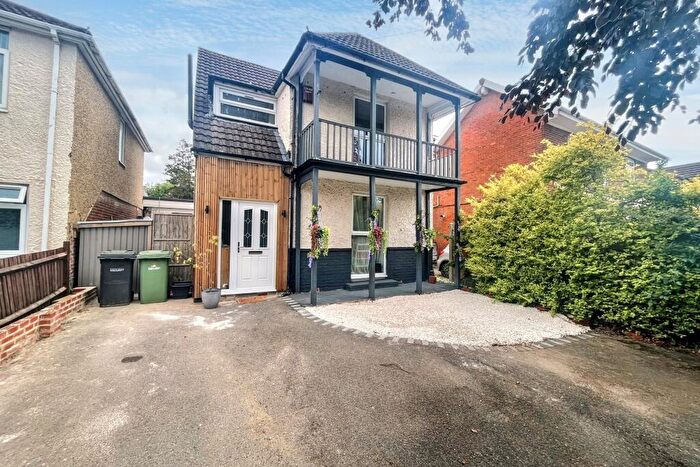

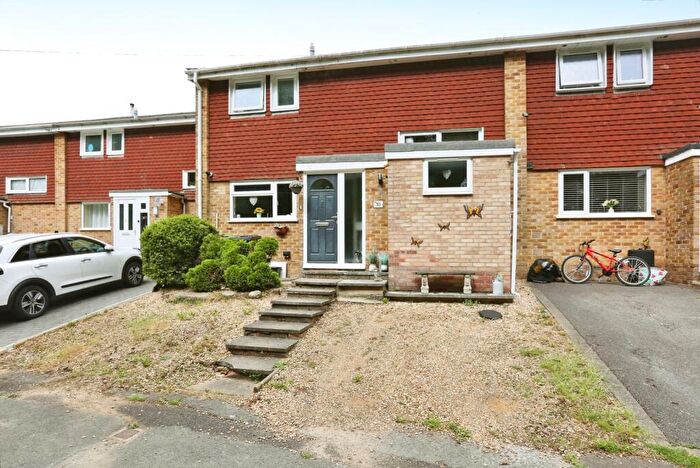
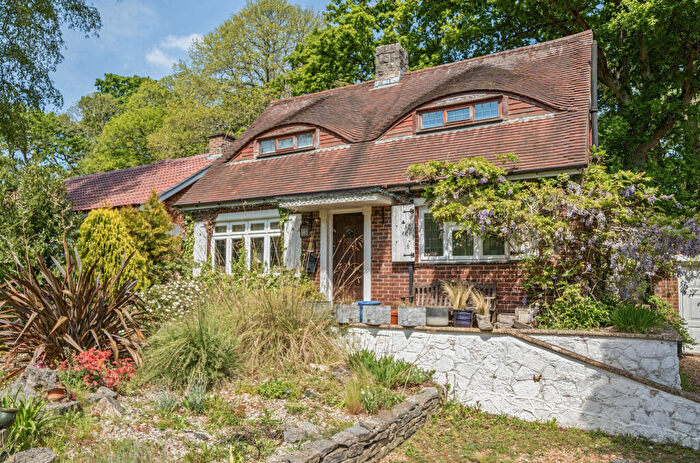
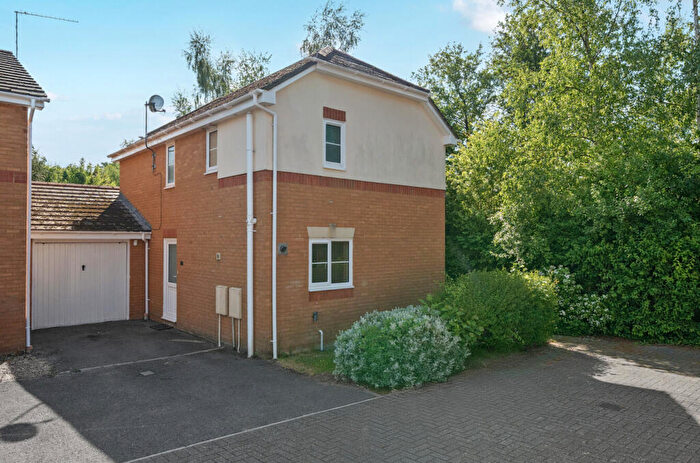
![]()
If you are looking to sell your house, let it out, or receive a property valuation, an expert can help you.
Click the button below to get started.


Frequently Asked Questions about SO53
What is the average price for a property for sale in SO53?
The average price for a property for sale in SO53 is £444,372. There are 143 property listings for sale in SO53.
Which areas are included in the SO53 postcode district?
The main area within SO53 is Chandler's Ford.
What are the most common property types in SO53?
The most common property types in SO53 are Detached Houses, Terraced Houses, Semi Detached Houses and Flats.
What has been the average sold property price in SO53 over the last three years?
Detached Houses in SO53 have an average sold price of £599,196, while Terraced Houses have an average of £328,929. Semi Detached Houses have an average of £391,202 and Flats have an average of £210,971. The average sold property price in SO53 over the last three years is approximately £441,528.
Which train stations are available in SO53?
The train station available in SO53 is Chandlers Ford Station..