
Properties for sale in SS0
Southend-on-Sea, Westcliff-on-Sea
- Info
- Price Paid By Year
- Property Type Price
- Transport
House Prices in SS0
Properties in SS0 have an average house price of £327,108.00 and had 1961 Property Transactions within the last 3 years.
The most expensive property was sold for £2,130,000.00.
Property Price Paid in SS0 by Year
The average sold property price by year was:
| Year | Average Sold Price | Sold Properties |
|---|---|---|
| 2026 | £410,700.00 | 35 Properties |
| 2025 | £336,101.00 | 624 Properties |
| 2024 | £318,514.00 | 672 Properties |
| 2023 | £322,724.00 | 630 Properties |
| 2022 | £346,635.00 | 873 Properties |
| 2021 | £328,118.00 | 1,090 Properties |
| 2020 | £311,014.00 | 608 Properties |
| 2019 | £292,925.00 | 741 Properties |
| 2018 | £291,009.00 | 875 Properties |
| 2017 | £279,994.00 | 946 Properties |
| 2016 | £246,192.00 | 981 Properties |
| 2015 | £218,898.00 | 1,021 Properties |
| 2014 | £210,267.00 | 921 Properties |
| 2013 | £193,930.00 | 734 Properties |
| 2012 | £182,138.00 | 597 Properties |
| 2011 | £185,849.00 | 615 Properties |
| 2010 | £186,447.00 | 578 Properties |
| 2009 | £183,200.00 | 527 Properties |
| 2008 | £185,366.00 | 662 Properties |
| 2007 | £188,095.00 | 1,371 Properties |
| 2006 | £168,849.00 | 1,308 Properties |
| 2005 | £157,888.00 | 1,095 Properties |
| 2004 | £150,366.00 | 1,309 Properties |
| 2003 | £132,568.00 | 1,344 Properties |
| 2002 | £106,024.00 | 1,467 Properties |
| 2001 | £88,430.00 | 1,376 Properties |
| 2000 | £75,876.00 | 1,293 Properties |
| 1999 | £69,708.00 | 1,367 Properties |
| 1998 | £60,702.00 | 1,190 Properties |
| 1997 | £59,802.00 | 1,224 Properties |
| 1996 | £47,367.00 | 1,016 Properties |
| 1995 | £46,942.00 | 907 Properties |
Property Price per Property Type in SS0
Here you can find historic sold price data in order to help with your property search.
The average Property Paid Price for specific property types in the last three years are:
| Property Type | Average Sold Price | Sold Properties |
|---|---|---|
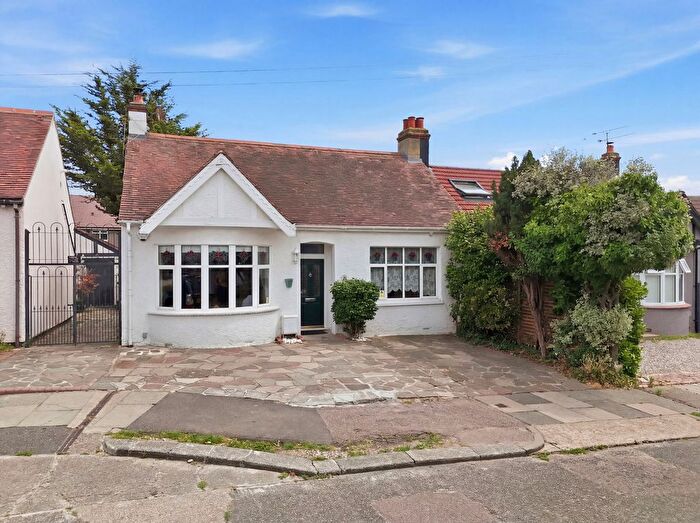
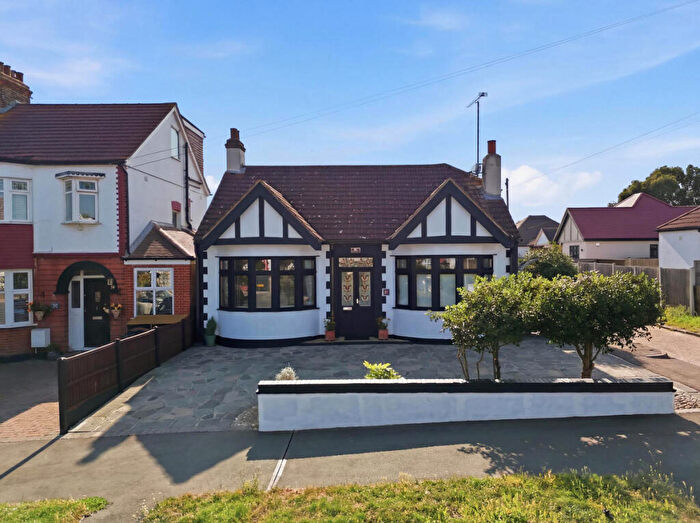
| Semi Detached House | £428,154.00 | 400 Semi Detached Houses |
| Detached House | £661,162.00 | 190 Detached Houses |
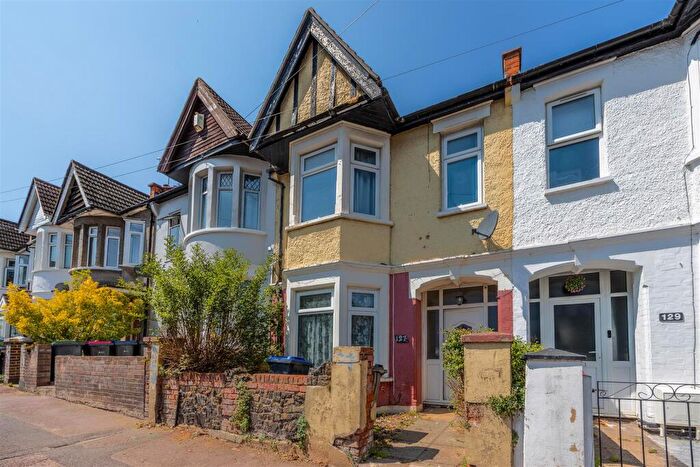
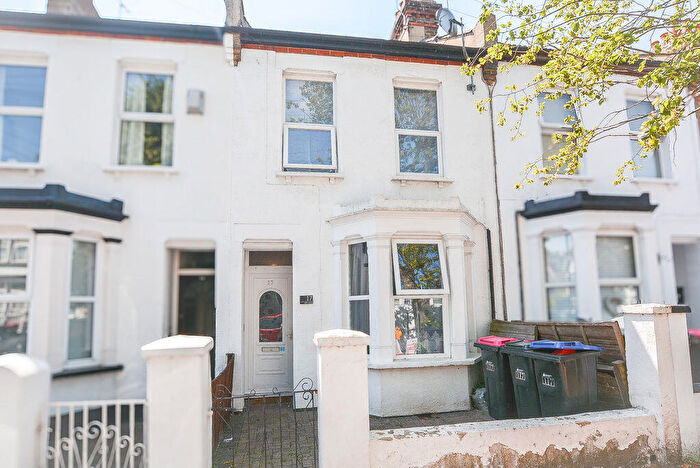
| Terraced House | £328,341.00 | 418 Terraced Houses |
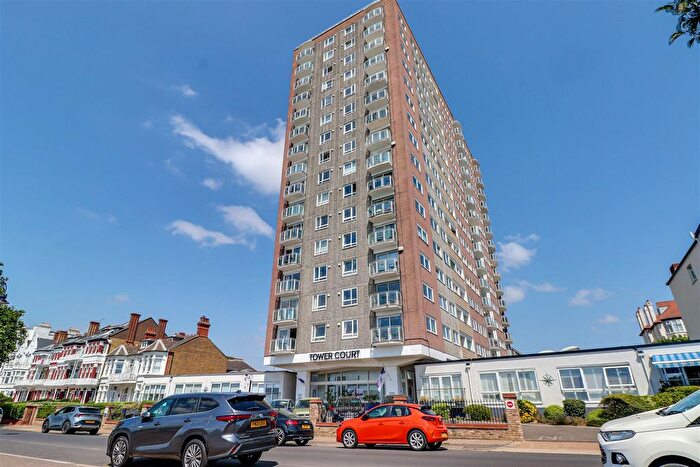
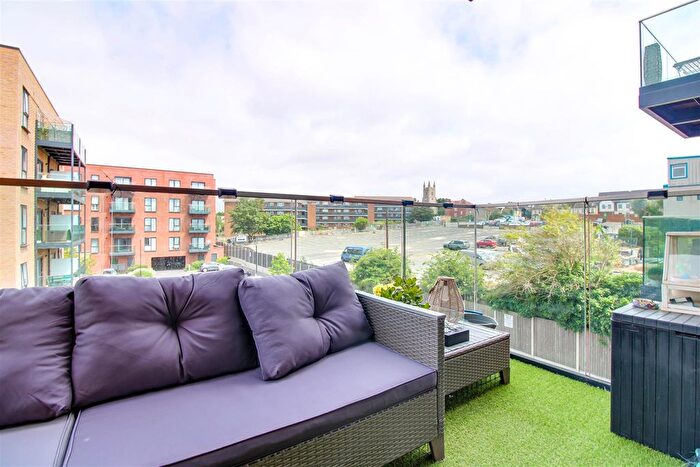
| Flat | £217,555.00 | 953 Flats |

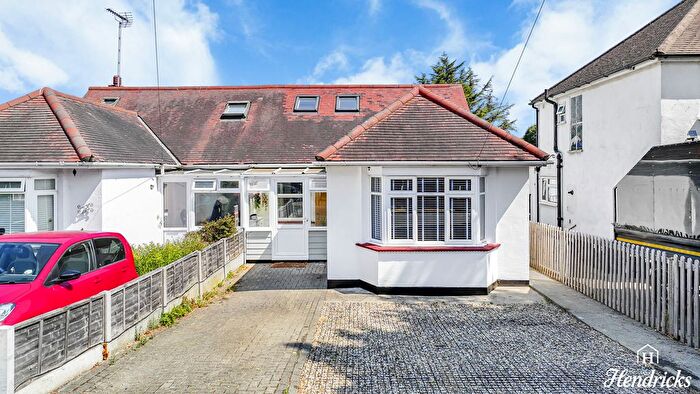
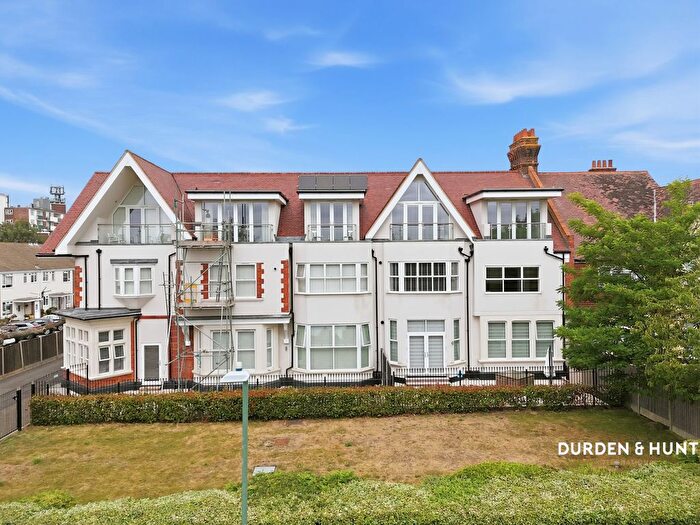
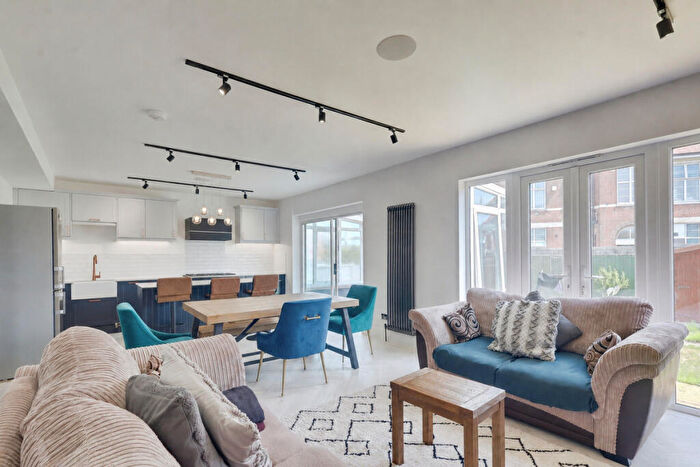
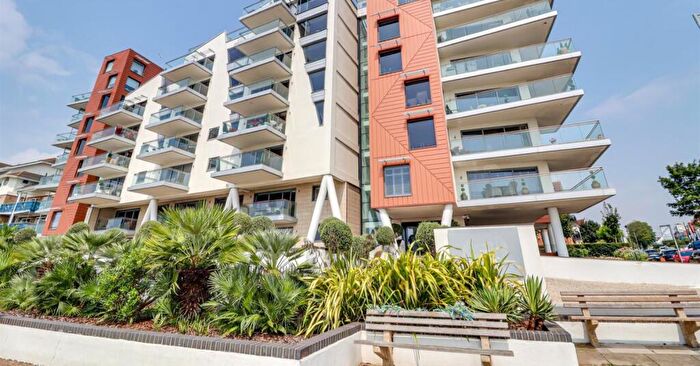
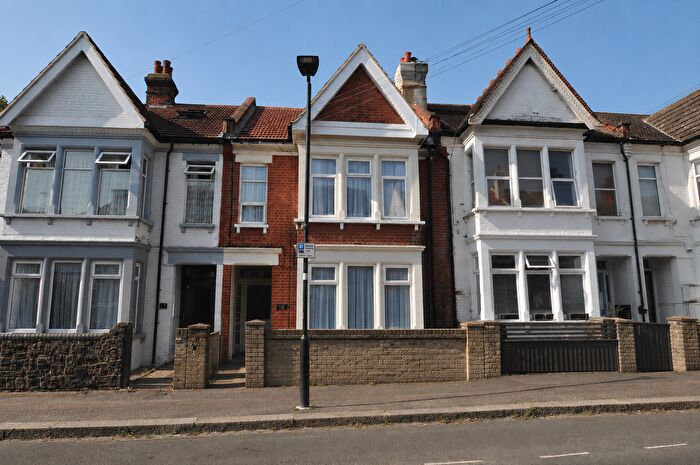
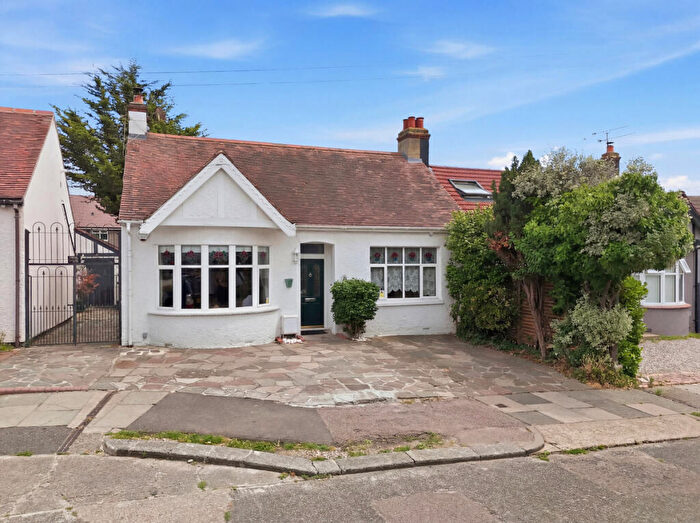
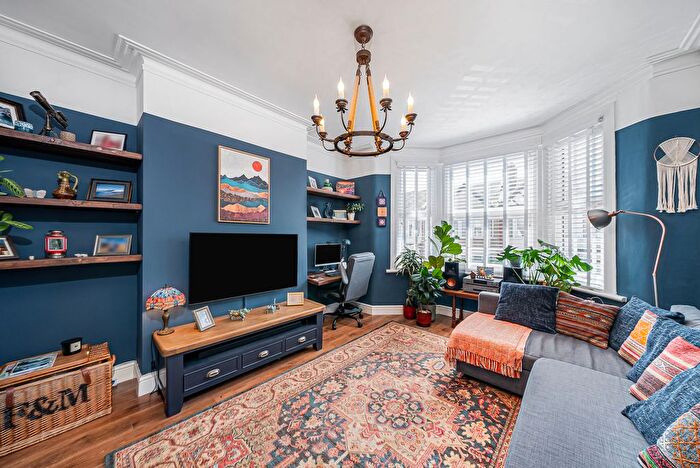
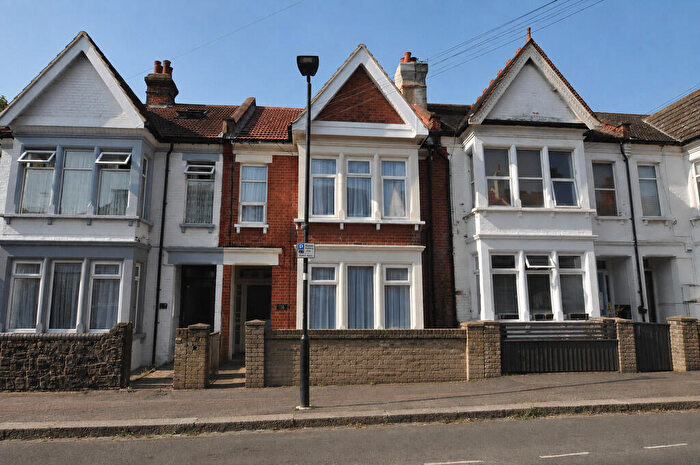
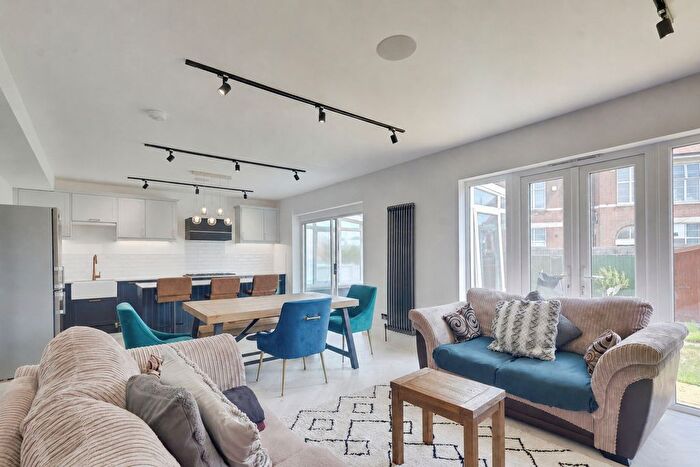
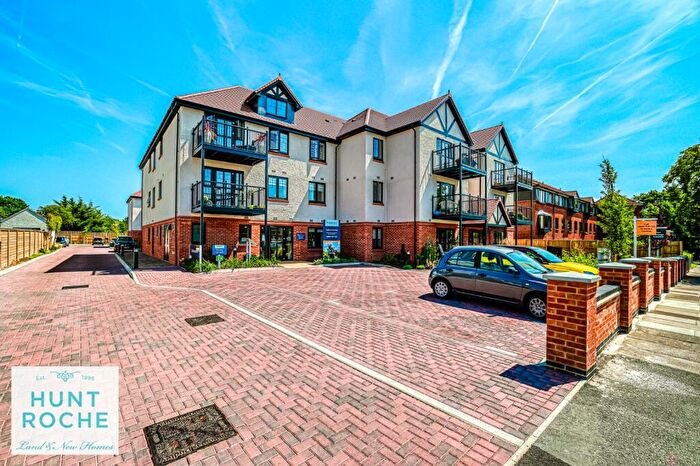
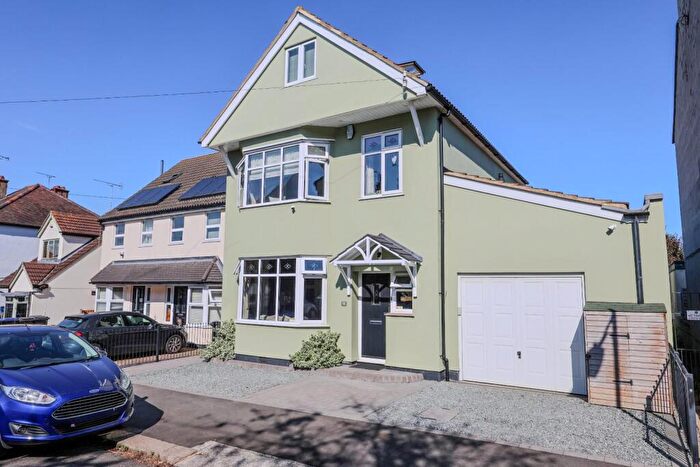
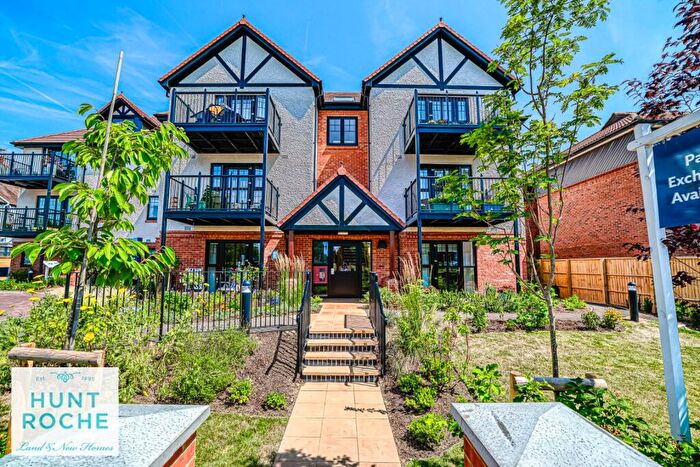
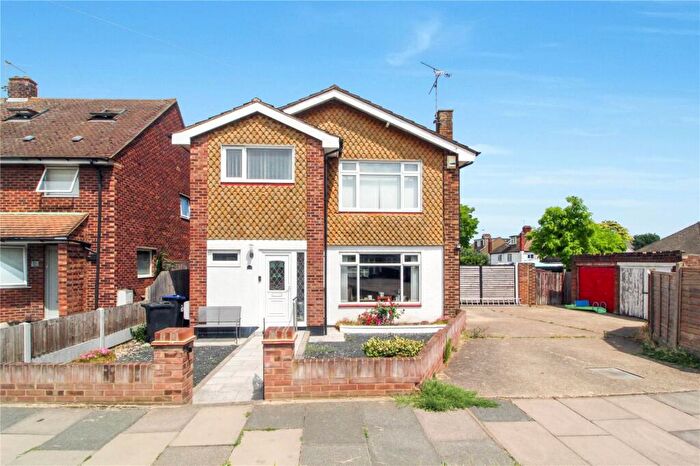
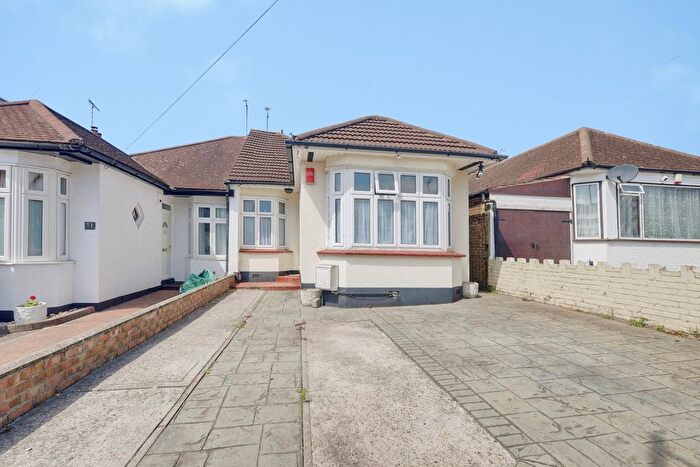
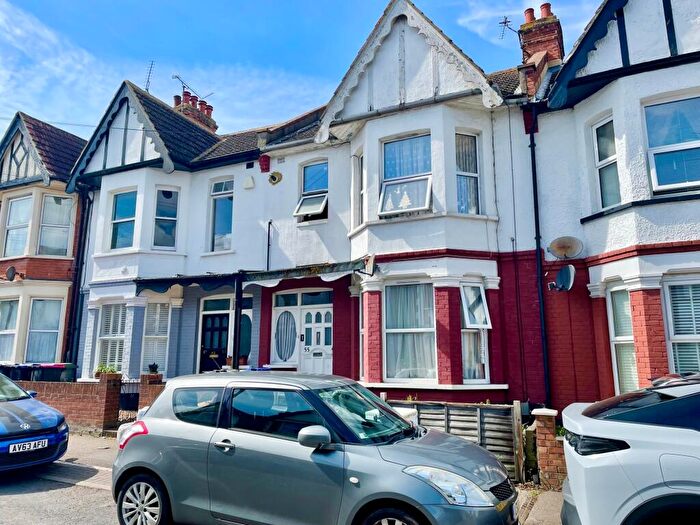
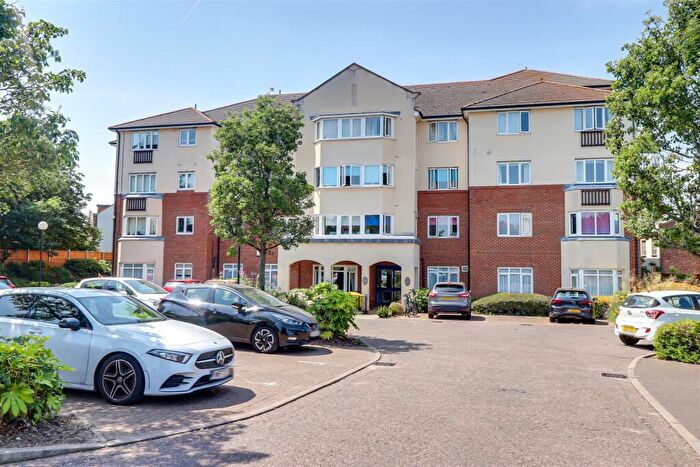
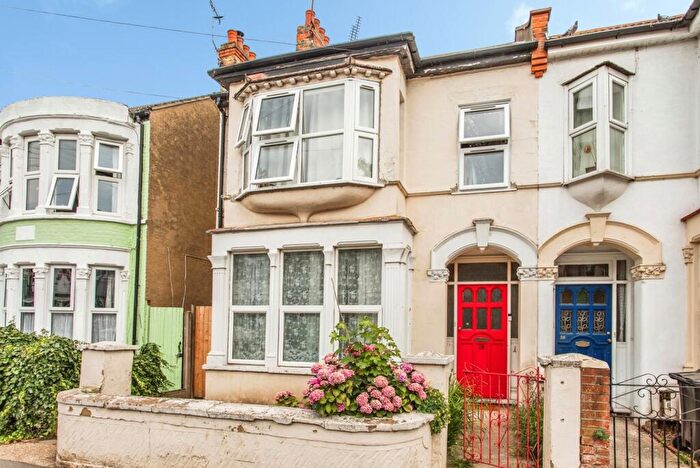
Houses and Flats for sale in SS0, Southend-on-Sea, Westcliff-on-Sea
There are 415 results. Property prices in SS0 range from £80k to £2M with an average price of £360k.
![]()
If you are looking to sell your house, let it out, or receive a property valuation, an expert can help you.
Click the button below to get started.

Frequently Asked Questions about SS0
What is the average price for a property for sale in SS0?
The average price for a property for sale in SS0 is £327,108. There are 415 property listings for sale in SS0.
Which areas are included in the SS0 postcode district?
The main areas within SS0 include Southend-on-Sea and Westcliff-on-Sea.
What are the most common property types in SS0?
The most common property types in SS0 are Flats, Terraced Houses, Semi Detached Houses and Detached Houses.
What has been the average sold property price in SS0 over the last three years?
Flats in SS0 have an average sold price of £217,555, while Terraced Houses have an average of £328,341. Semi Detached Houses have an average of £428,154 and Detached Houses have an average of £661,162. The average sold property price in SS0 over the last three years is approximately £355,105.
Which train stations are available in SS0?
The train stations available in SS0 are Chalkwell Station and Westcliff Station..