
Properties for sale in SS1
Southend-on-Sea, Thorpe Bay
- Info
- Price Paid By Year
- Property Type Price
- Transport
House Prices in SS1
Properties in SS1 have an average house price of £374,775.00 and had 1133 Property Transactions within the last 3 years.
The most expensive property was sold for £2,050,000.00.
Property Price Paid in SS1 by Year
The average sold property price by year was:
| Year | Average Sold Price | Sold Properties |
|---|---|---|
| 2026 | £332,857.00 | 7 Properties |
| 2025 | £379,846.00 | 370 Properties |
| 2024 | £371,490.00 | 412 Properties |
| 2023 | £374,110.00 | 344 Properties |
| 2022 | £372,660.00 | 589 Properties |
| 2021 | £368,583.00 | 613 Properties |
| 2020 | £346,867.00 | 399 Properties |
| 2019 | £315,349.00 | 466 Properties |
| 2018 | £343,447.00 | 522 Properties |
| 2017 | £309,694.00 | 532 Properties |
| 2016 | £263,385.00 | 707 Properties |
| 2015 | £249,300.00 | 612 Properties |
| 2014 | £238,470.00 | 548 Properties |
| 2013 | £226,725.00 | 428 Properties |
| 2012 | £229,442.00 | 360 Properties |
| 2011 | £235,626.00 | 375 Properties |
| 2010 | £244,330.00 | 387 Properties |
| 2009 | £207,442.00 | 347 Properties |
| 2008 | £198,817.00 | 403 Properties |
| 2007 | £209,681.00 | 804 Properties |
| 2006 | £189,324.00 | 970 Properties |
| 2005 | £177,267.00 | 737 Properties |
| 2004 | £168,246.00 | 822 Properties |
| 2003 | £152,397.00 | 820 Properties |
| 2002 | £125,483.00 | 854 Properties |
| 2001 | £105,105.00 | 851 Properties |
| 2000 | £96,587.00 | 733 Properties |
| 1999 | £78,967.00 | 768 Properties |
| 1998 | £78,356.00 | 677 Properties |
| 1997 | £69,301.00 | 726 Properties |
| 1996 | £59,394.00 | 653 Properties |
| 1995 | £57,782.00 | 643 Properties |
Property Price per Property Type in SS1
Here you can find historic sold price data in order to help with your property search.
The average Property Paid Price for specific property types in the last three years are:
| Property Type | Average Sold Price | Sold Properties |
|---|---|---|
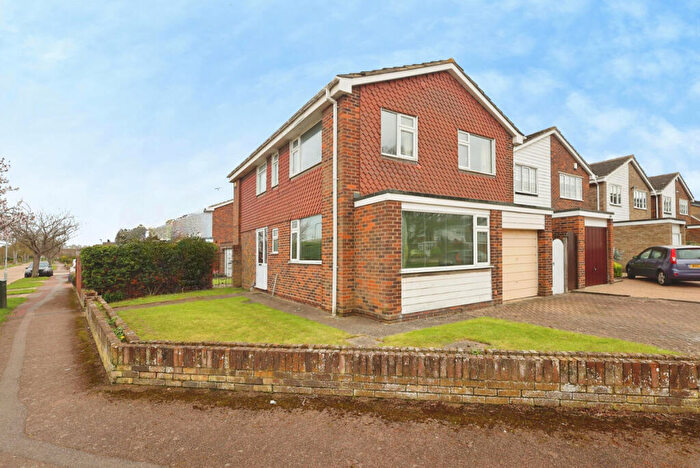
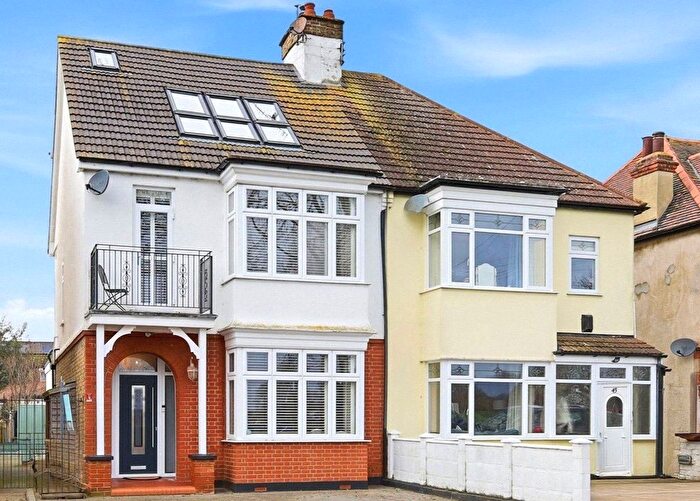
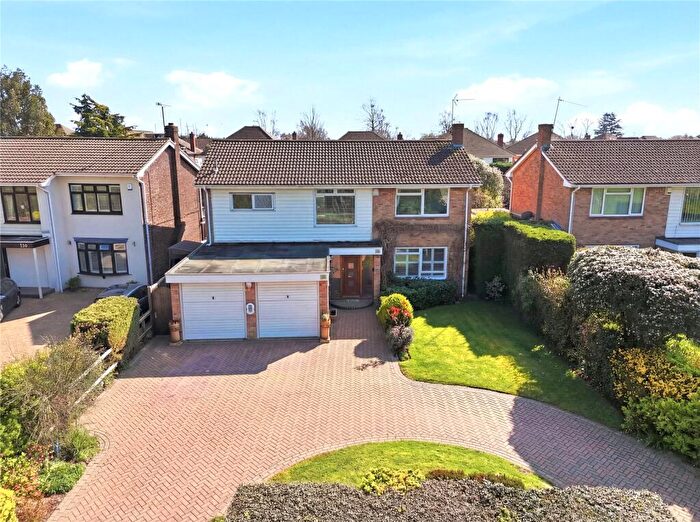
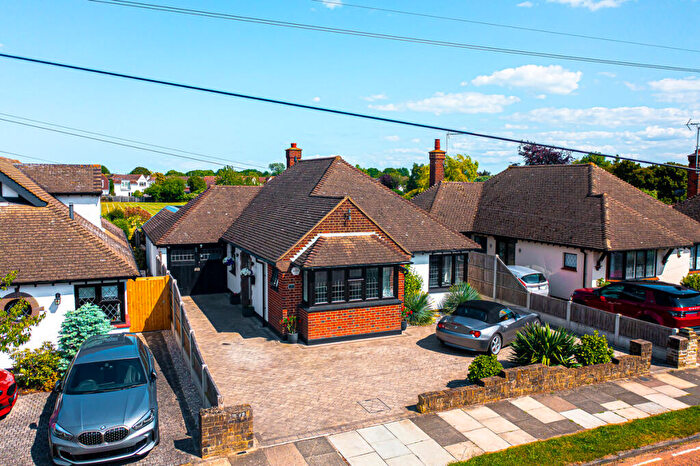
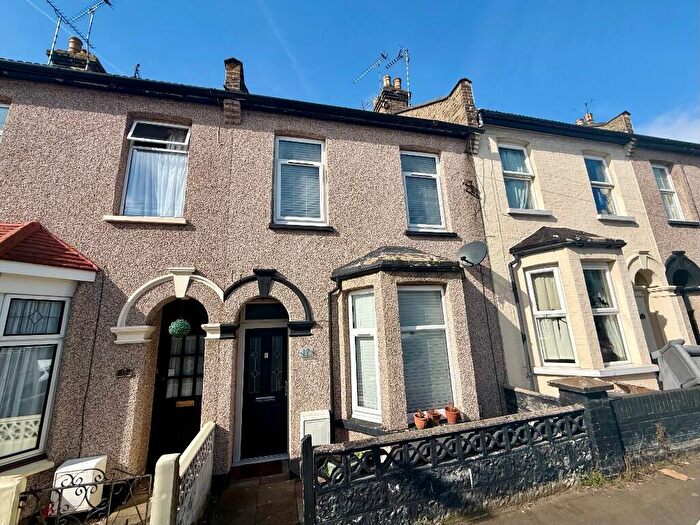
| Semi Detached House | £484,380.00 | 177 Semi Detached Houses |
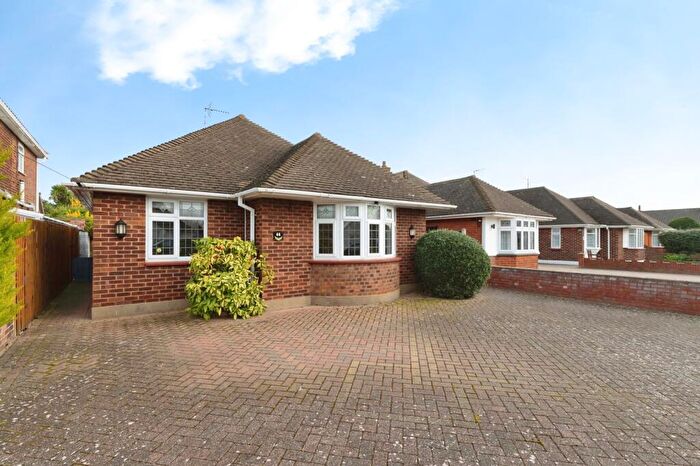
| Detached House | £741,713.00 | 222 Detached Houses |
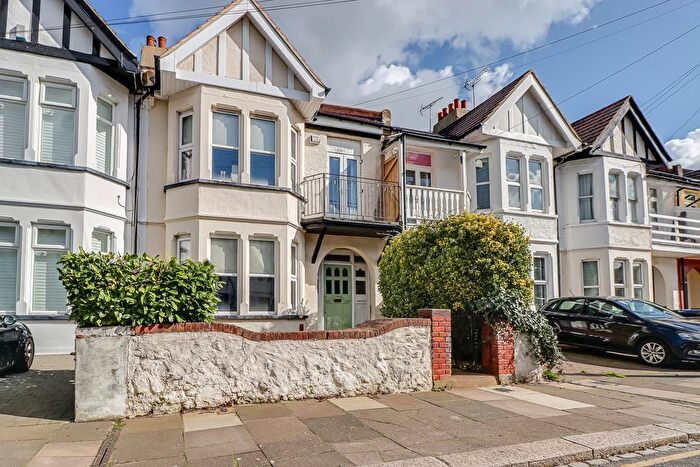
| Terraced House | £342,616.00 | 190 Terraced Houses |
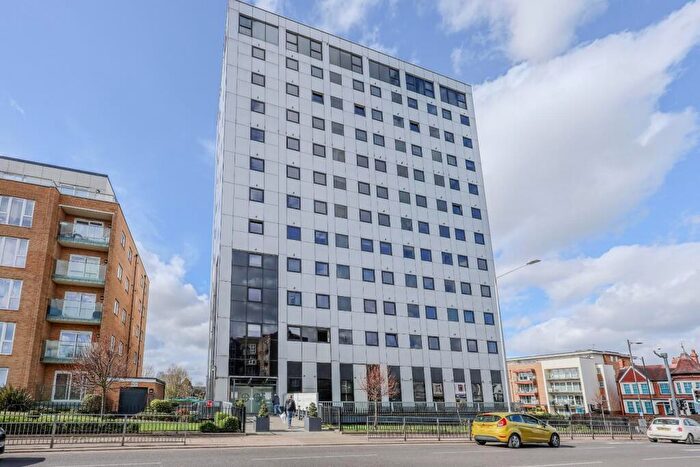
| Flat | £200,603.00 | 544 Flats |

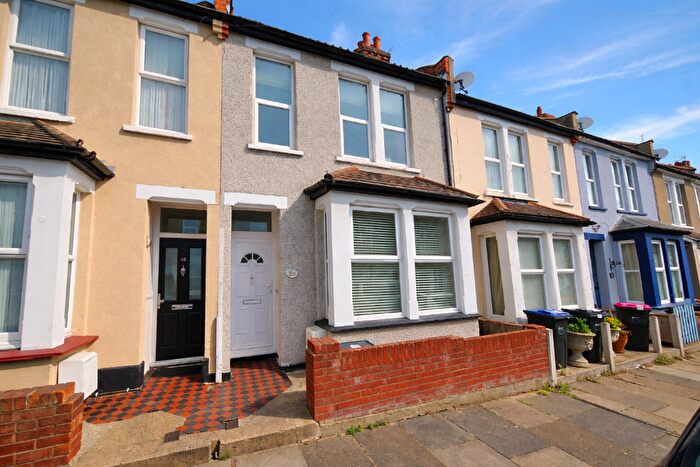
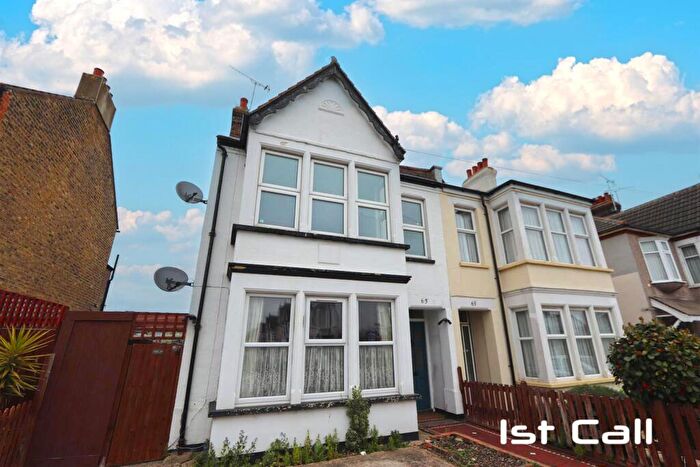
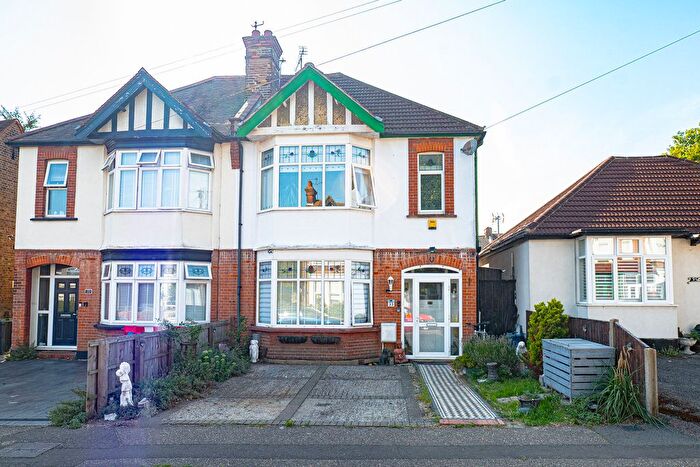
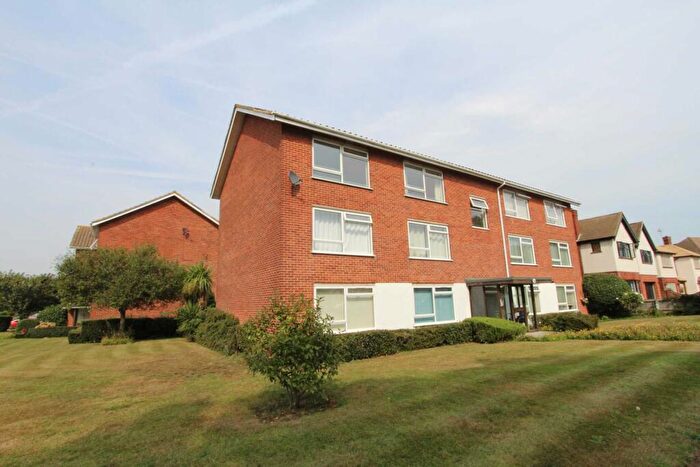
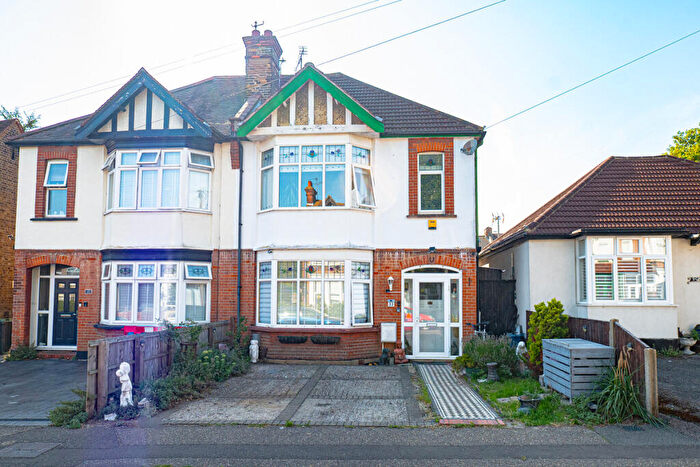
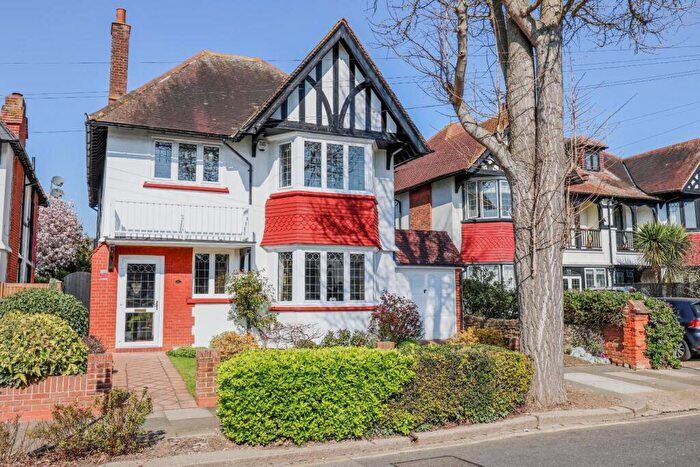
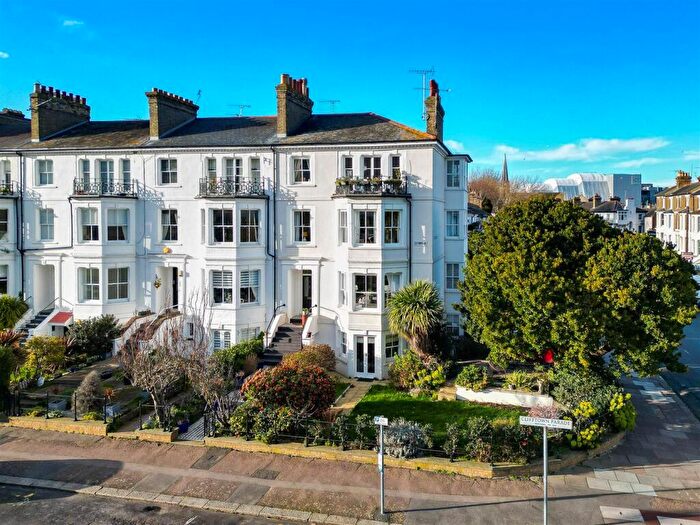
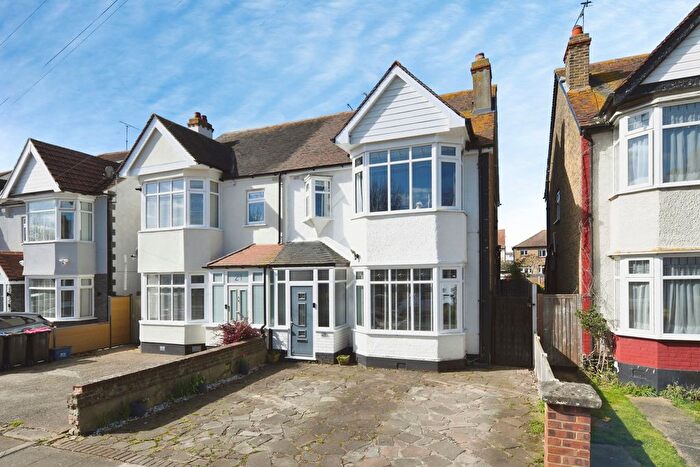
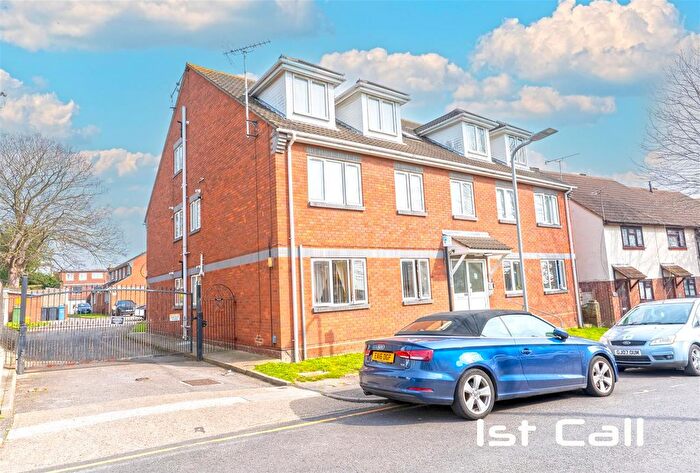
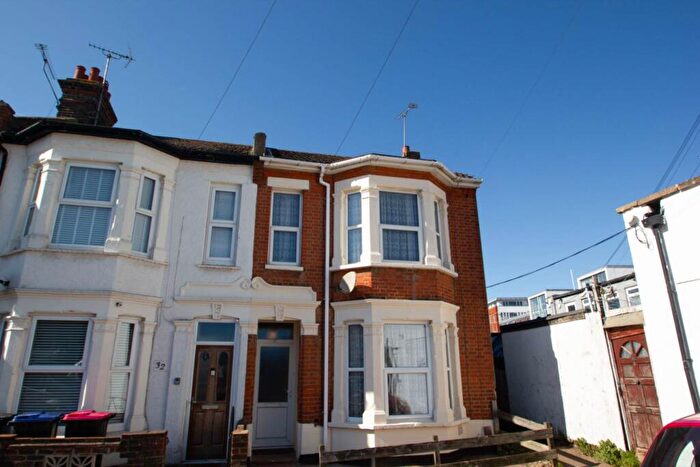
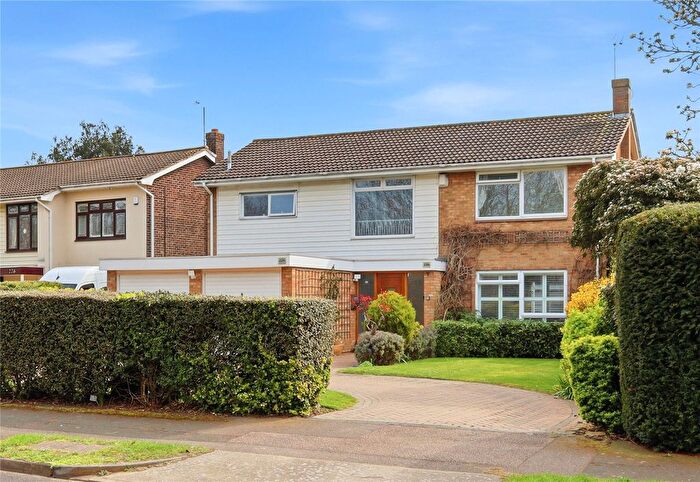
Houses and Flats for sale in SS1, Southend-on-Sea, Thorpe Bay
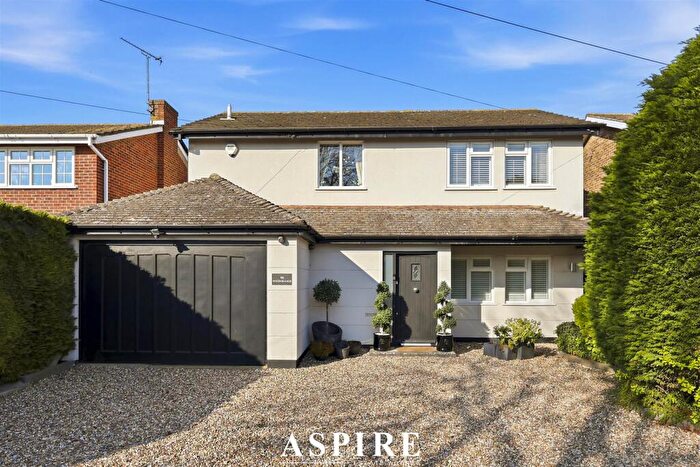
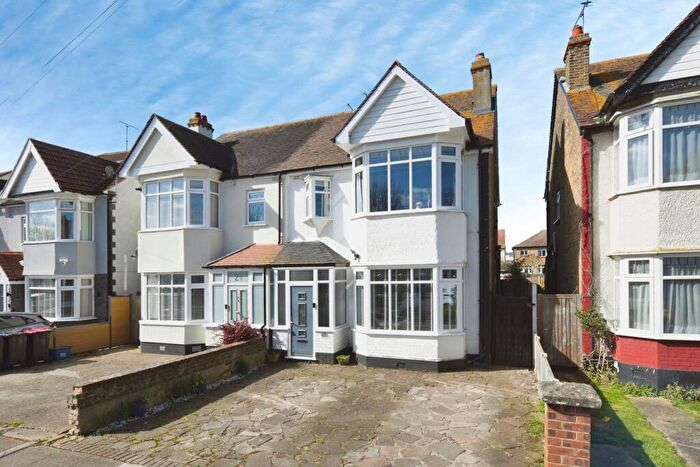
![]()
If you are looking to sell your house, let it out, or receive a property valuation, an expert can help you.
Click the button below to get started.


Frequently Asked Questions about SS1
What is the average price for a property for sale in SS1?
The average price for a property for sale in SS1 is £374,775. There are 352 property listings for sale in SS1.
Which areas are included in the SS1 postcode district?
The main areas within SS1 include Southend-on-Sea and Thorpe Bay.
What are the most common property types in SS1?
The most common property types in SS1 are Flats, Detached Houses, Terraced Houses and Semi Detached Houses.
What has been the average sold property price in SS1 over the last three years?
Flats in SS1 have an average sold price of £200,603, while Detached Houses have an average of £741,713. Terraced Houses have an average of £342,616 and Semi Detached Houses have an average of £484,380. The average sold property price in SS1 over the last three years is approximately £361,398.
Which train stations are available in SS1?
The train stations available in SS1 are Basildon Station, Battlesbridge Station, Laindon Station, Pitsea Station, Southend Central Station, Southend East Station, Stanford-Le-Hope Station, Thorpe Bay Station and Wickford Station..