
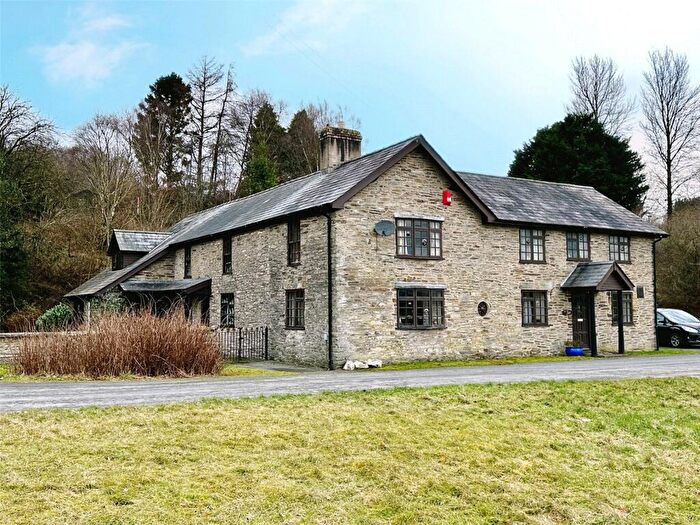
Properties for sale in SY16
Newtown
- Info
- Price Paid By Year
- Property Type Price
- Transport
House Prices in SY16
Properties in SY16 have an average house price of £225,694.00 and had 543 Property Transactions within the last 3 years.
The most expensive property was sold for £1,200,000.00.
Property Price Paid in SY16 by Year
The average sold property price by year was:
| Year | Average Sold Price | Sold Properties |
|---|---|---|
| 2026 | £183,000.00 | 4 Properties |
| 2025 | £248,102.00 | 168 Properties |
| 2024 | £216,374.00 | 196 Properties |
| 2023 | £215,598.00 | 175 Properties |
| 2022 | £213,927.00 | 199 Properties |
| 2021 | £203,014.00 | 259 Properties |
| 2020 | £188,982.00 | 184 Properties |
| 2019 | £174,038.00 | 211 Properties |
| 2018 | £167,364.00 | 200 Properties |
| 2017 | £155,538.00 | 213 Properties |
| 2016 | £158,874.00 | 196 Properties |
| 2015 | £155,974.00 | 210 Properties |
| 2014 | £148,227.00 | 209 Properties |
| 2013 | £146,959.00 | 151 Properties |
| 2012 | £140,174.00 | 138 Properties |
| 2011 | £140,139.00 | 142 Properties |
| 2010 | £149,131.00 | 144 Properties |
| 2009 | £137,209.00 | 150 Properties |
| 2008 | £138,314.00 | 142 Properties |
| 2007 | £167,131.00 | 248 Properties |
| 2006 | £145,353.00 | 288 Properties |
| 2005 | £137,845.00 | 206 Properties |
| 2004 | £125,698.00 | 266 Properties |
| 2003 | £100,923.00 | 311 Properties |
| 2002 | £77,505.00 | 247 Properties |
| 2001 | £64,752.00 | 257 Properties |
| 2000 | £61,919.00 | 236 Properties |
| 1999 | £56,589.00 | 195 Properties |
| 1998 | £53,007.00 | 194 Properties |
| 1997 | £54,002.00 | 228 Properties |
| 1996 | £55,401.00 | 185 Properties |
| 1995 | £52,848.00 | 170 Properties |
Property Price per Property Type in SY16
Here you can find historic sold price data in order to help with your property search.
The average Property Paid Price for specific property types in the last three years are:
| Property Type | Average Sold Price | Sold Properties |
|---|---|---|
| Semi Detached House | £184,400.00 | 127 Semi Detached Houses |
| Detached House | £301,122.00 | 248 Detached Houses |
| Terraced House | £149,416.00 | 151 Terraced Houses |
| Flat | £111,350.00 | 17 Flats |

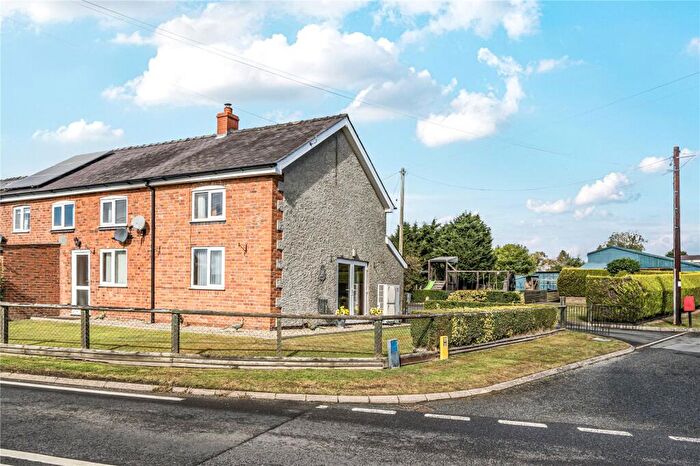
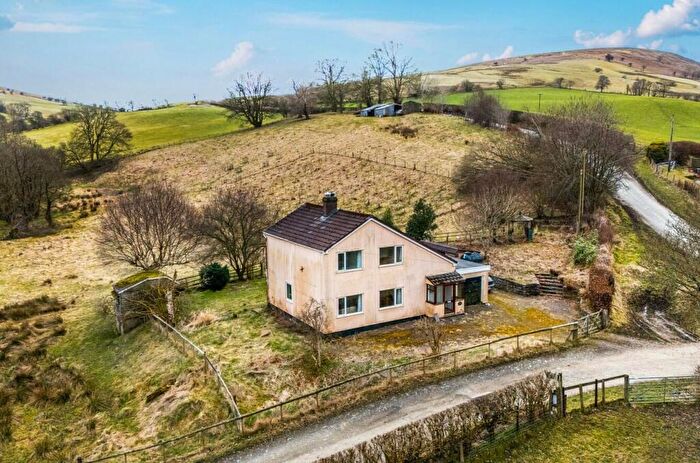
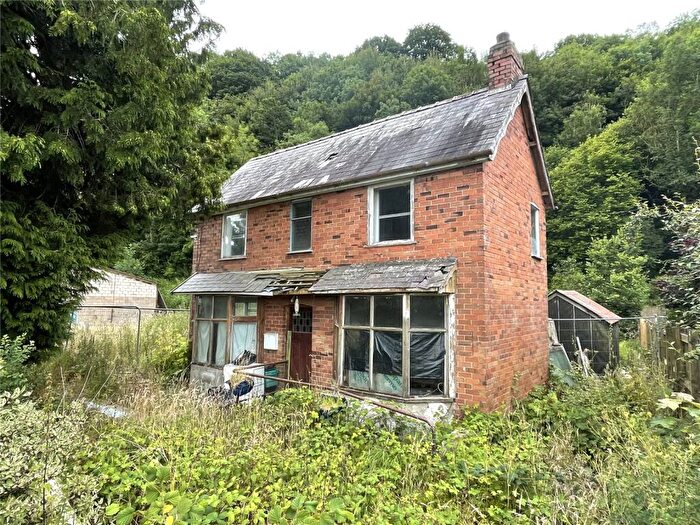
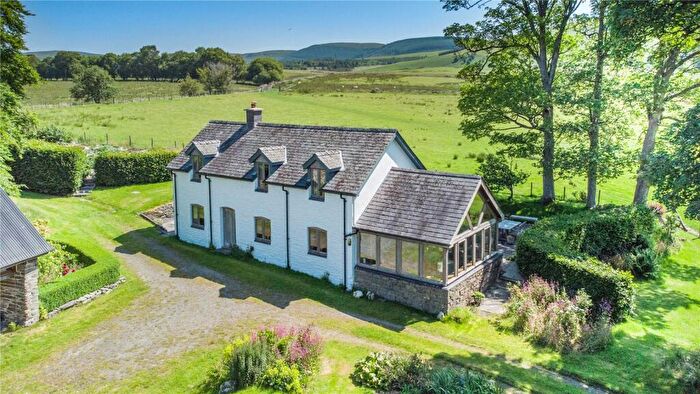
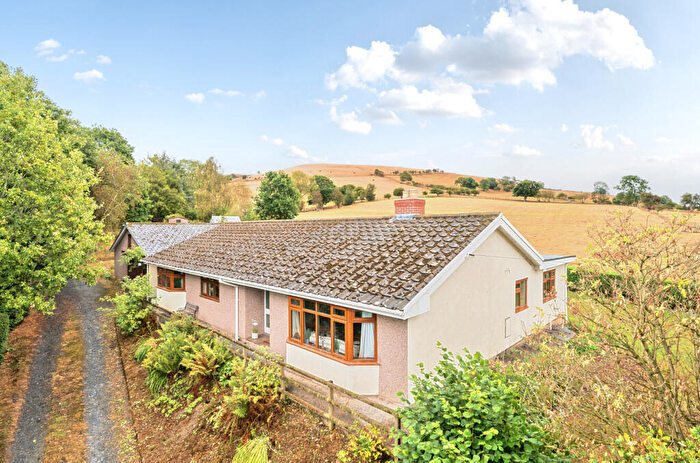
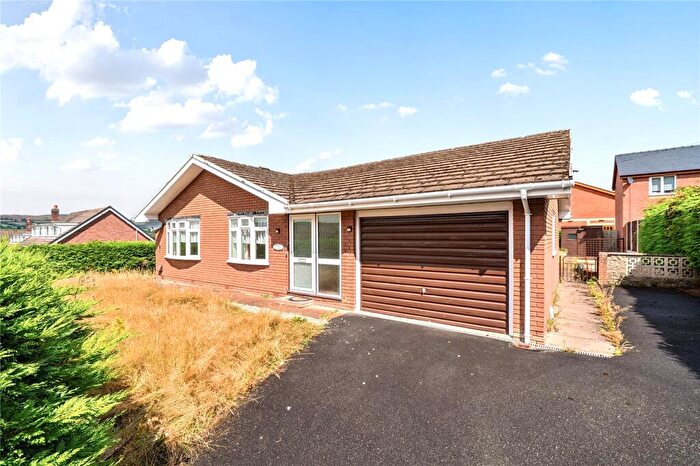
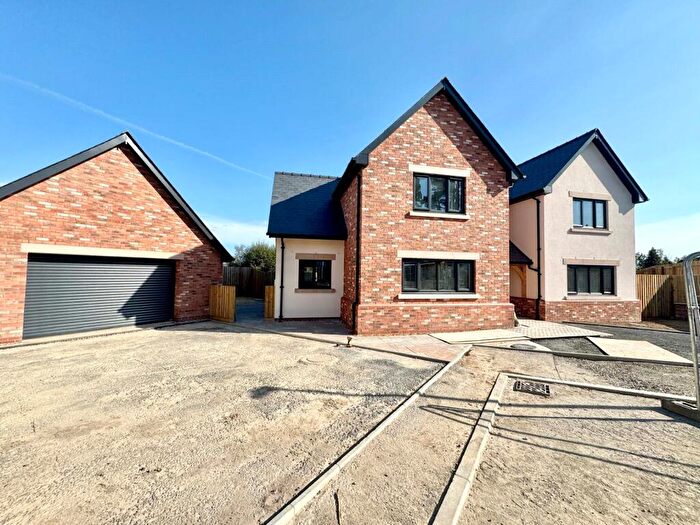
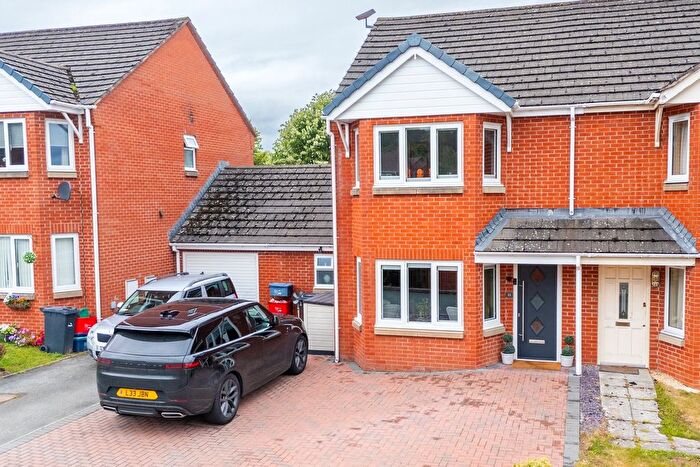
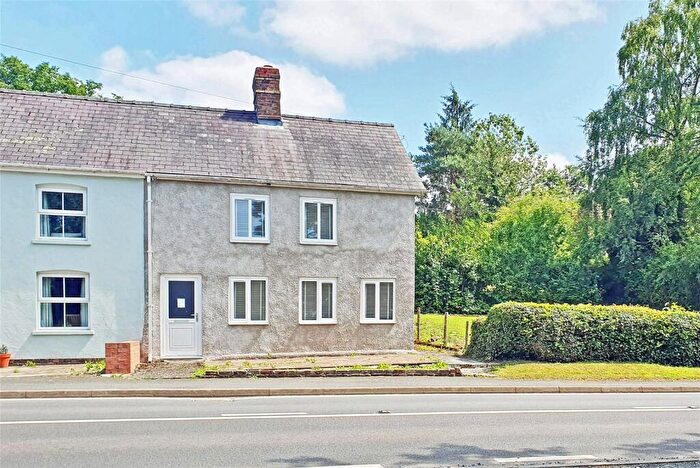
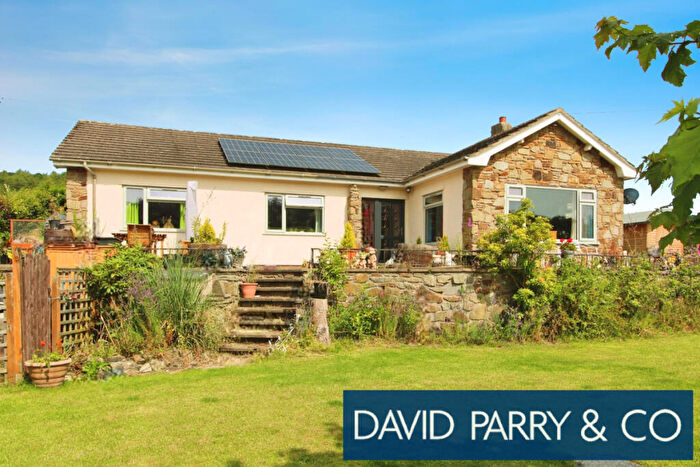
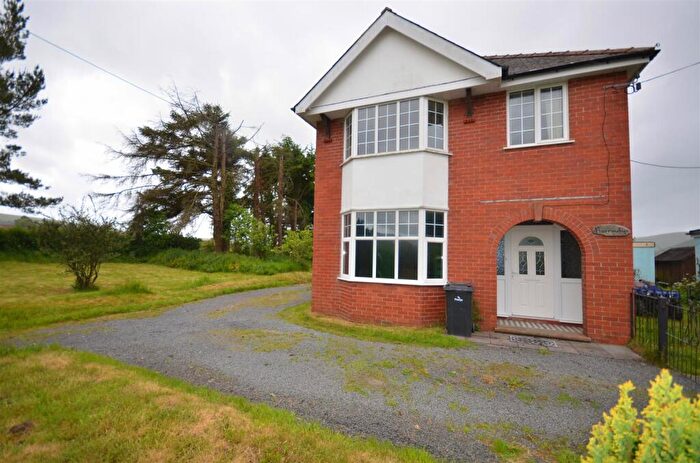
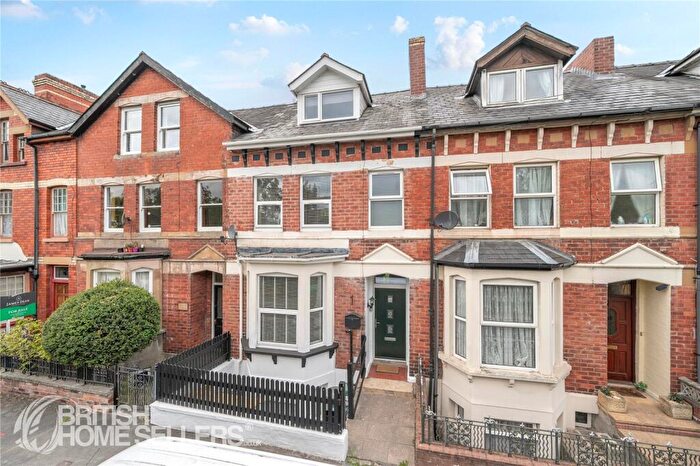
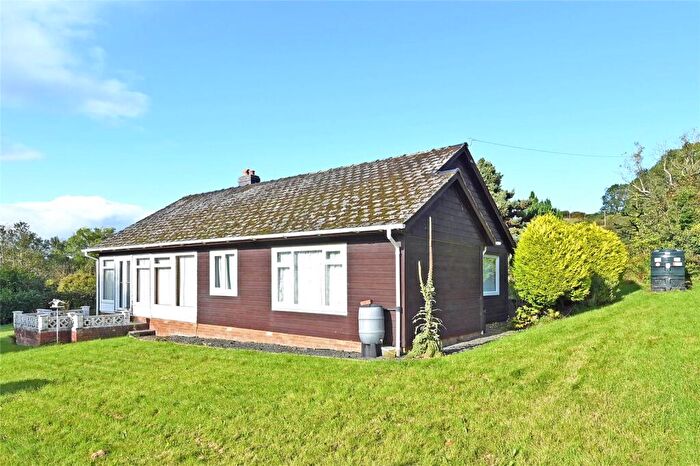
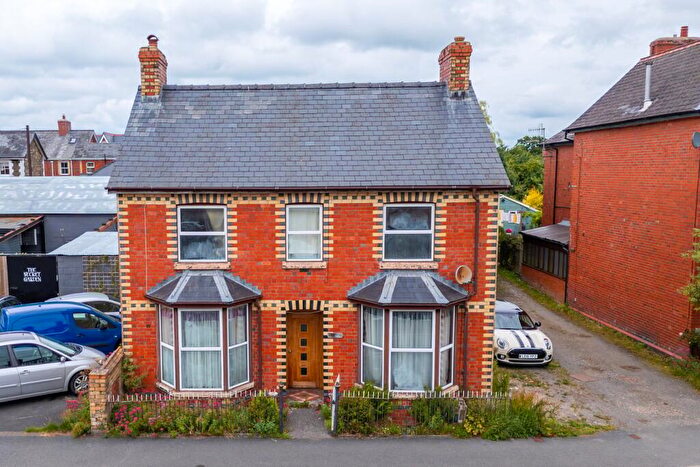
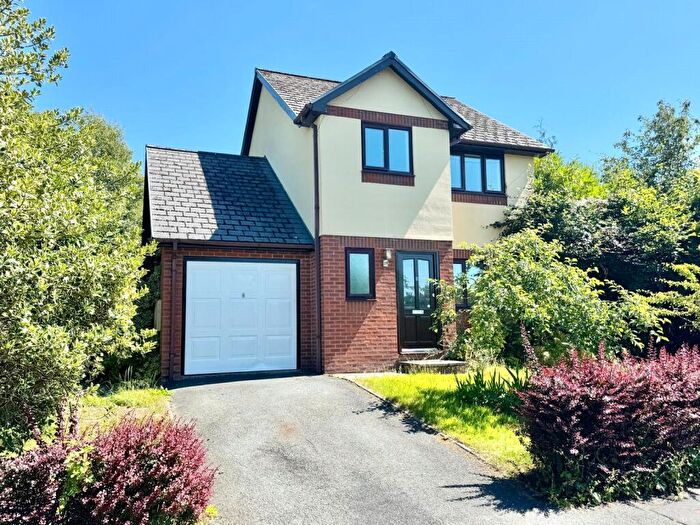
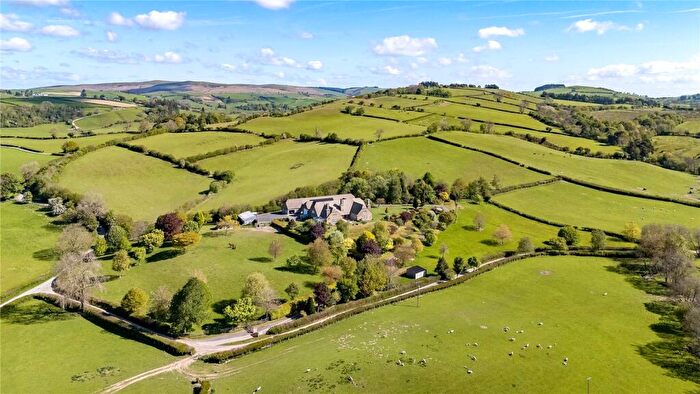
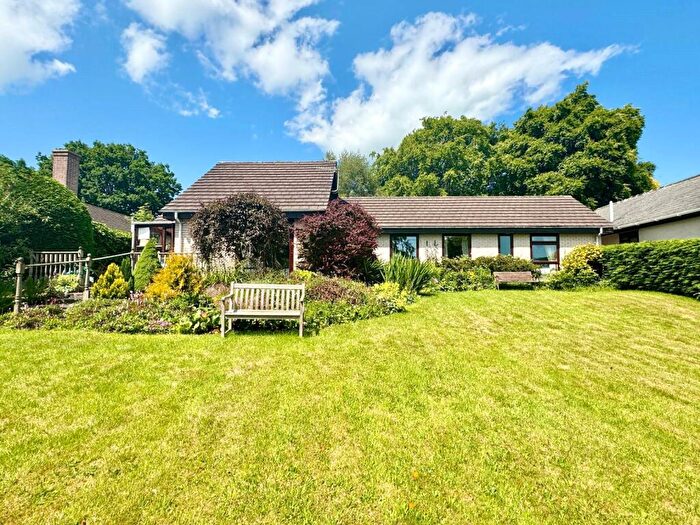
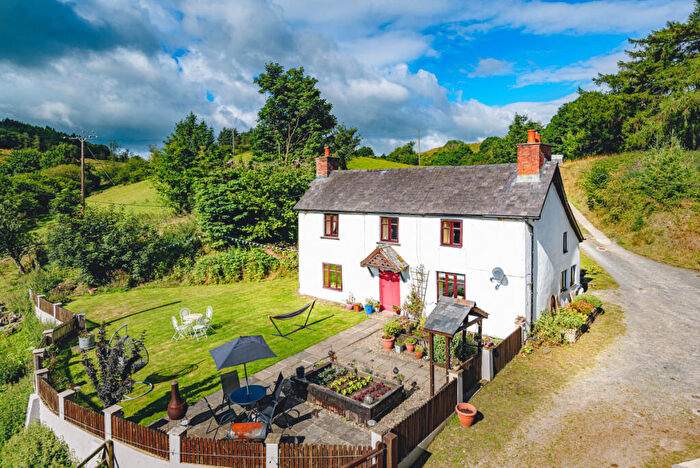
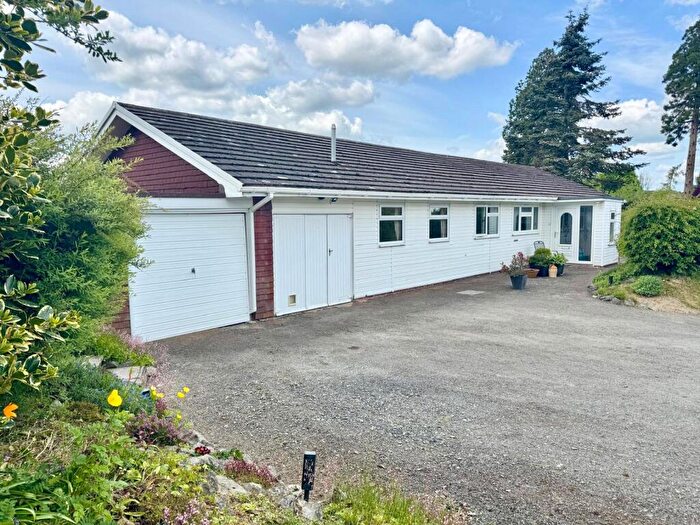
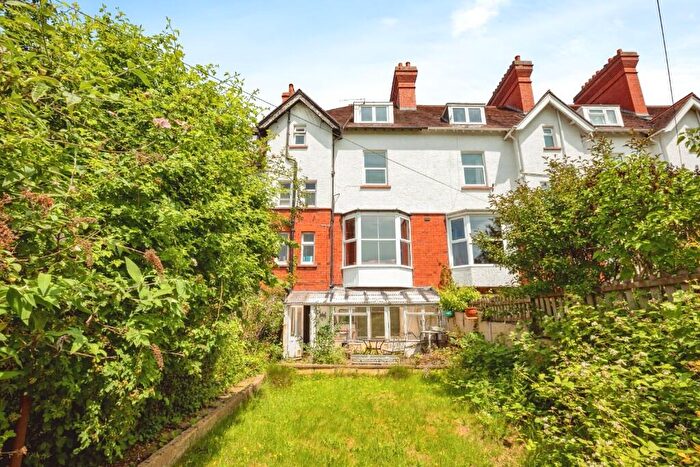
Properties for sale near SY16

![]()
If you are looking to sell your house, let it out, or receive a property valuation, an expert can help you.
Click the button below to get started.

Frequently Asked Questions about SY16
What is the average price for a property for sale in SY16?
The average price for a property for sale in SY16 is £225,694. There are 20 property listings for sale in SY16.
Which areas are included in the SY16 postcode district?
The main area within SY16 is Newtown.
What are the most common property types in SY16?
The most common property types in SY16 are Detached Houses, Terraced Houses, Semi Detached Houses and Flats.
What has been the average sold property price in SY16 over the last three years?
Detached Houses in SY16 have an average sold price of £301,122, while Terraced Houses have an average of £149,416. Semi Detached Houses have an average of £184,400 and Flats have an average of £111,350. The average sold property price in SY16 over the last three years is approximately £215,825.
Which train stations are available in SY16?
The train station available in SY16 is Newtown Station..