
Properties for sale in SY
Shrewsbury
- Info
- Price Paid By Year
- Property Type Price
House Prices in SY
Properties in SY have an average house price of £293,639 and had 13377 Property Transactions within the last 3 years.
The most expensive property was sold for £3,300,000.
Property Price Paid in SY by Year
The average sold property price by year was:
| Year | Average Sold Price | Sold Properties |
|---|---|---|
| 2026 | £299,242.00 | 314 Properties |
| 2025 | £298,558.00 | 4,198 Properties |
| 2024 | £291,958.00 | 4,601 Properties |
| 2023 | £290,196.00 | 4,264 Properties |
| 2022 | £292,795.00 | 5,126 Properties |
| 2021 | £278,507.00 | 6,815 Properties |
| 2020 | £252,447.00 | 5,037 Properties |
| 2019 | £238,341.00 | 5,888 Properties |
| 2018 | £231,947.00 | 5,963 Properties |
| 2017 | £225,072.00 | 6,053 Properties |
| 2016 | £218,700.00 | 5,707 Properties |
| 2015 | £207,664.00 | 5,588 Properties |
| 2014 | £200,236.00 | 5,178 Properties |
| 2013 | £195,417.00 | 4,284 Properties |
| 2012 | £191,841.00 | 3,563 Properties |
| 2011 | £196,495.00 | 3,382 Properties |
| 2010 | £201,565.00 | 3,705 Properties |
| 2009 | £191,505.00 | 3,618 Properties |
| 2008 | £199,250.00 | 3,190 Properties |
| 2007 | £206,809.00 | 5,908 Properties |
| 2006 | £192,285.00 | 6,920 Properties |
| 2005 | £180,246.00 | 5,239 Properties |
| 2004 | £171,096.00 | 6,242 Properties |
| 2003 | £141,510.00 | 6,630 Properties |
| 2002 | £117,157.00 | 7,078 Properties |
| 2001 | £97,189.00 | 6,756 Properties |
| 2000 | £86,183.00 | 6,189 Properties |
| 1999 | £77,581.00 | 6,633 Properties |
| 1998 | £72,492.00 | 5,580 Properties |
| 1997 | £67,829.00 | 5,935 Properties |
| 1996 | £63,682.00 | 5,493 Properties |
| 1995 | £61,287.00 | 4,348 Properties |
Property Price per Property Type in SY
Here you can find historic sold price data in order to help with your property search.
The average Property Paid Price for specific property types in the last three years are:
| Property Type | Average Sold Price | Sold Properties |
|---|---|---|
| Semi Detached House | £248,735.00 | 3,771 Semi Detached Houses |
| Terraced House | £205,967.00 | 3,162 Terraced Houses |
| Detached House | £397,729.00 | 5,486 Detached Houses |
| Flat | £163,692.00 | 958 Flats |
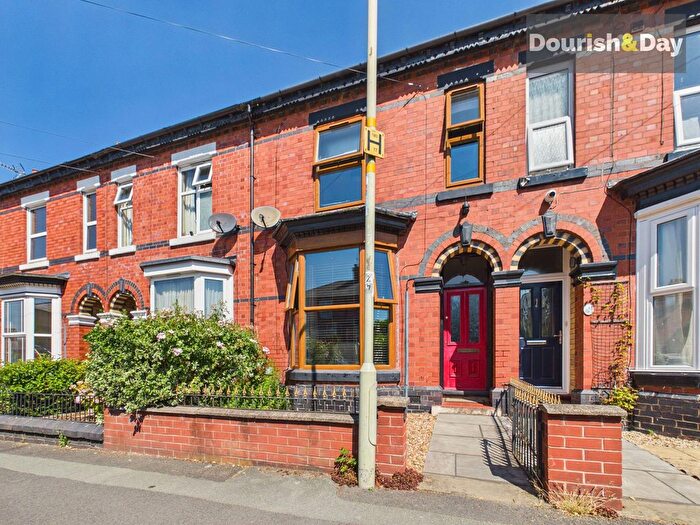
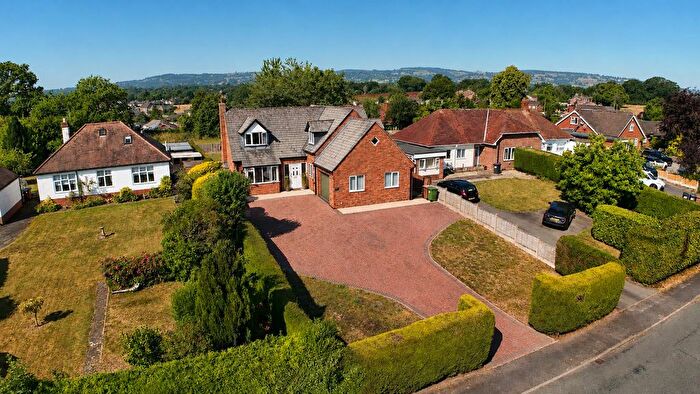
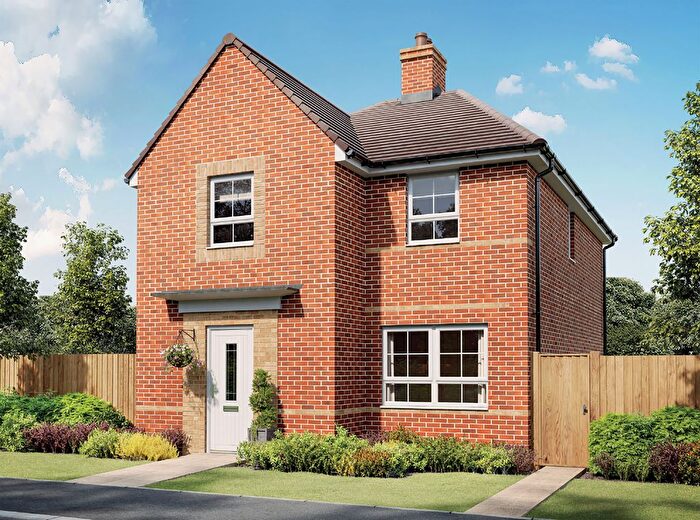
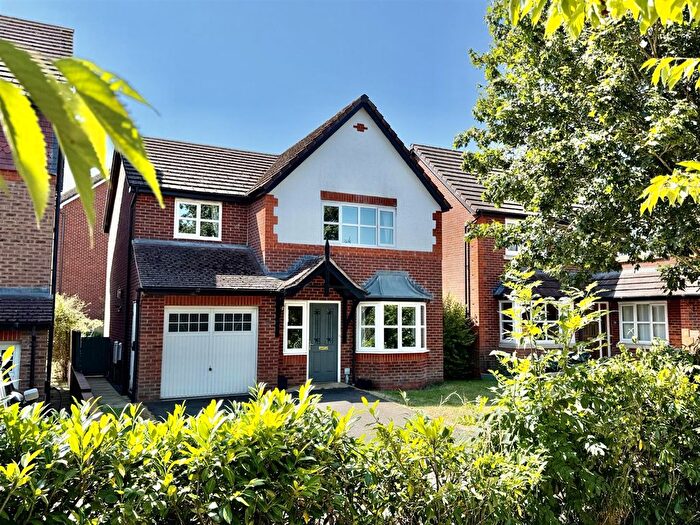
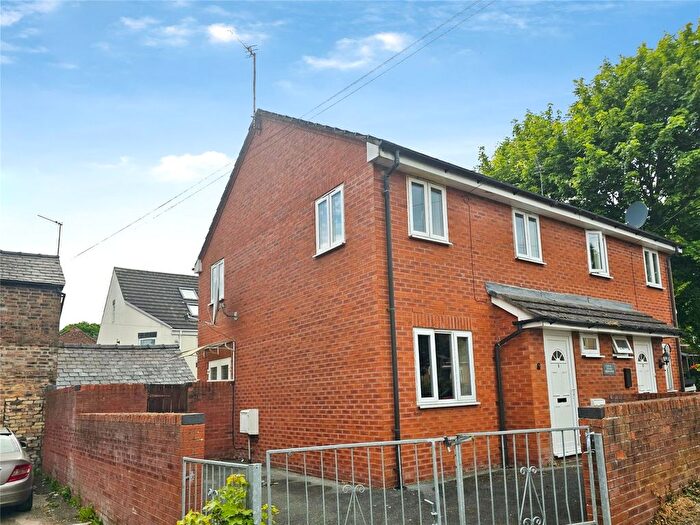
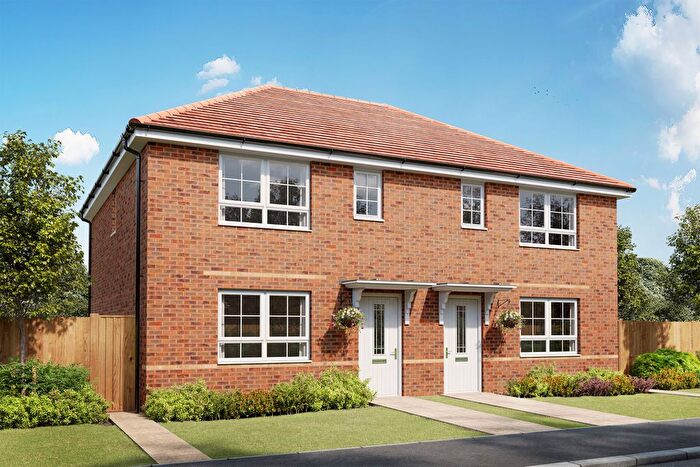
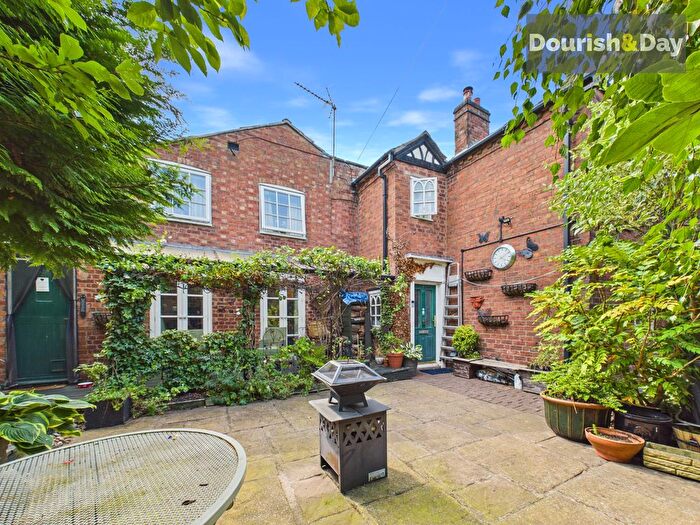
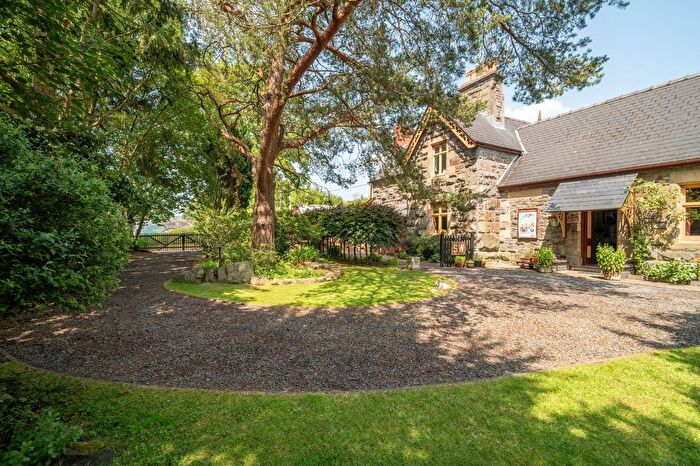
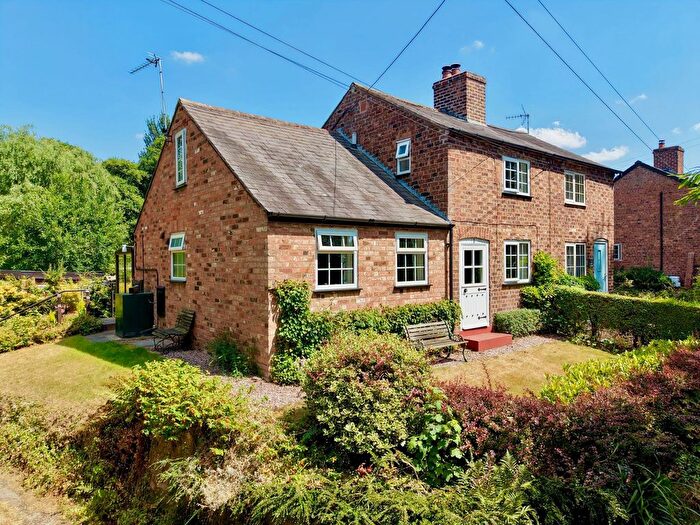
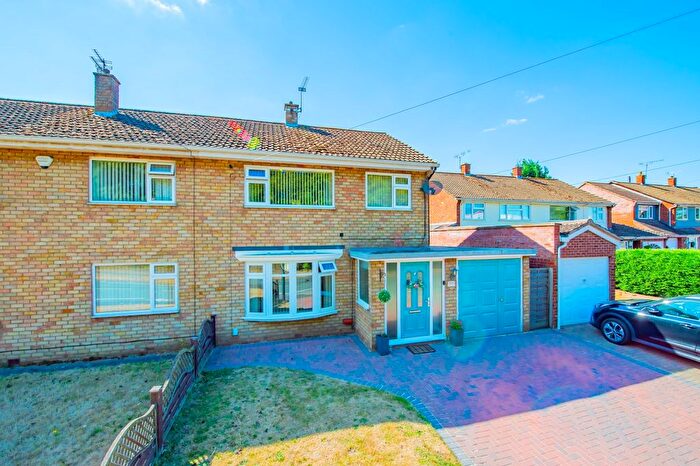
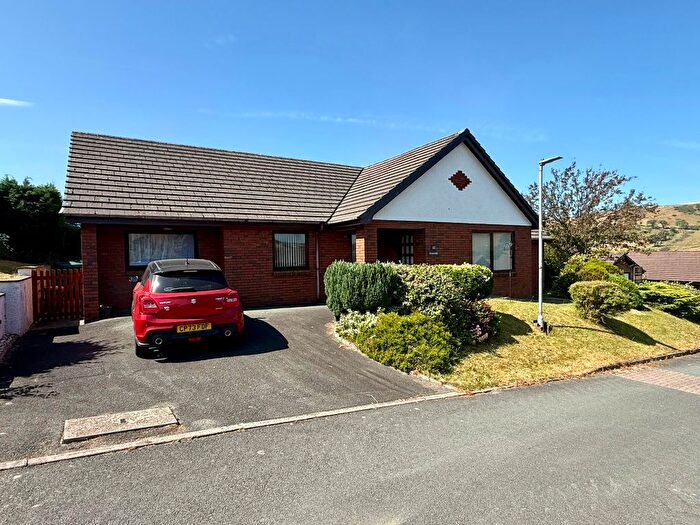
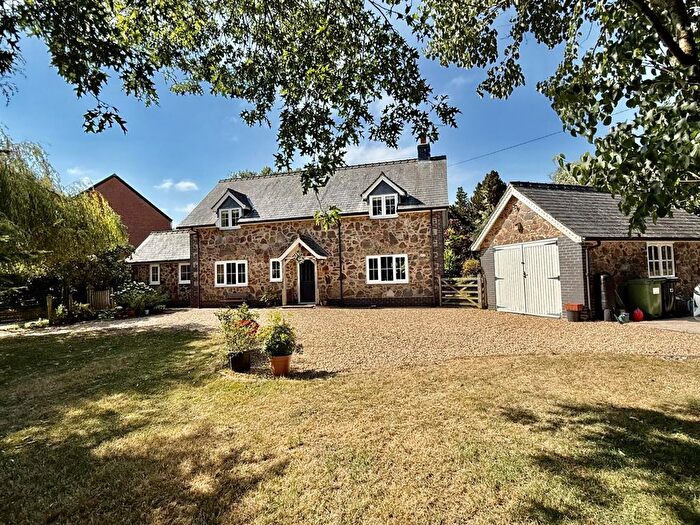
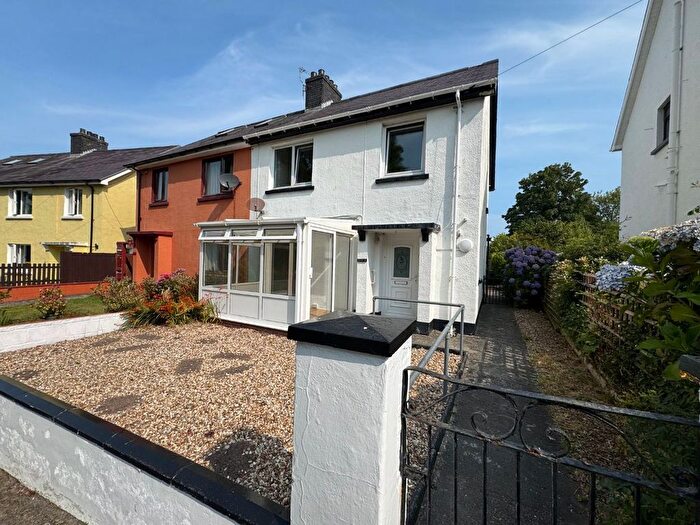
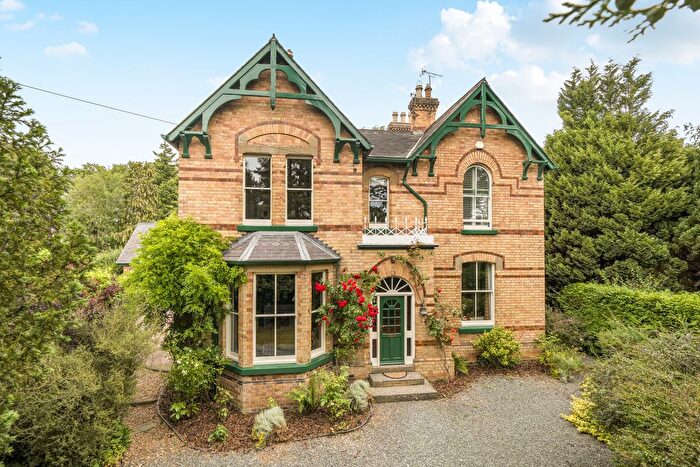
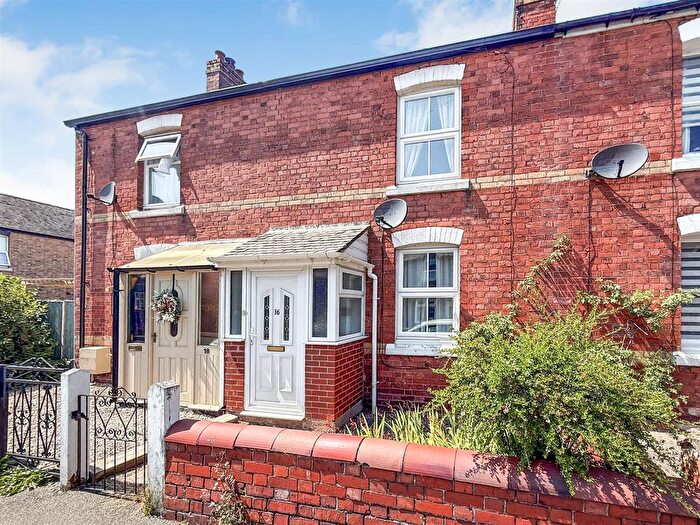
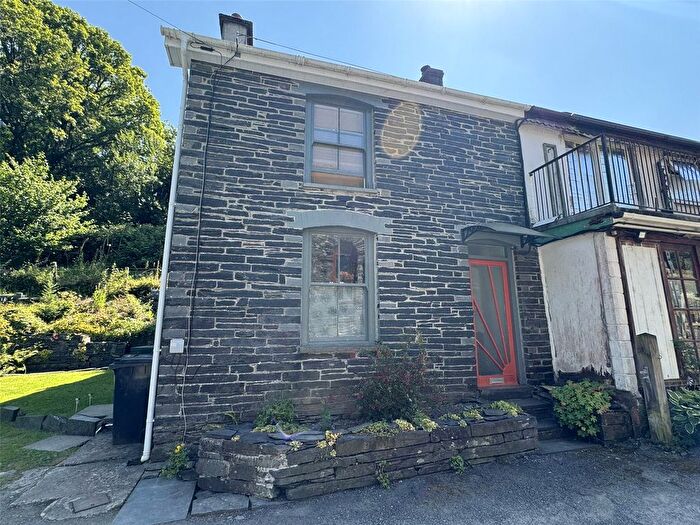
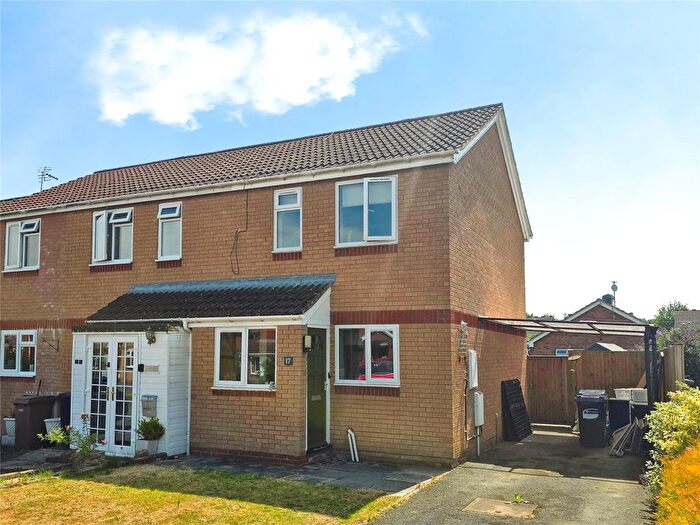
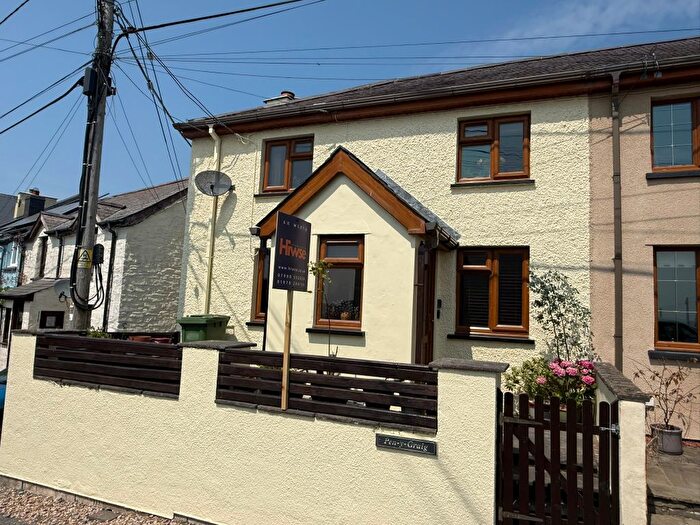
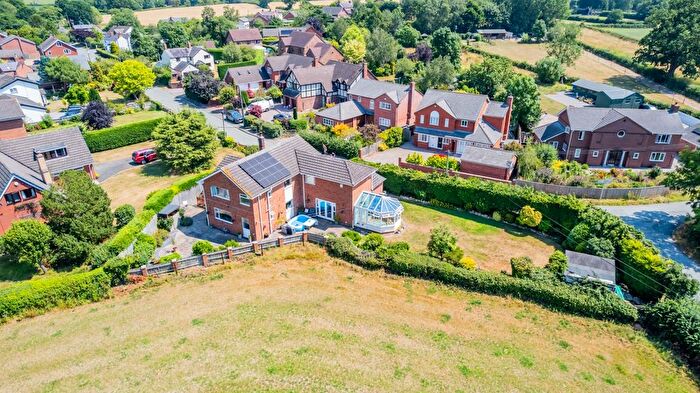
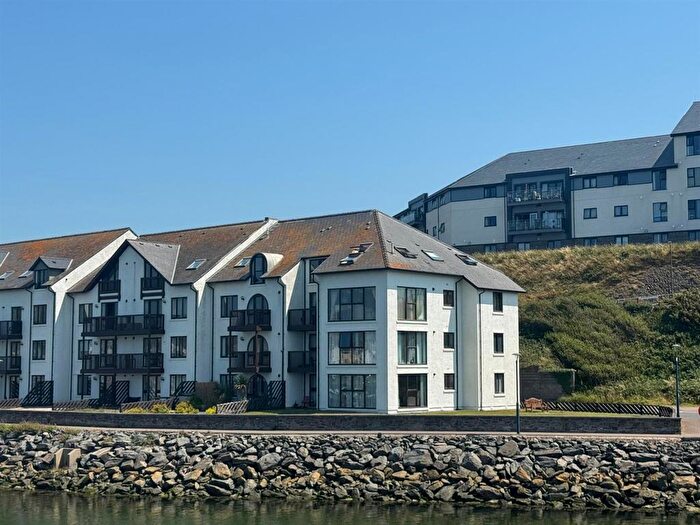
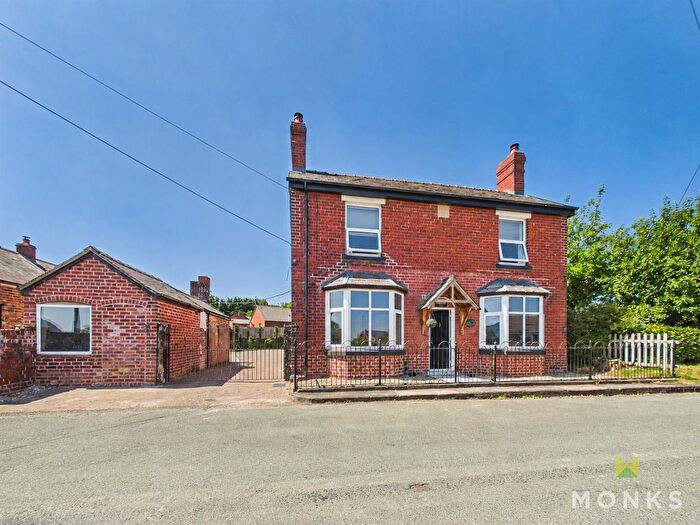
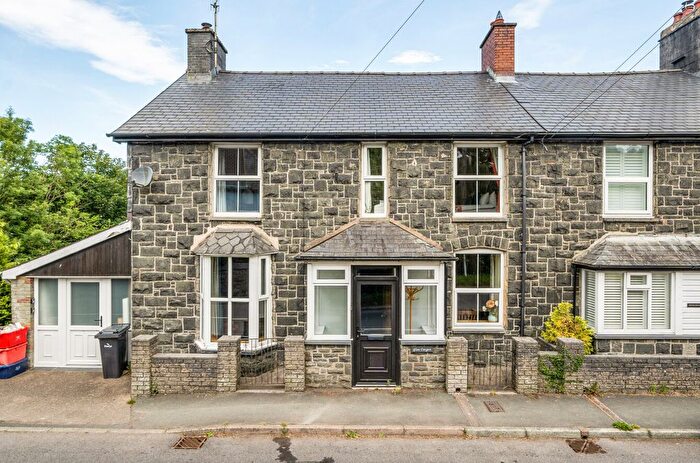
Houses and Flats for sale in SY, Shrewsbury
There are 115 results. Property prices in SY range from £68k to £3.75M with an average price of £403k.
![]()
If you are looking to sell your house, let it out, or receive a property valuation, an expert can help you.
Click the button below to get started.
Postcode districts in SY, Shrewsbury
Navigate through our locations to find the location of your next house in SY, Shrewsbury, England for sale or to rent.
Transport in SY, Shrewsbury
Please see below transportation links in this area:

Frequently asked questions about SY
What is the average price for a property for sale in SY?
The average price for a property for sale in SY is £293,639. This amount is 18% lower than the average price in England. There are 115 property listings for sale in SY.
What locations have the most expensive properties for sale in SY?
The locations with the most expensive properties for sale in SY are SY14 at an average of £428,458, SY6 at an average of £414,093 and SY7 at an average of £370,868.
What locations have the most affordable properties for sale in SY?
The locations with the most affordable properties for sale in SY are SY20 at an average of £221,930, SY16 at an average of £226,424 and SY18 at an average of £229,573.
Which train stations are available in or near SY?
Some of the train stations available in or near SY are Welshpool, Shrewsbury and Church Stretton.