
Properties for sale in TR11
Falmouth, Flushing, Mylor Bridge, Constantine, Mawnan Smith
- Info
- Price Paid By Year
- Property Type Price
- Transport
House Prices in TR11
Properties in TR11 have an average house price of £438,549.00 and had 1474 Property Transactions within the last 3 years.
The most expensive property was sold for £4,500,000.00.
Property Price Paid in TR11 by Year
The average sold property price by year was:
| Year | Average Sold Price | Sold Properties |
|---|---|---|
| 2026 | £327,852.00 | 39 Properties |
| 2025 | £422,280.00 | 457 Properties |
| 2024 | £461,368.00 | 525 Properties |
| 2023 | £438,045.00 | 453 Properties |
| 2022 | £450,320.00 | 549 Properties |
| 2021 | £407,003.00 | 775 Properties |
| 2020 | £385,389.00 | 613 Properties |
| 2019 | £342,467.00 | 669 Properties |
| 2018 | £339,190.00 | 607 Properties |
| 2017 | £334,313.00 | 629 Properties |
| 2016 | £301,844.00 | 670 Properties |
| 2015 | £291,959.00 | 683 Properties |
| 2014 | £278,568.00 | 671 Properties |
| 2013 | £263,590.00 | 554 Properties |
| 2012 | £266,357.00 | 541 Properties |
| 2011 | £267,410.00 | 522 Properties |
| 2010 | £264,272.00 | 449 Properties |
| 2009 | £259,510.00 | 508 Properties |
| 2008 | £274,078.00 | 388 Properties |
| 2007 | £277,205.00 | 648 Properties |
| 2006 | £247,897.00 | 744 Properties |
| 2005 | £246,241.00 | 533 Properties |
| 2004 | £228,894.00 | 604 Properties |
| 2003 | £203,205.00 | 670 Properties |
| 2002 | £161,826.00 | 738 Properties |
| 2001 | £117,398.00 | 768 Properties |
| 2000 | £109,715.00 | 742 Properties |
| 1999 | £93,456.00 | 795 Properties |
| 1998 | £85,230.00 | 684 Properties |
| 1997 | £74,836.00 | 794 Properties |
| 1996 | £70,008.00 | 633 Properties |
| 1995 | £65,955.00 | 503 Properties |
Property Price per Property Type in TR11
Here you can find historic sold price data in order to help with your property search.
The average Property Paid Price for specific property types in the last three years are:
| Property Type | Average Sold Price | Sold Properties |
|---|---|---|
| Semi Detached House | £371,831.00 | 293 Semi Detached Houses |
| Detached House | £672,695.00 | 405 Detached Houses |
| Terraced House | £358,193.00 | 477 Terraced Houses |
| Flat | £314,965.00 | 299 Flats |
Transport near TR11

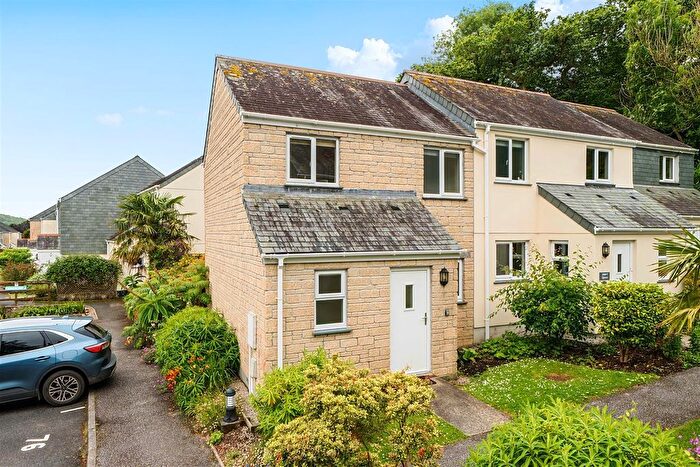
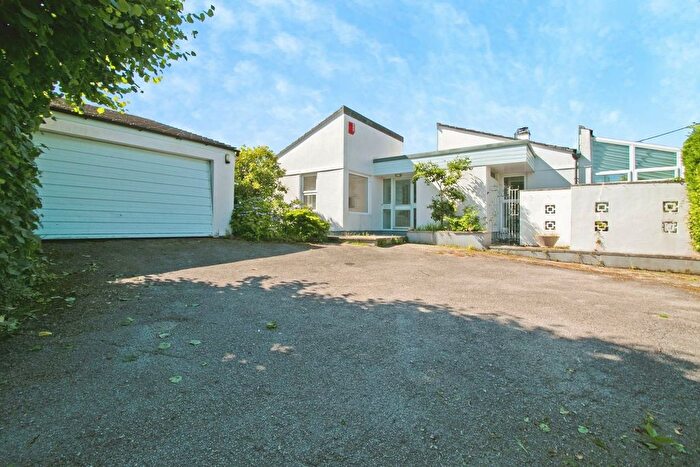
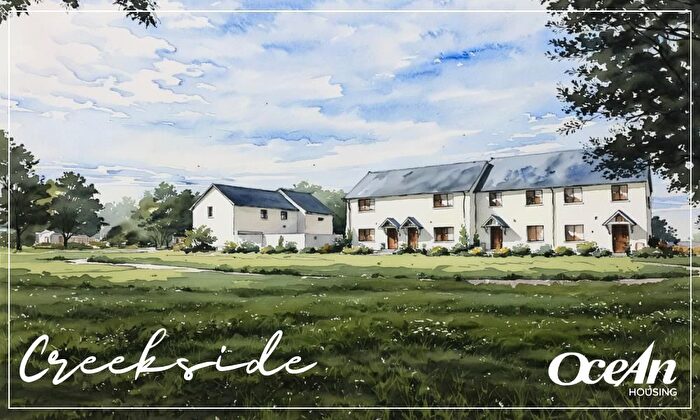
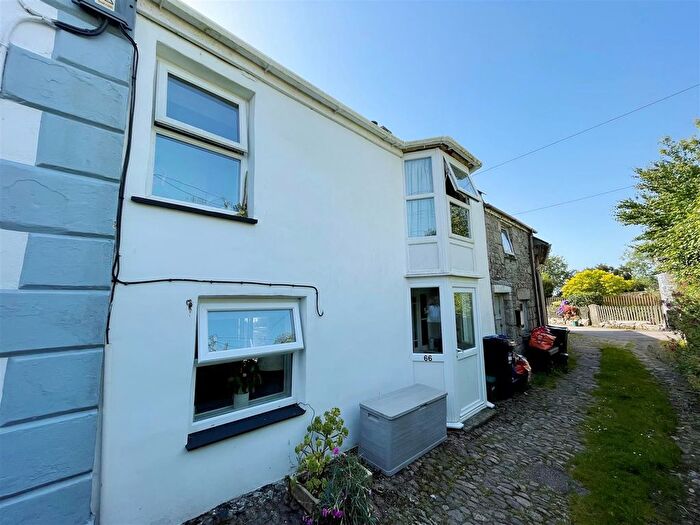
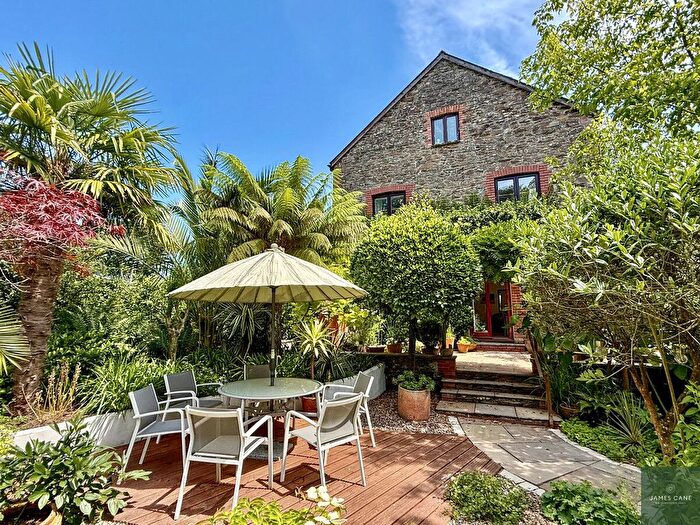
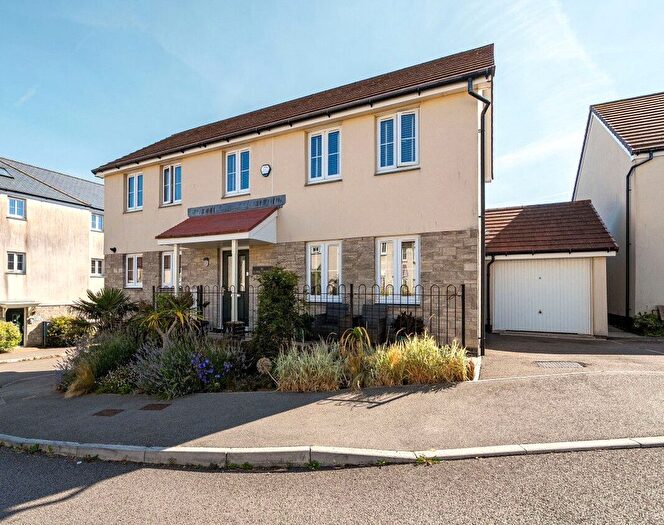
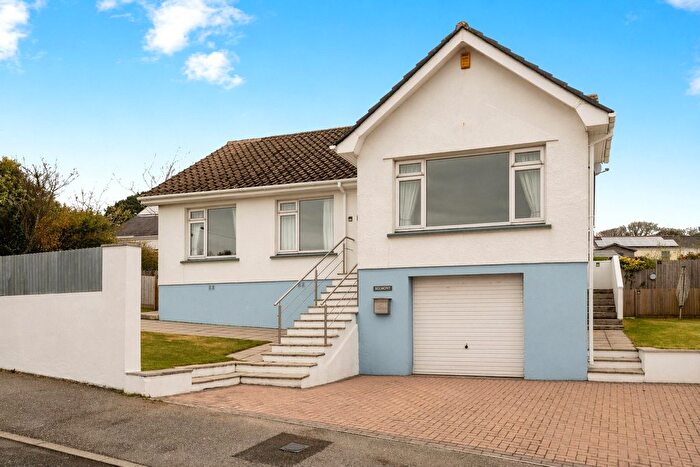
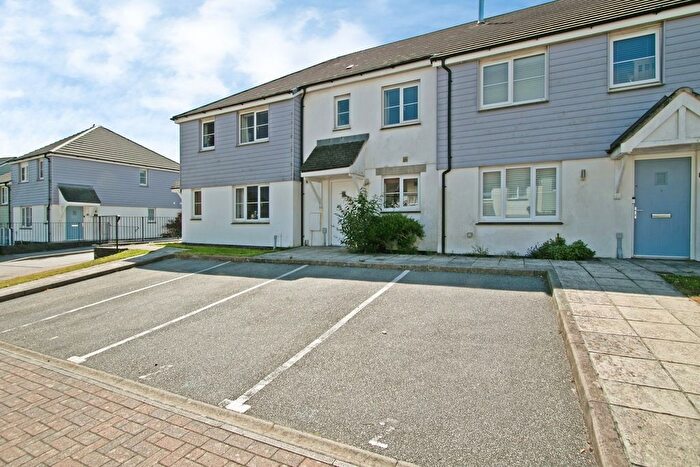
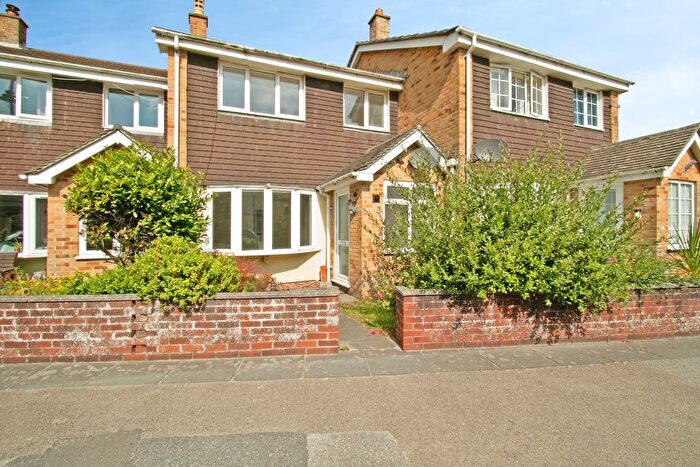
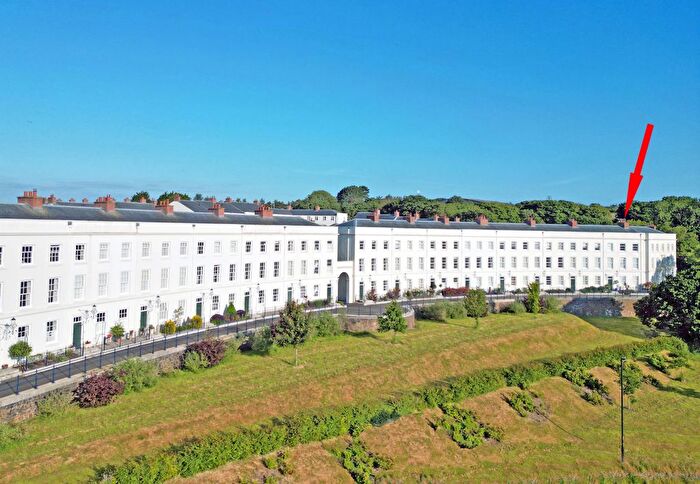
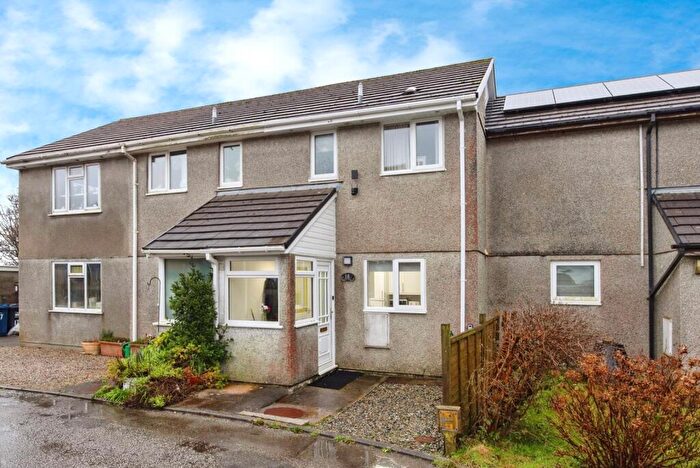
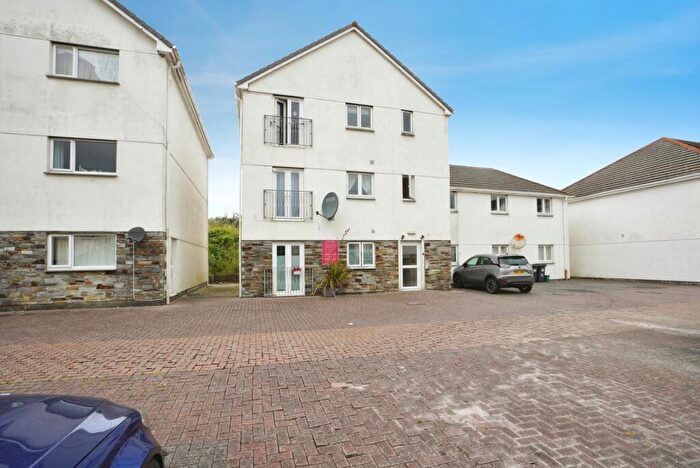
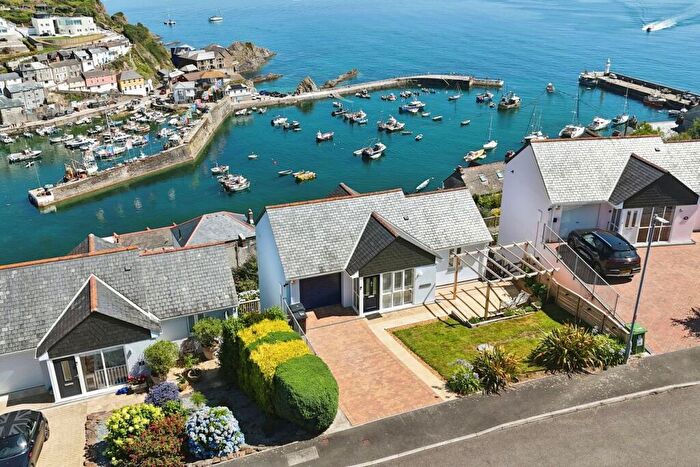
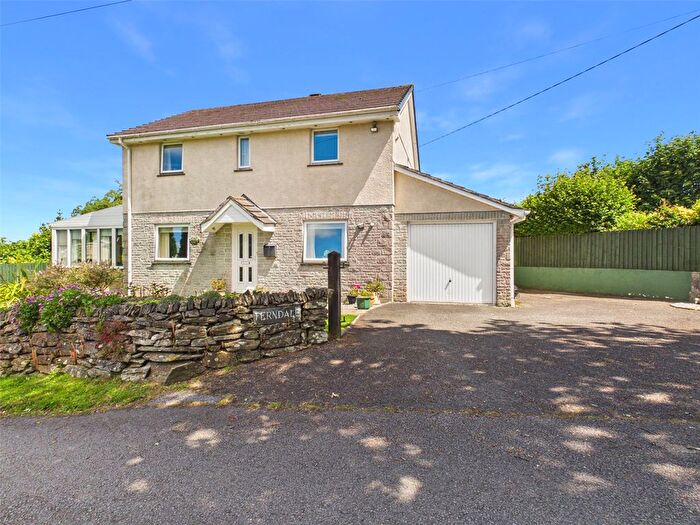
Houses and Flats for sale in TR11, Falmouth, Flushing, Mylor Bridge, Constantine
There are 1,421 results. Property prices in TR11 range from £130k to £1.25M with an average price of £459k.
![]()
If you are looking to sell your house, let it out, or receive a property valuation, an expert can help you.
Click the button below to get started.
Properties for sale near TR11
![]()
If you are looking to sell your house, let it out, or receive a property valuation, an expert can help you.
Click the button below to get started.
Frequently Asked Questions about TR11
What is the average price for a property for sale in TR11?
The average price for a property for sale in TR11 is £438,549. There are 8 property listings for sale in TR11.
Which areas are included in the TR11 postcode district?
The main areas within TR11 include Falmouth, Flushing, Mylor Bridge, Constantine and Mawnan Smith.
What are the most common property types in TR11?
The most common property types in TR11 are Terraced Houses, Detached Houses, Flats and Semi Detached Houses.
What has been the average sold property price in TR11 over the last three years?
Terraced Houses in TR11 have an average sold price of £358,193, while Detached Houses have an average of £672,695. Flats have an average of £314,965 and Semi Detached Houses have an average of £371,831. The average sold property price in TR11 over the last three years is approximately £403,833.
Which train stations are available in TR11?
The train stations available in TR11 are Falmouth Docks Station, Falmouth Town Station and Penmere Station..