
Properties for sale in TR23
Bryher
- Info
- Price Paid By Year
- Transport
House Prices in TR23
Properties in TR23 have no sales history available within the last 3 years.
Property Price Paid in TR23 by Year
The average sold property price by year was:
| Year | Average Sold Price | Sold Properties |
|---|---|---|
| 2017 | £590,000.00 | 1 Properties |
| 2016 | £440,000.00 | 1 Properties |
| 2013 | £625,000.00 | 1 Properties |
| 2011 | £720,000.00 | 1 Properties |
| 2010 | £659,000.00 | 1 Properties |
| 2001 | £80,000.00 | 1 Properties |
| 1999 | £119,000.00 | 1 Properties |
| 1995 | £100,500.00 | 1 Properties |

Properties for sale near TR23

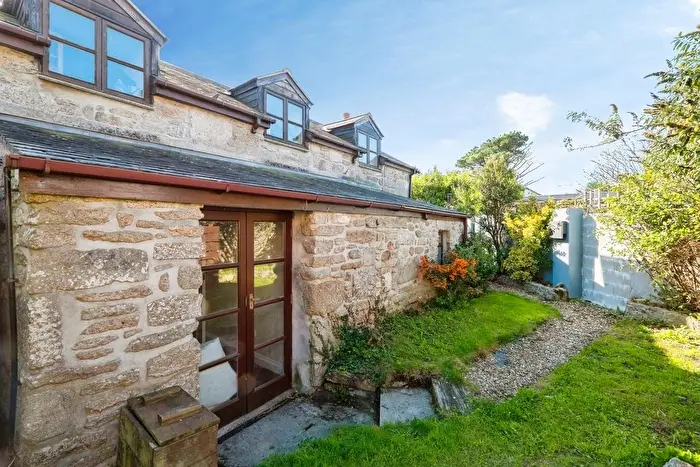
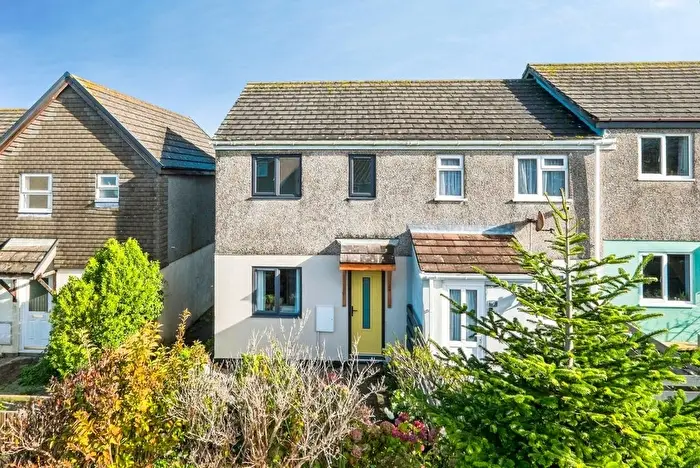
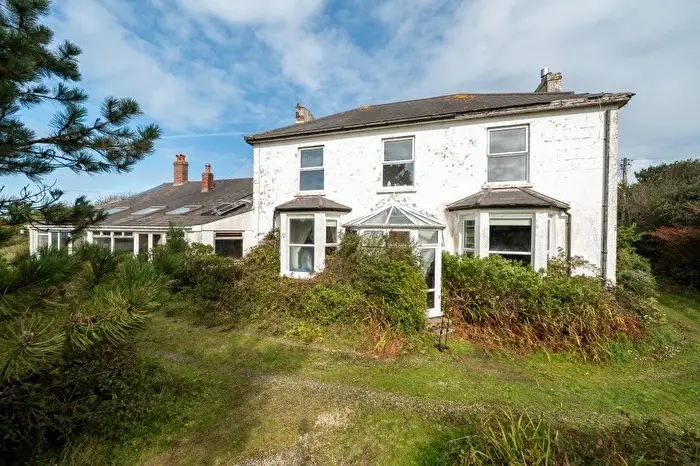
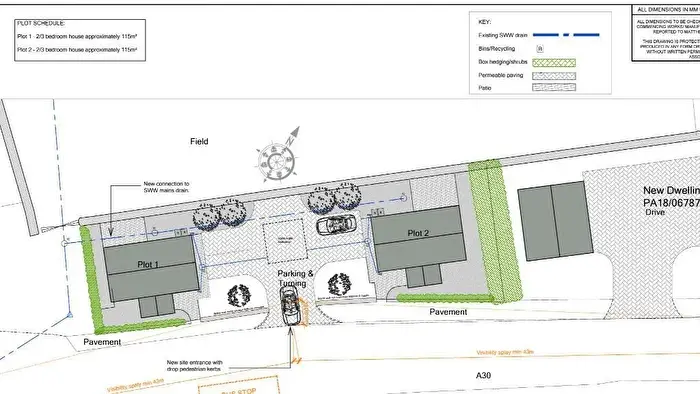
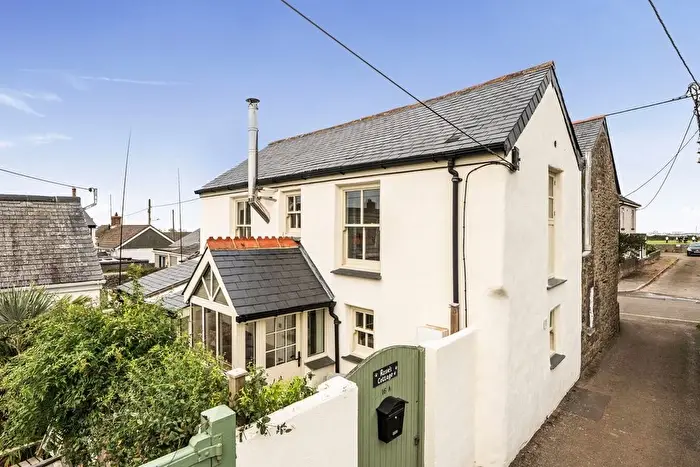
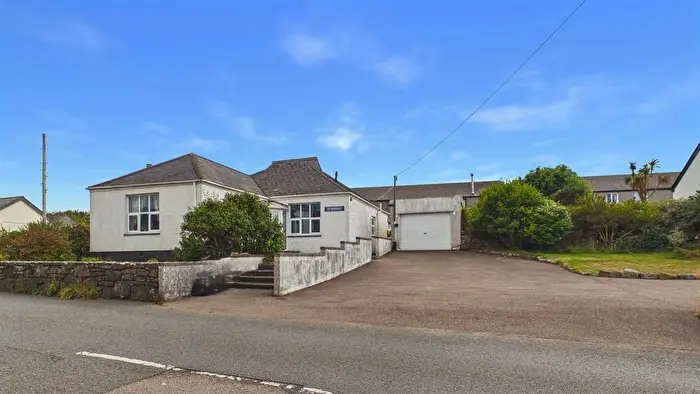
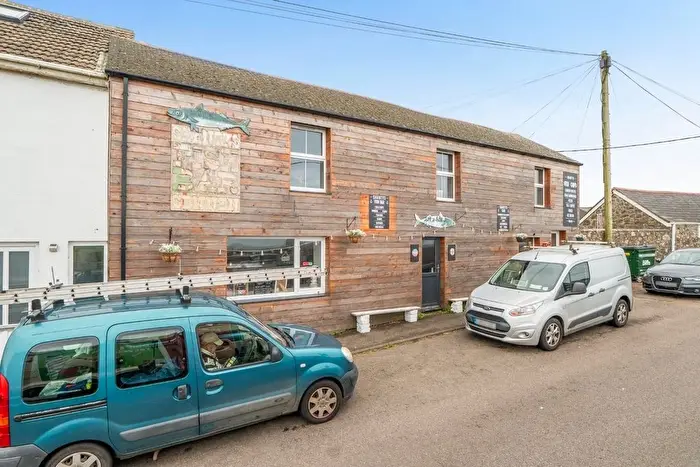
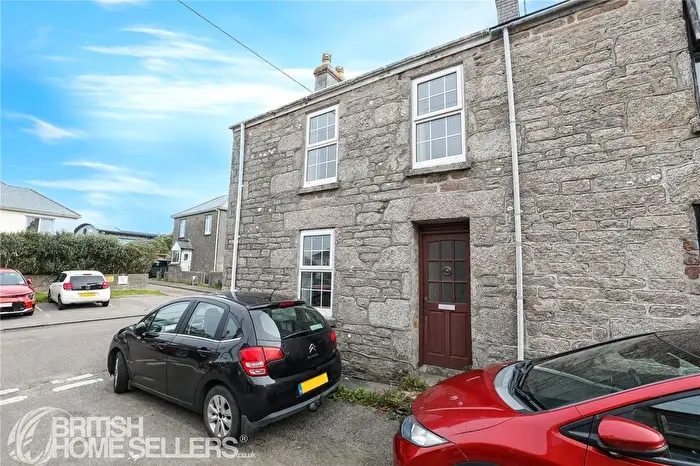
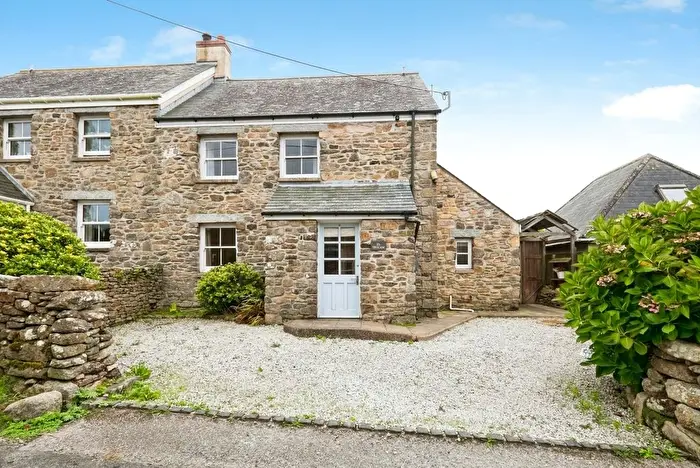
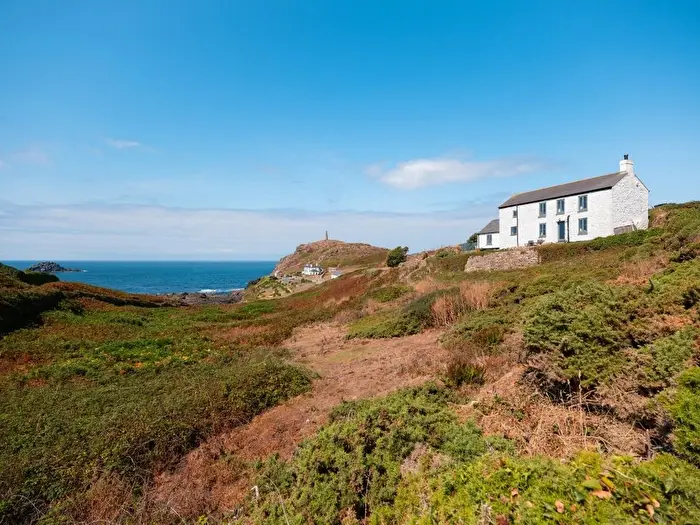
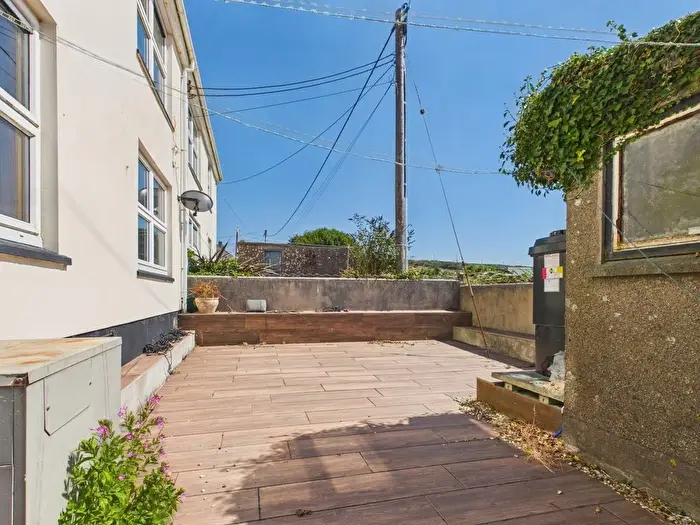
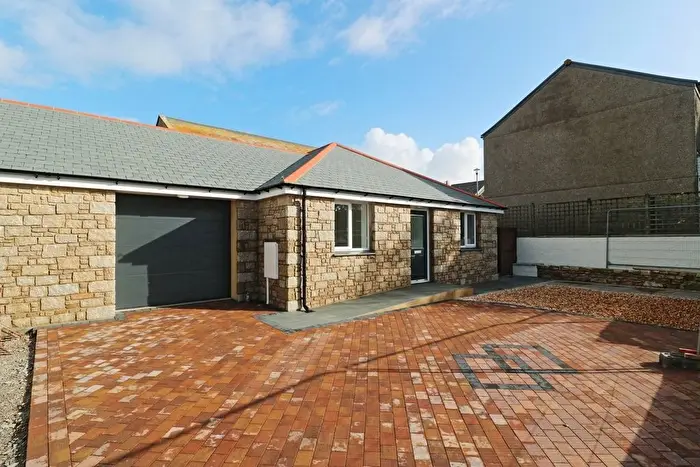
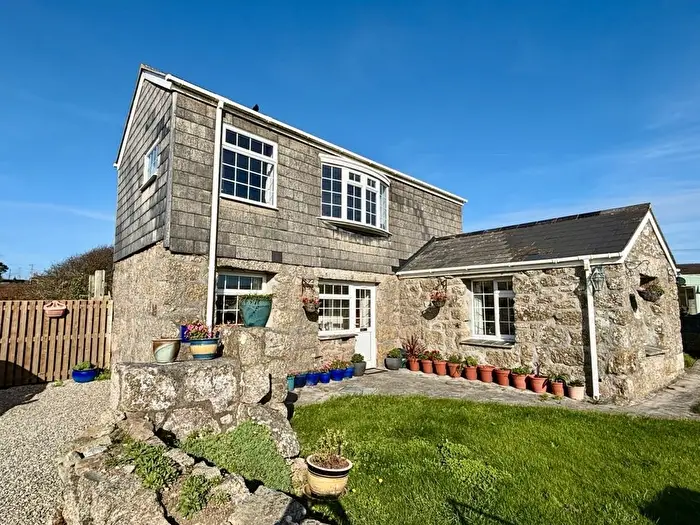
There are 101 results for TR23, Bryher. Property prices near TR23 range from £113k to £895k with an average price of £386k.
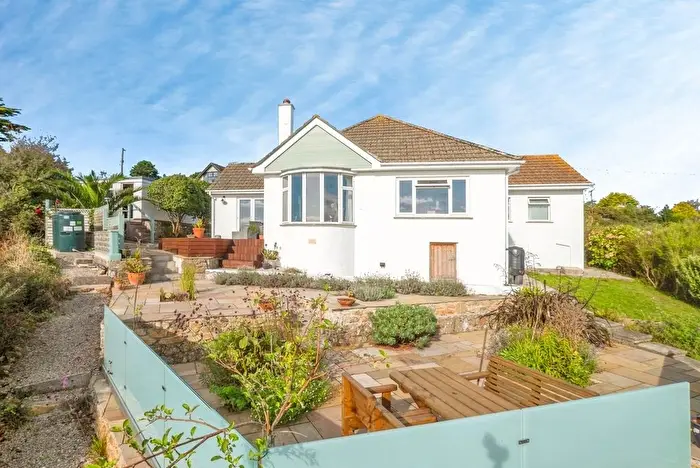


 3 Bedrooms
 2 Bathrooms


If you are looking to sell your house, let it out, or receive a property valuation, an expert can help you.
Click the button below to get started.





Property market in TR23
Based on the asking prices of the homes listed over the last two years. Schools: Ofsted. Updated October 2026.
Frequently Asked Questions about TR23
Where are the cheapest places to buy near TR23?
Of the areas around TR23, TR18 is the cheapest, with a typical asking price of £250,000, followed by TR20 (£373,000) and TR19 (£375,000).
What is the average price for a property for sale in TR23?
The average price for a property for sale in TR23 is £0.
Which areas are included in the TR23 postcode district?
The main area within TR23 is Bryher.
What are the most common property types in TR23?
The most common property types in TR23 are and.