
Properties for sale in TS26
Hartlepool
- Info
- Price Paid By Year
- Property Type Price
- Transport
House Prices in TS26
Properties in TS26 have an average house price of £154,229.00 and had 1659 Property Transactions within the last 3 years.
The most expensive property was sold for £960,000.00.
Property Price Paid in TS26 by Year
The average sold property price by year was:
| Year | Average Sold Price | Sold Properties |
|---|---|---|
| 2026 | £149,125.00 | 12 Properties |
| 2025 | £160,358.00 | 540 Properties |
| 2024 | £152,883.00 | 572 Properties |
| 2023 | £149,597.00 | 535 Properties |
| 2022 | £151,735.00 | 613 Properties |
| 2021 | £152,071.00 | 710 Properties |
| 2020 | £148,560.00 | 583 Properties |
| 2019 | £149,137.00 | 547 Properties |
| 2018 | £168,090.00 | 546 Properties |
| 2017 | £152,713.00 | 539 Properties |
| 2016 | £143,945.00 | 484 Properties |
| 2015 | £135,705.00 | 496 Properties |
| 2014 | £140,920.00 | 440 Properties |
| 2013 | £146,926.00 | 356 Properties |
| 2012 | £150,348.00 | 321 Properties |
| 2011 | £151,480.00 | 321 Properties |
| 2010 | £141,519.00 | 391 Properties |
| 2009 | £133,016.00 | 328 Properties |
| 2008 | £135,209.00 | 445 Properties |
| 2007 | £147,490.00 | 716 Properties |
| 2006 | £128,675.00 | 852 Properties |
| 2005 | £110,065.00 | 779 Properties |
| 2004 | £93,759.00 | 1,069 Properties |
| 2003 | £81,644.00 | 917 Properties |
| 2002 | £71,703.00 | 857 Properties |
| 2001 | £69,109.00 | 802 Properties |
| 2000 | £64,653.00 | 648 Properties |
| 1999 | £66,608.00 | 615 Properties |
| 1998 | £58,171.00 | 575 Properties |
| 1997 | £56,969.00 | 476 Properties |
| 1996 | £48,401.00 | 404 Properties |
| 1995 | £42,140.00 | 349 Properties |
Property Price per Property Type in TS26
Here you can find historic sold price data in order to help with your property search.
The average Property Paid Price for specific property types in the last three years are:
| Property Type | Average Sold Price | Sold Properties |
|---|---|---|
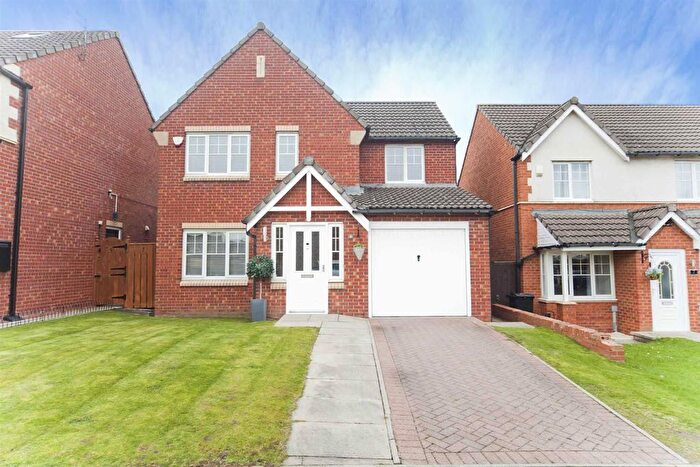
| Semi Detached House | £171,019.00 | 344 Semi Detached Houses |
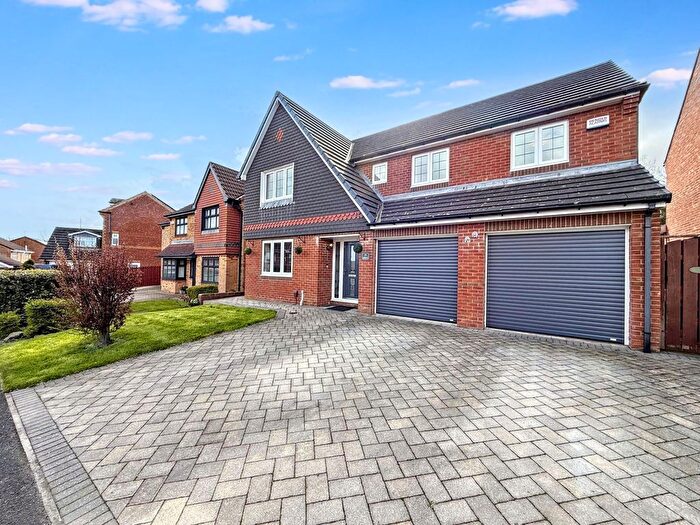
| Detached House | £304,667.00 | 425 Detached Houses |
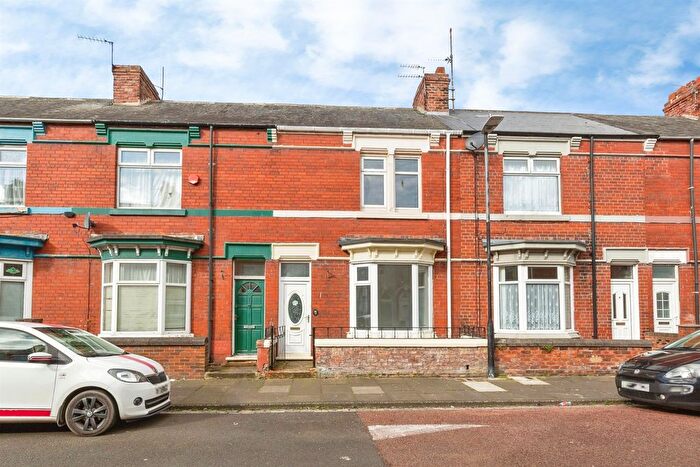
| Terraced House | £74,261.00 | 840 Terraced Houses |
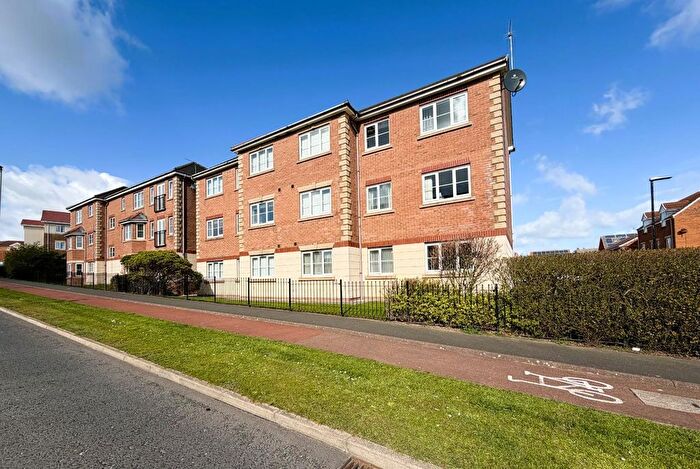
| Flat | £103,457.00 | 50 Flats |

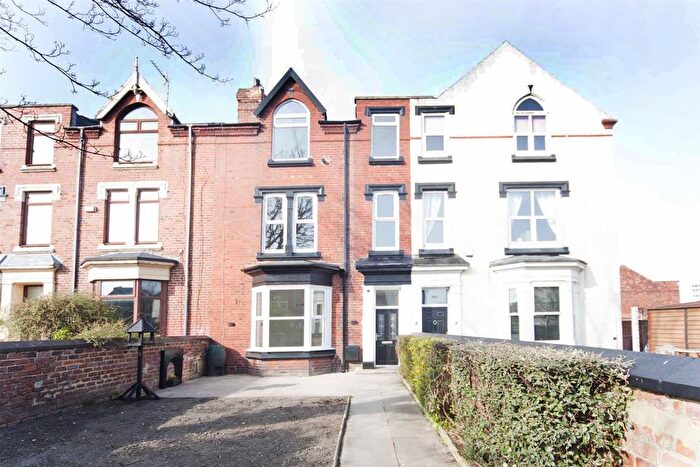
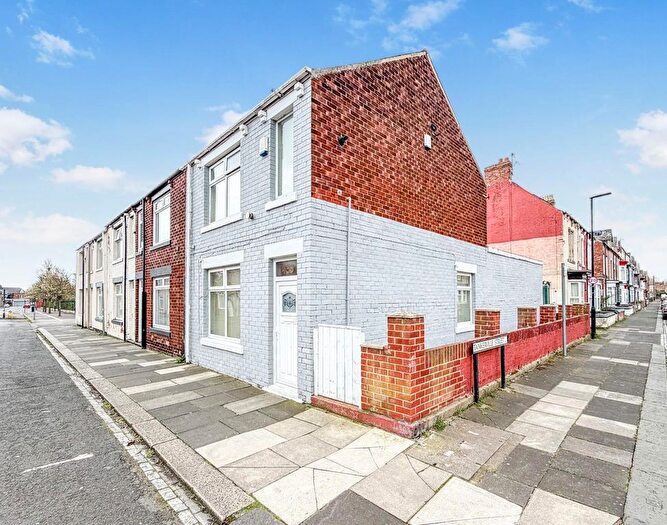
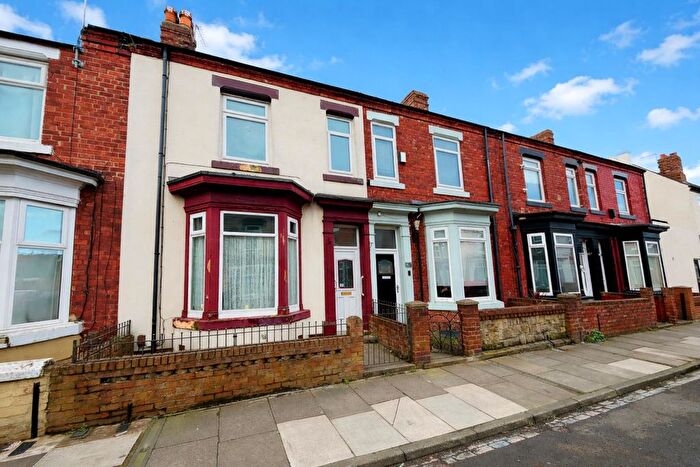
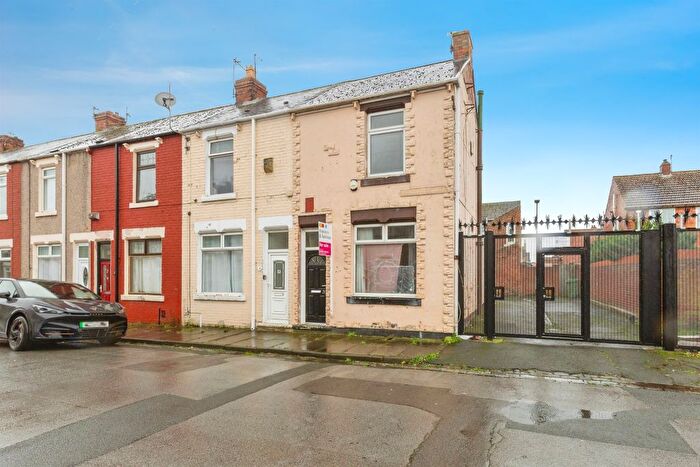
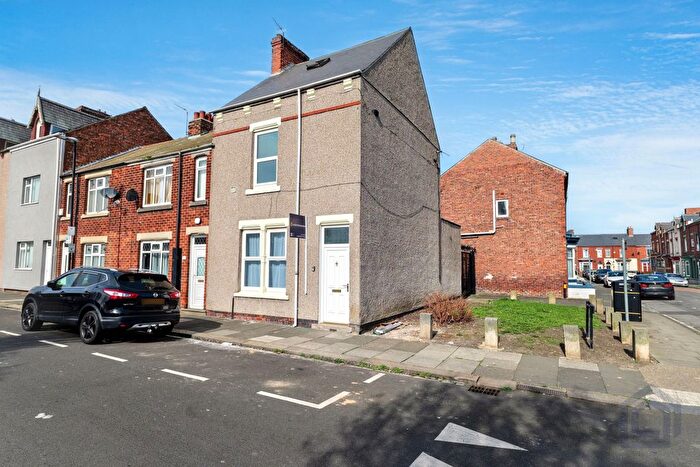
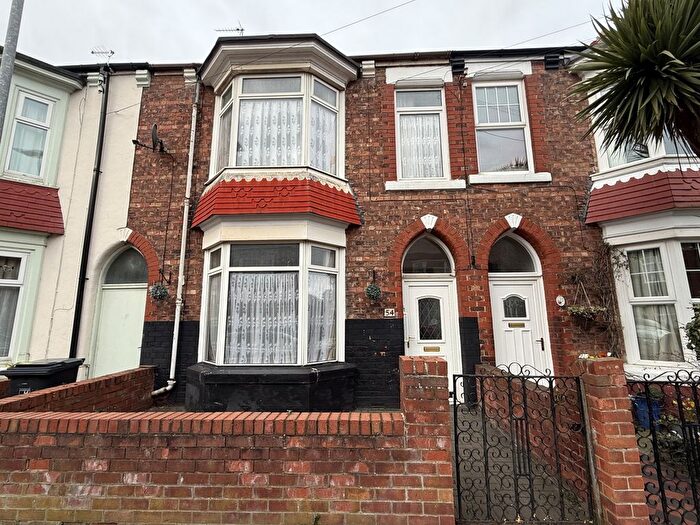
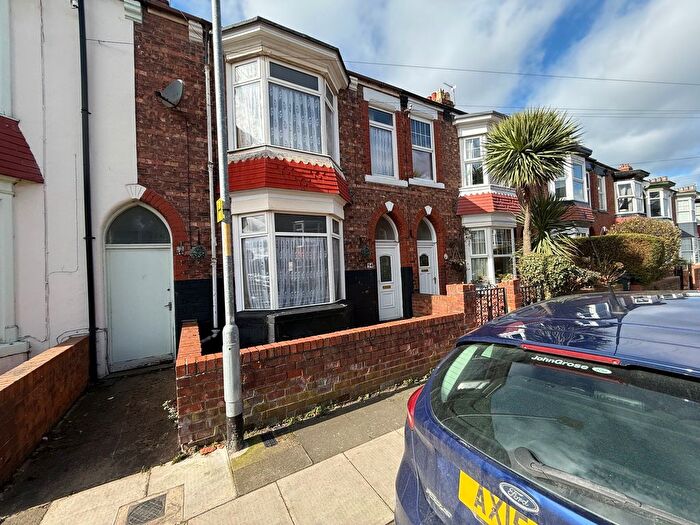
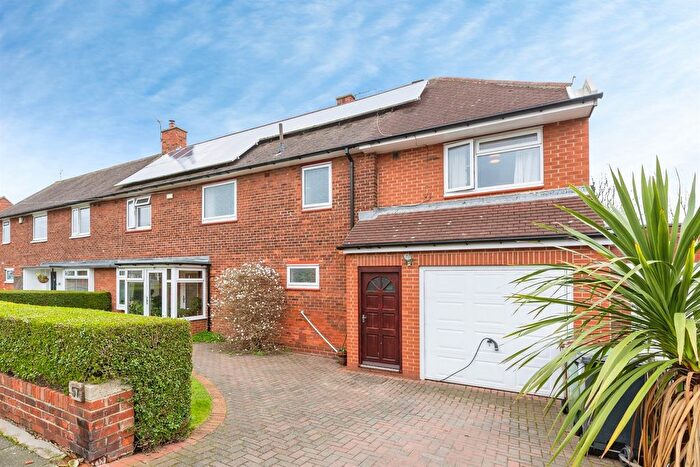
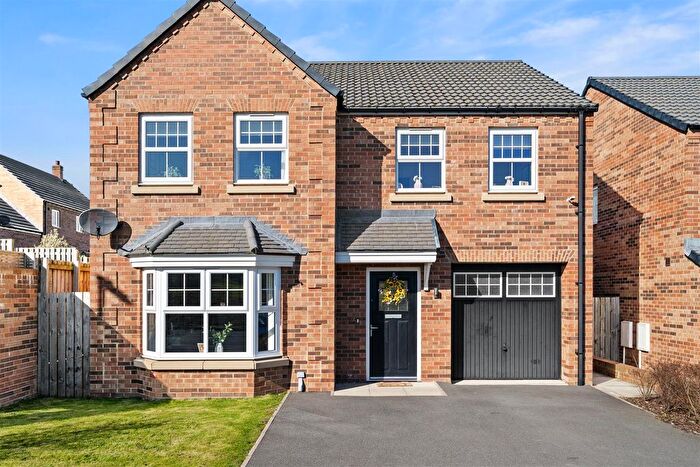
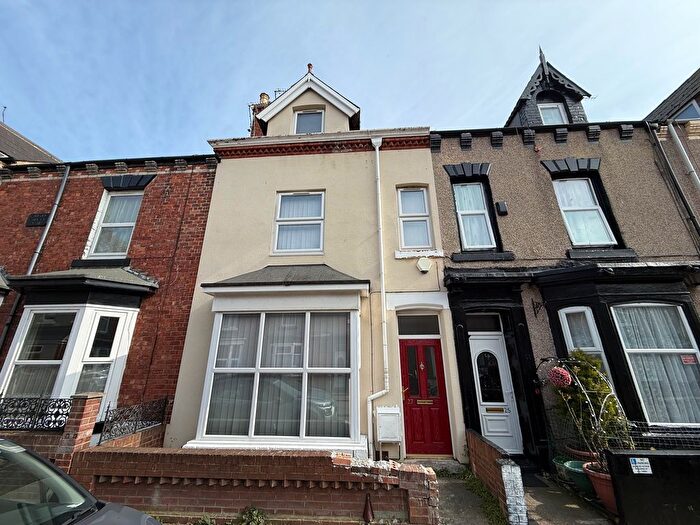
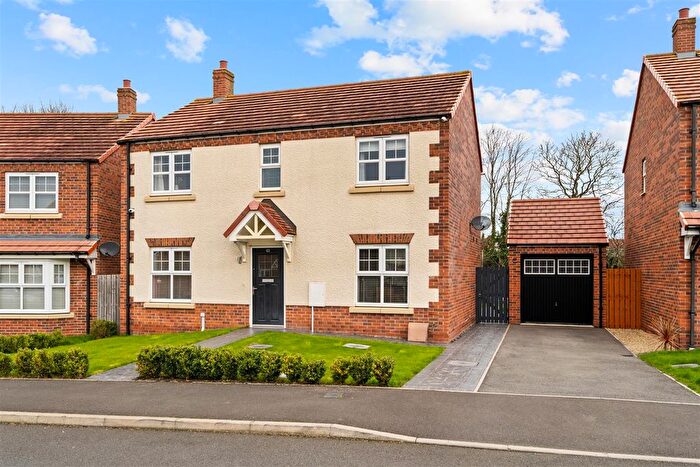
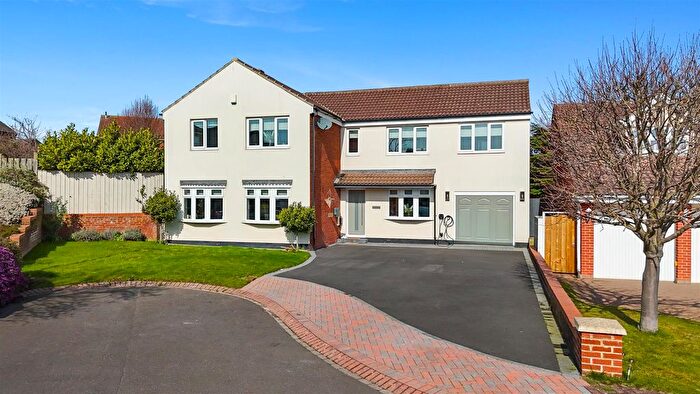
Houses and Flats for sale in TS26, Hartlepool
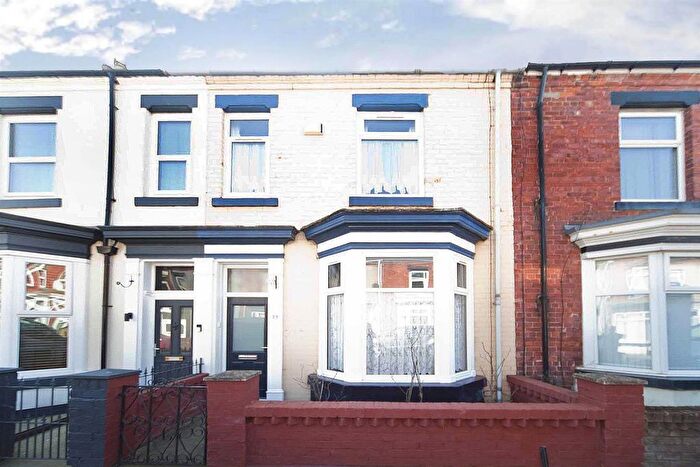
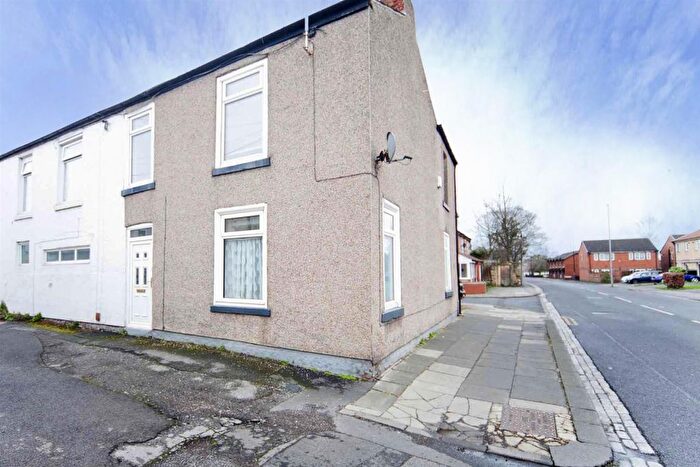
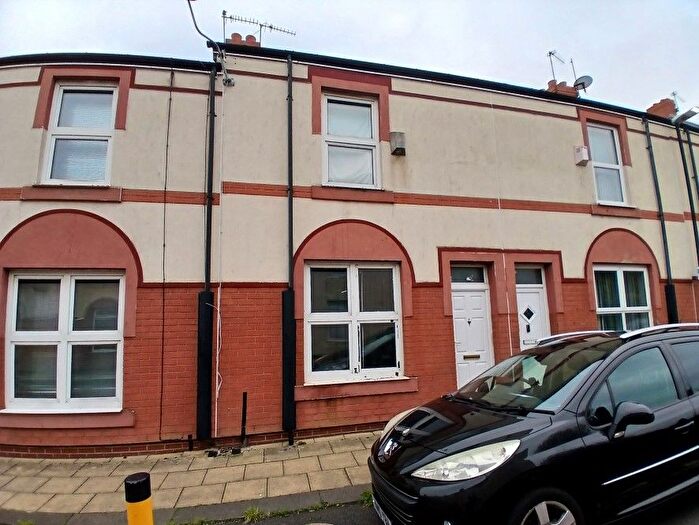
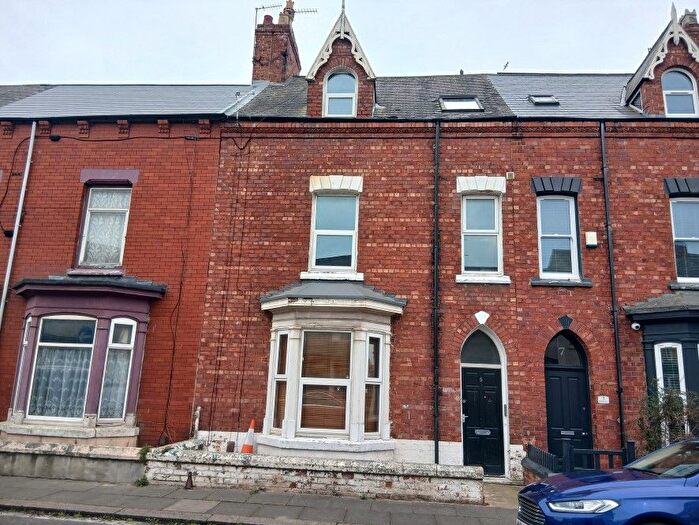
![]()
If you are looking to sell your house, let it out, or receive a property valuation, an expert can help you.
Click the button below to get started.
Frequently Asked Questions about TS26
What is the average price for a property for sale in TS26?
The average price for a property for sale in TS26 is £154,229. There are 99 property listings for sale in TS26.
Which areas are included in the TS26 postcode district?
The main area within TS26 is Hartlepool.
What are the most common property types in TS26?
The most common property types in TS26 are Terraced Houses, Detached Houses, Semi Detached Houses and Flats.
What has been the average sold property price in TS26 over the last three years?
Terraced Houses in TS26 have an average sold price of £74,261, while Detached Houses have an average of £304,667. Semi Detached Houses have an average of £171,019 and Flats have an average of £103,457. The average sold property price in TS26 over the last three years is approximately £154,122.