
Properties for sale in TS23
Billingham
- Info
- Price Paid By Year
- Property Type Price
- Transport
House Prices in TS23
Properties in TS23 have an average house price of £135,936.00 and had 1190 Property Transactions within the last 3 years.
The most expensive property was sold for £583,994.00.
Property Price Paid in TS23 by Year
The average sold property price by year was:
| Year | Average Sold Price | Sold Properties |
|---|---|---|
| 2026 | £145,925.00 | 27 Properties |
| 2025 | £141,035.00 | 409 Properties |
| 2024 | £134,477.00 | 408 Properties |
| 2023 | £130,849.00 | 346 Properties |
| 2022 | £134,398.00 | 465 Properties |
| 2021 | £123,020.00 | 515 Properties |
| 2020 | £111,184.00 | 352 Properties |
| 2019 | £112,032.00 | 417 Properties |
| 2018 | £110,589.00 | 372 Properties |
| 2017 | £116,107.00 | 426 Properties |
| 2016 | £103,920.00 | 383 Properties |
| 2015 | £108,626.00 | 365 Properties |
| 2014 | £105,241.00 | 347 Properties |
| 2013 | £109,585.00 | 319 Properties |
| 2012 | £105,129.00 | 251 Properties |
| 2011 | £106,005.00 | 270 Properties |
| 2010 | £112,529.00 | 306 Properties |
| 2009 | £108,882.00 | 264 Properties |
| 2008 | £113,335.00 | 289 Properties |
| 2007 | £120,411.00 | 598 Properties |
| 2006 | £112,688.00 | 603 Properties |
| 2005 | £102,585.00 | 494 Properties |
| 2004 | £94,377.00 | 625 Properties |
| 2003 | £74,129.00 | 725 Properties |
| 2002 | £55,948.00 | 802 Properties |
| 2001 | £49,494.00 | 619 Properties |
| 2000 | £45,416.00 | 521 Properties |
| 1999 | £45,919.00 | 495 Properties |
| 1998 | £43,948.00 | 484 Properties |
| 1997 | £46,238.00 | 555 Properties |
| 1996 | £46,903.00 | 539 Properties |
| 1995 | £40,427.00 | 310 Properties |
Property Price per Property Type in TS23
Here you can find historic sold price data in order to help with your property search.
The average Property Paid Price for specific property types in the last three years are:
| Property Type | Average Sold Price | Sold Properties |
|---|---|---|
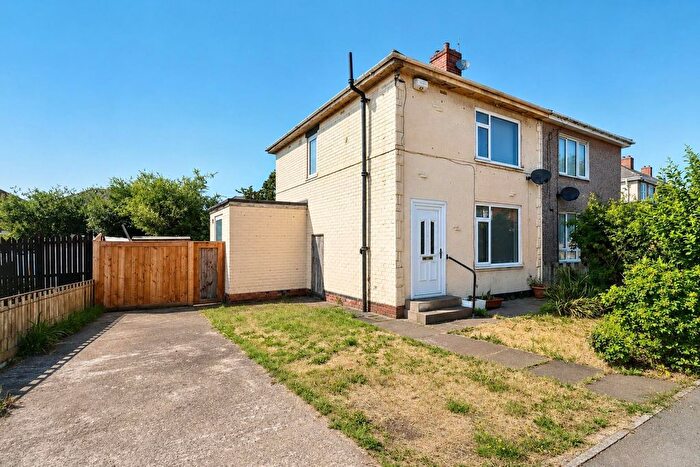
| Semi Detached House | £128,209.00 | 563 Semi Detached Houses |
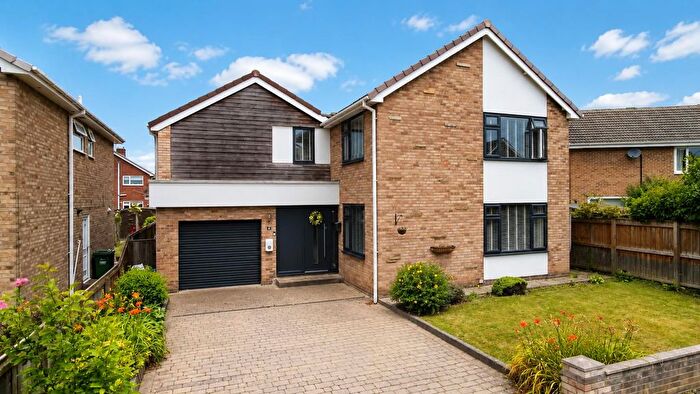
| Detached House | £226,451.00 | 184 Detached Houses |
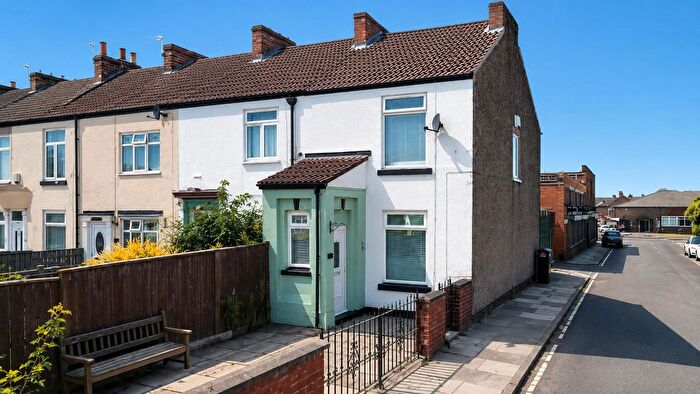
| Terraced House | £110,076.00 | 420 Terraced Houses |
| Flat | £73,200.00 | 23 Flats |
Transport near TS23

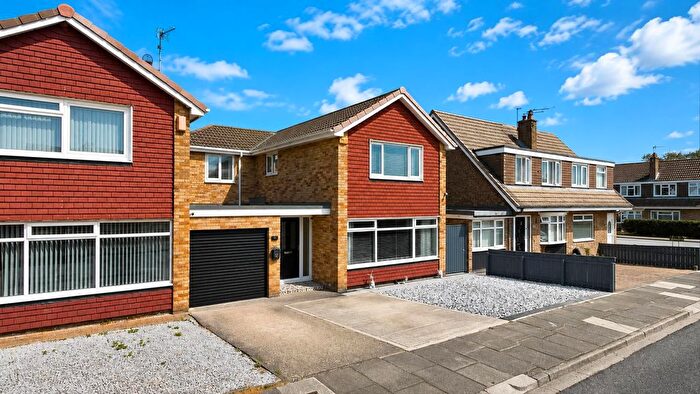
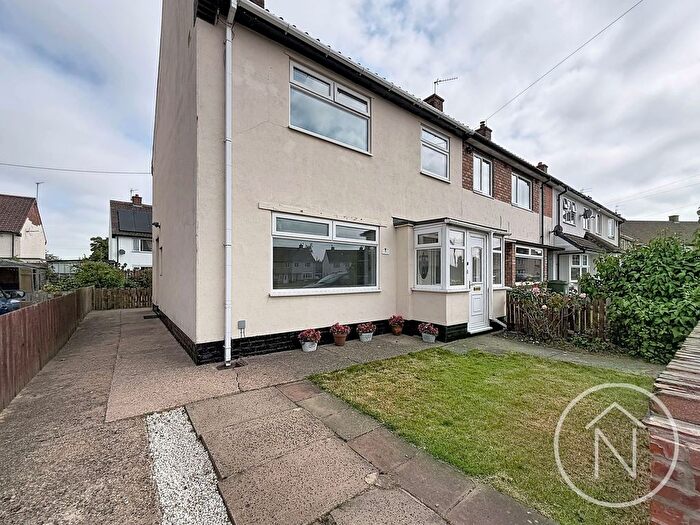
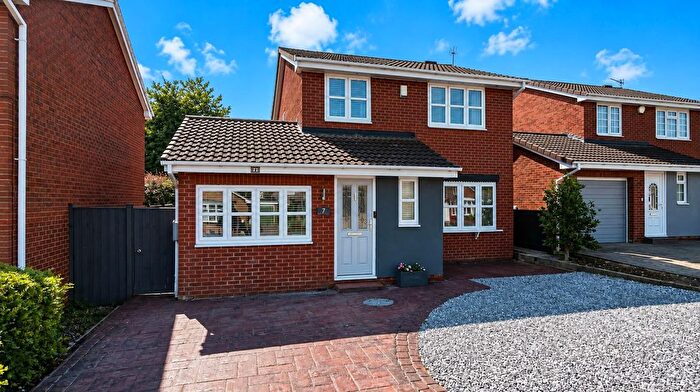
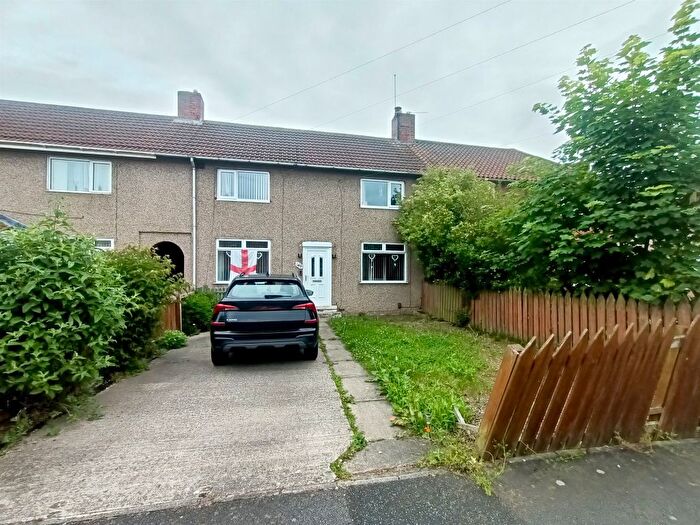
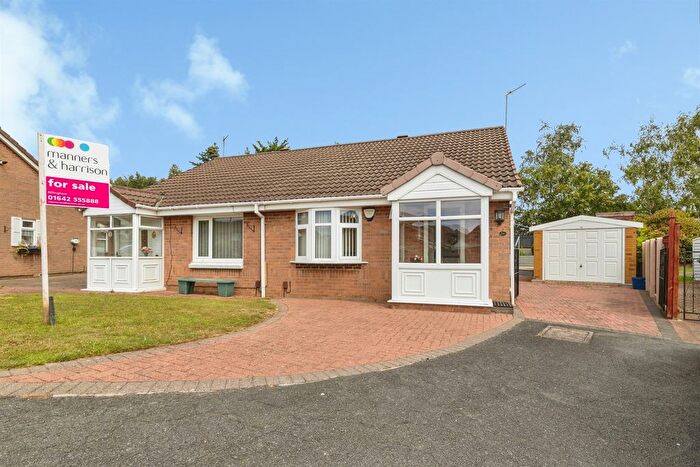
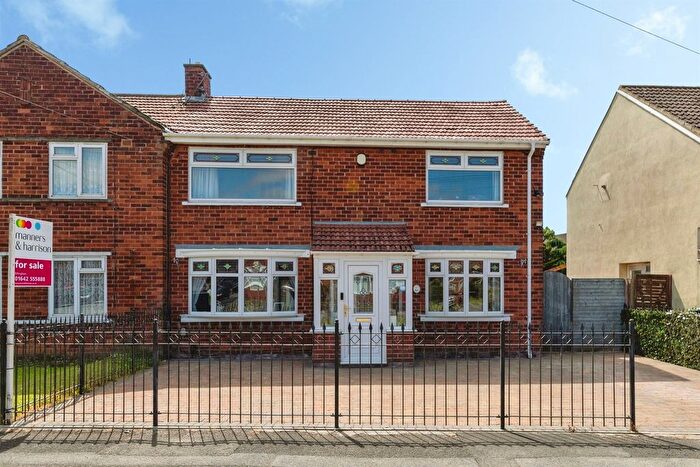
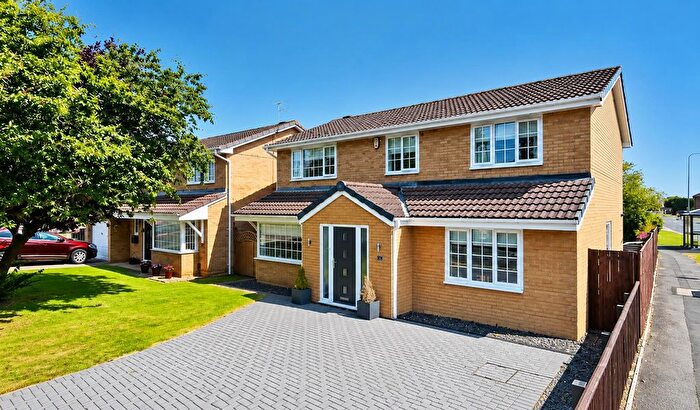
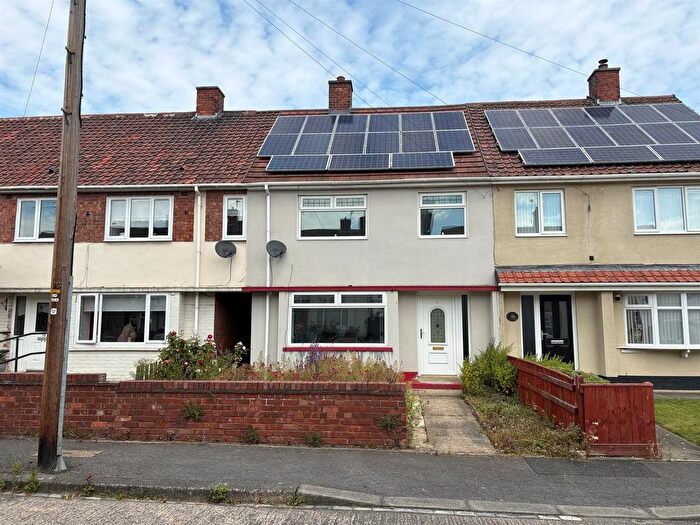
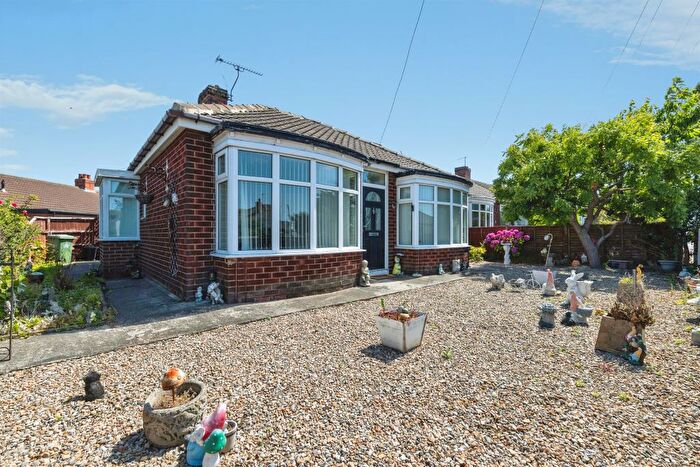
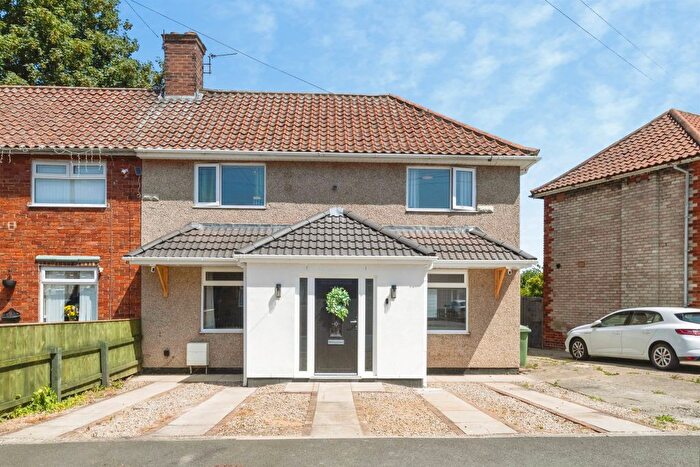
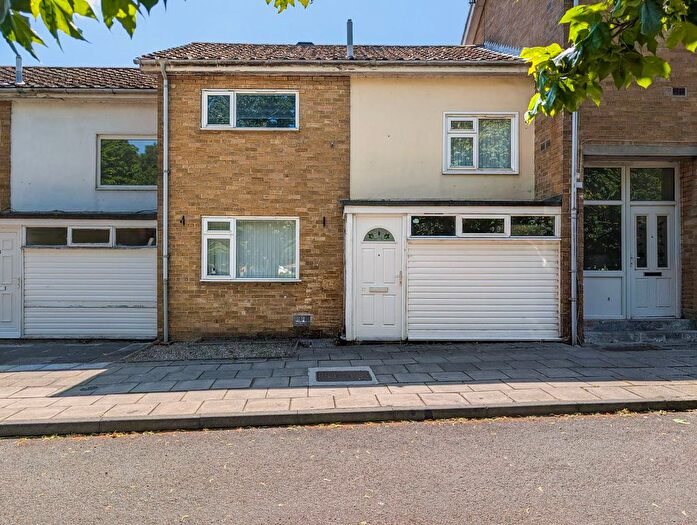
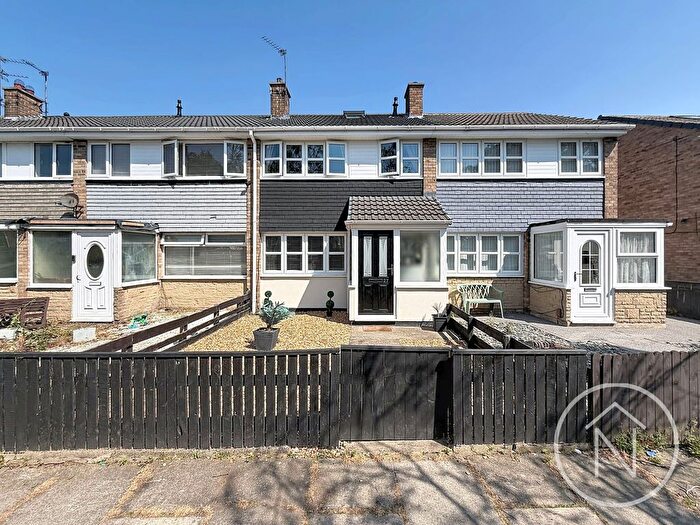
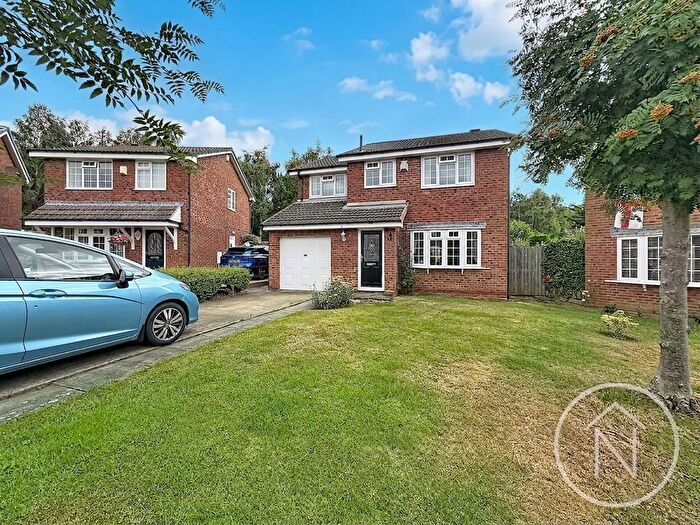
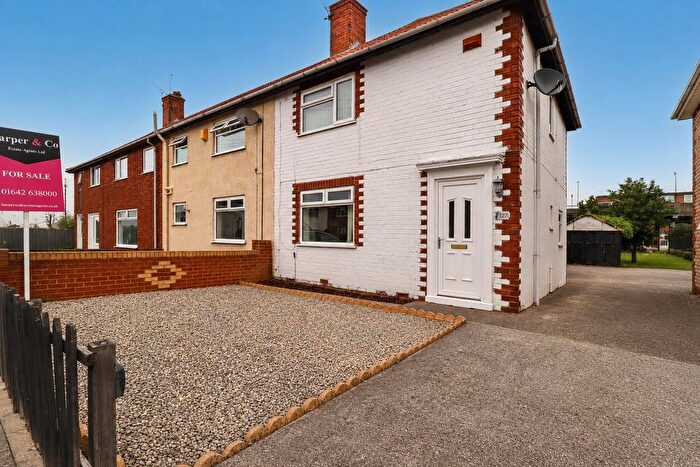
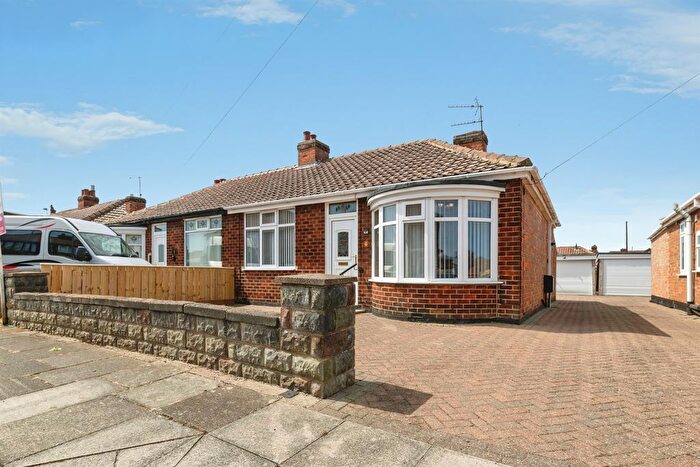
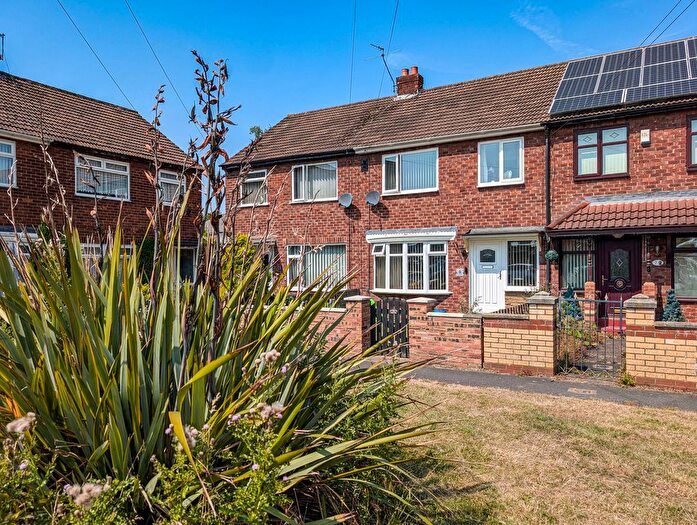
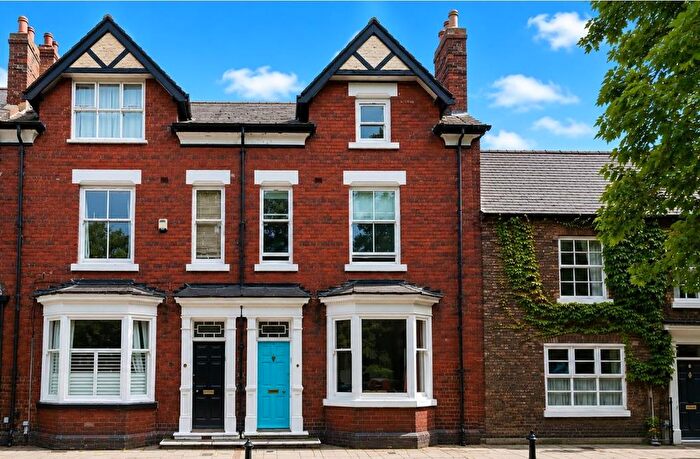
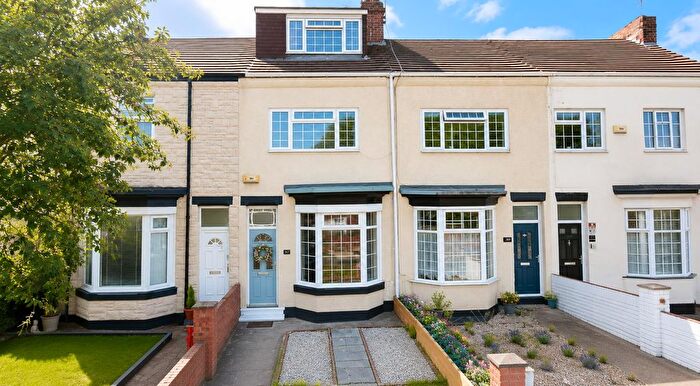
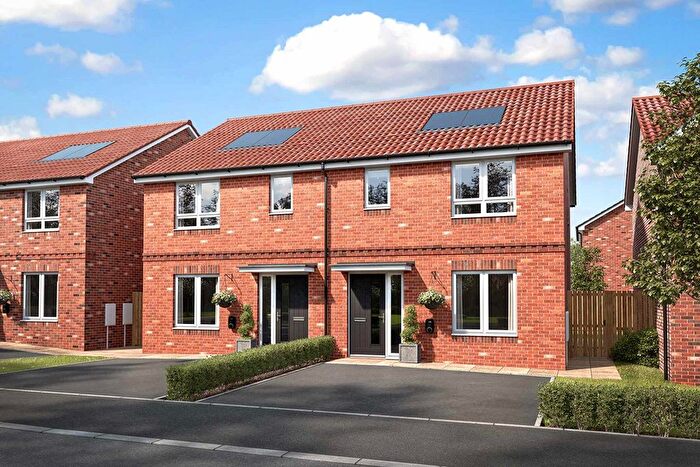
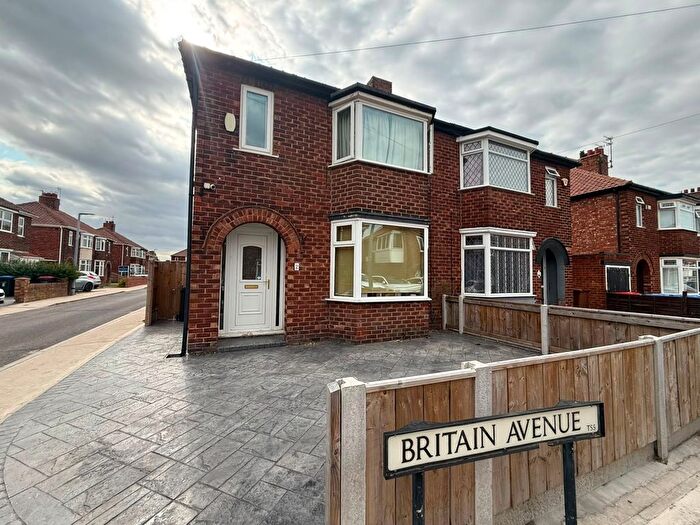
Houses and Flats for sale in TS23, Billingham
There are 127 results. Property prices in TS23 range from £95k to £400k with an average price of £172k.
![]()
If you are looking to sell your house, let it out, or receive a property valuation, an expert can help you.
Click the button below to get started.
Properties for sale near TS23
![]()
If you are looking to sell your house, let it out, or receive a property valuation, an expert can help you.
Click the button below to get started.
Frequently Asked Questions about TS23
What is the average price for a property for sale in TS23?
The average price for a property for sale in TS23 is £135,936. There are 14 property listings for sale in TS23.
Which areas are included in the TS23 postcode district?
The main area within TS23 is Billingham (East).
What are the most common property types in TS23?
The most common property types in TS23 are Semi Detached Houses, Terraced Houses, Detached Houses and Flats.
What has been the average sold property price in TS23 over the last three years?
Semi Detached Houses in TS23 have an average sold price of £128,209, while Terraced Houses have an average of £110,076. Detached Houses have an average of £226,451 and Flats have an average of £73,200. The average sold property price in TS23 over the last three years is approximately £140,479.
Which train stations are available in TS23?
The train station available in TS23 is Billingham Station..