
Properties for sale in TW11
Teddington
- Info
- Price Paid By Year
- Property Type Price
- Transport
House Prices in TW11
Properties in TW11 have an average house price of £837,584.00 and had 1093 Property Transactions within the last 3 years.
The most expensive property was sold for £3,500,000.00.
Property Price Paid in TW11 by Year
The average sold property price by year was:
| Year | Average Sold Price | Sold Properties |
|---|---|---|
| 2026 | £671,732.00 | 17 Properties |
| 2025 | £792,276.00 | 319 Properties |
| 2024 | £847,532.00 | 365 Properties |
| 2023 | £872,384.00 | 392 Properties |
| 2022 | £852,423.00 | 462 Properties |
| 2021 | £782,978.00 | 594 Properties |
| 2020 | £789,253.00 | 387 Properties |
| 2019 | £706,253.00 | 418 Properties |
| 2018 | £747,784.00 | 390 Properties |
| 2017 | £741,114.00 | 409 Properties |
| 2016 | £737,535.00 | 450 Properties |
| 2015 | £691,893.00 | 480 Properties |
| 2014 | £611,376.00 | 473 Properties |
| 2013 | £555,371.00 | 549 Properties |
| 2012 | £514,755.00 | 531 Properties |
| 2011 | £498,036.00 | 429 Properties |
| 2010 | £482,516.00 | 429 Properties |
| 2009 | £476,444.00 | 350 Properties |
| 2008 | £446,675.00 | 363 Properties |
| 2007 | £445,592.00 | 649 Properties |
| 2006 | £385,048.00 | 683 Properties |
| 2005 | £365,293.00 | 548 Properties |
| 2004 | £373,717.00 | 678 Properties |
| 2003 | £328,817.00 | 718 Properties |
| 2002 | £295,343.00 | 740 Properties |
| 2001 | £273,076.00 | 646 Properties |
| 2000 | £261,463.00 | 564 Properties |
| 1999 | £219,343.00 | 842 Properties |
| 1998 | £172,693.00 | 706 Properties |
| 1997 | £158,708.00 | 817 Properties |
| 1996 | £123,251.00 | 664 Properties |
| 1995 | £124,411.00 | 462 Properties |
Property Price per Property Type in TW11
Here you can find historic sold price data in order to help with your property search.
The average Property Paid Price for specific property types in the last three years are:
| Property Type | Average Sold Price | Sold Properties |
|---|---|---|
| Semi Detached House | £1,267,847.00 | 165 Semi Detached Houses |
| Detached House | £1,676,891.00 | 63 Detached Houses |
| Terraced House | £929,000.00 | 355 Terraced Houses |
| Flat | £531,069.00 | 510 Flats |

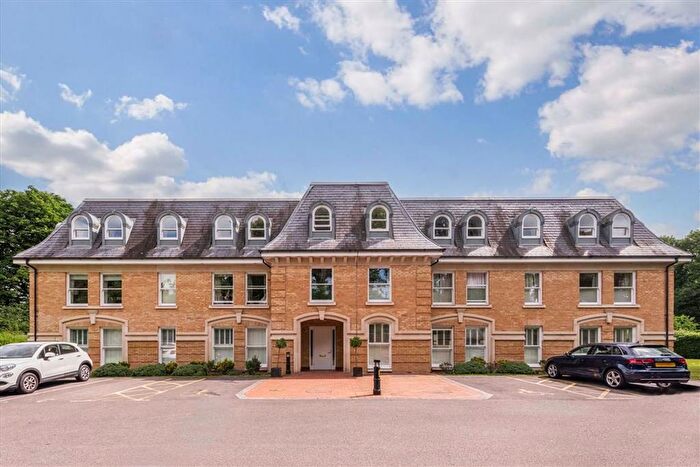
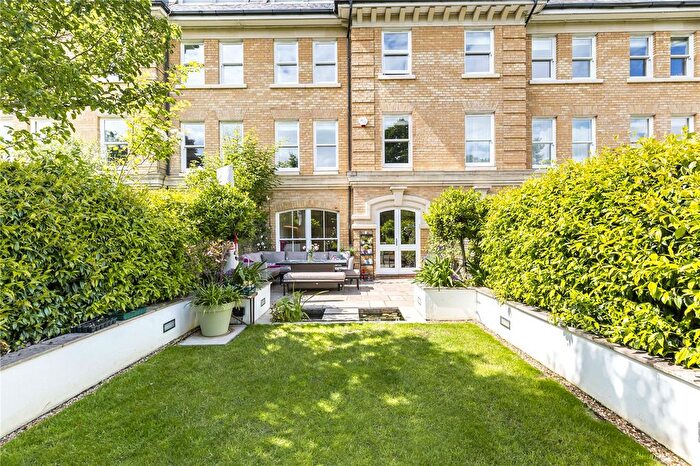
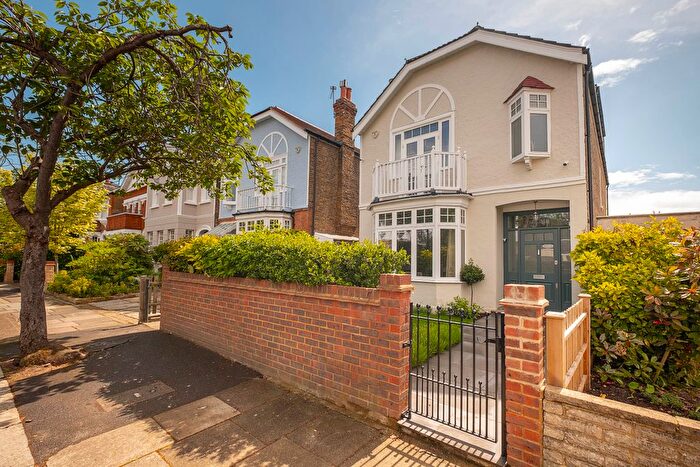
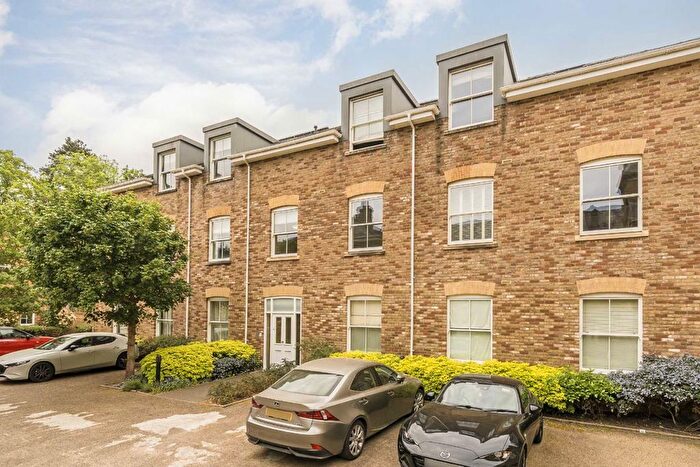
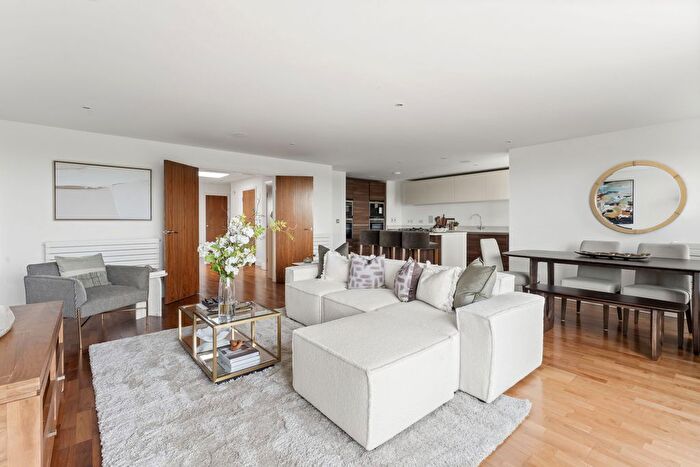
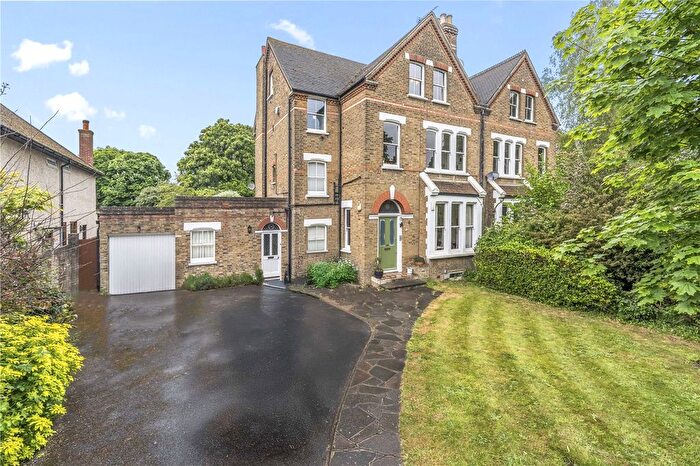
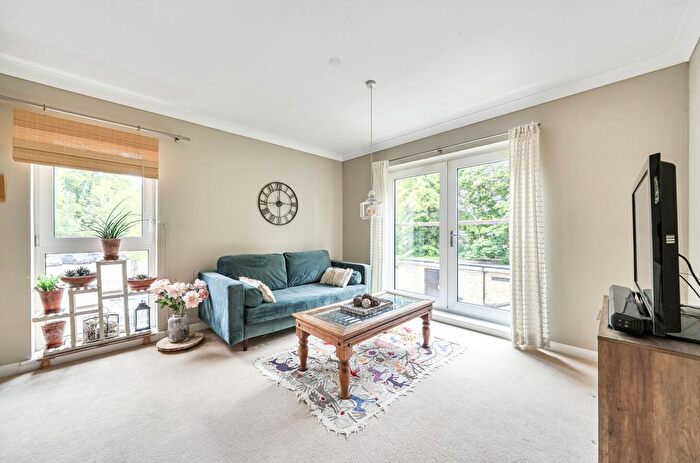
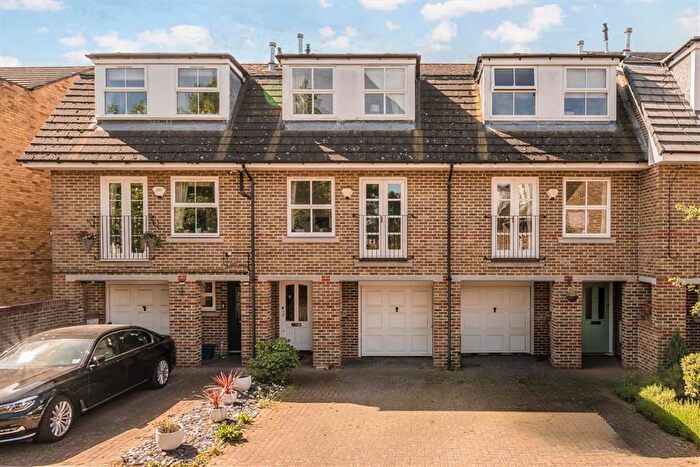
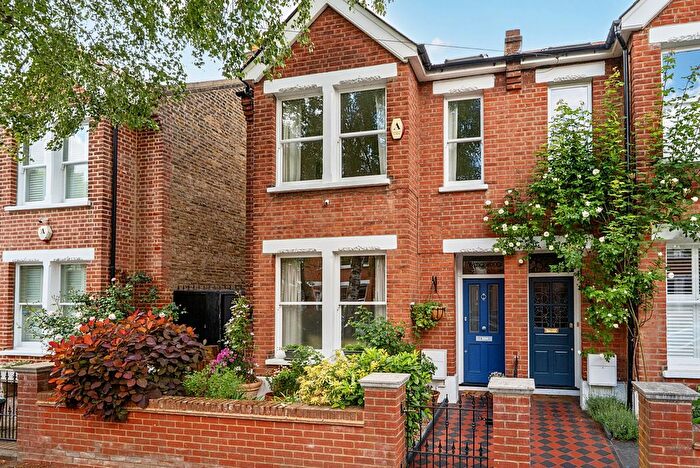
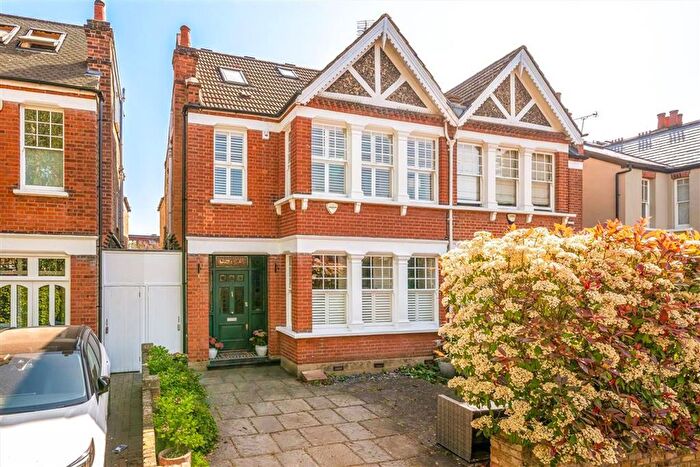
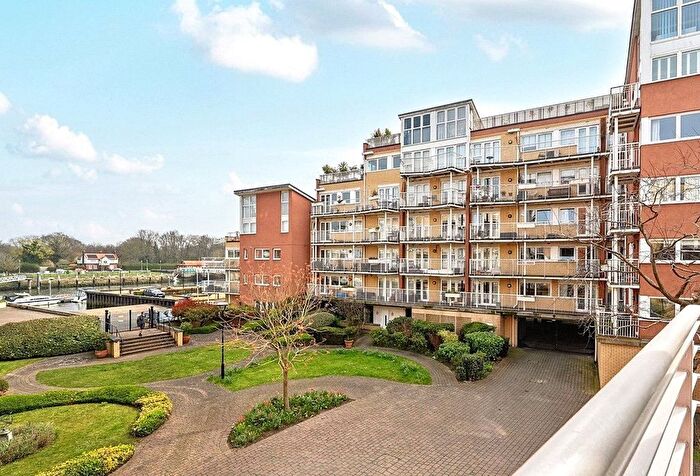
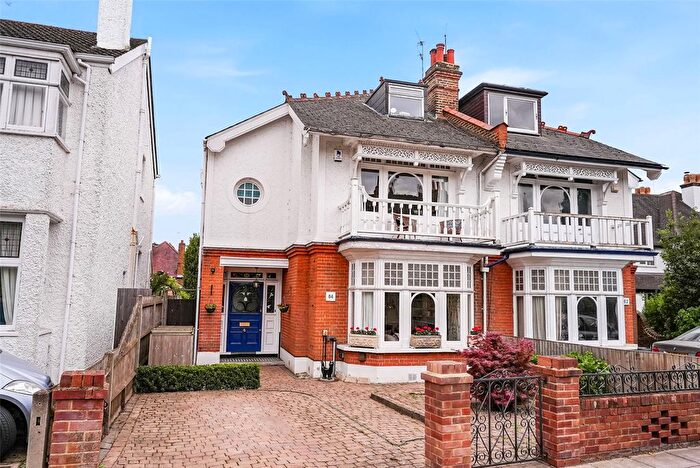
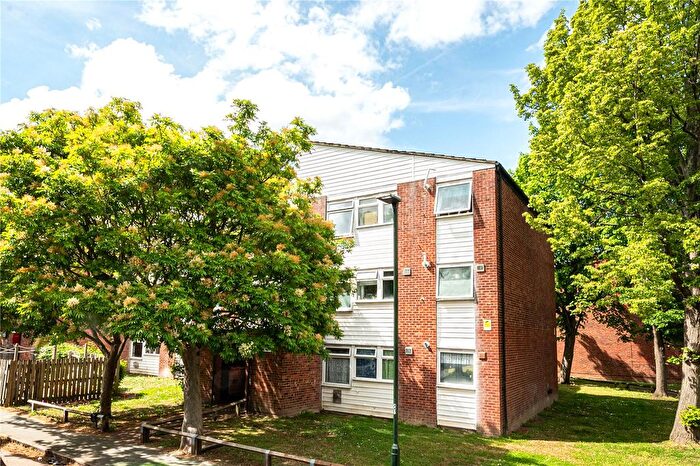
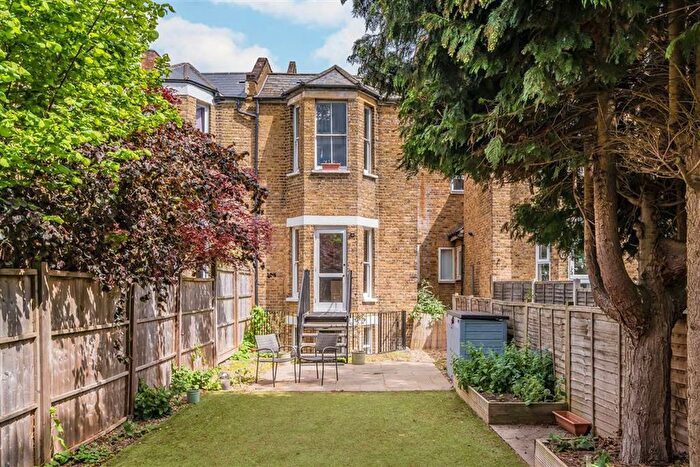
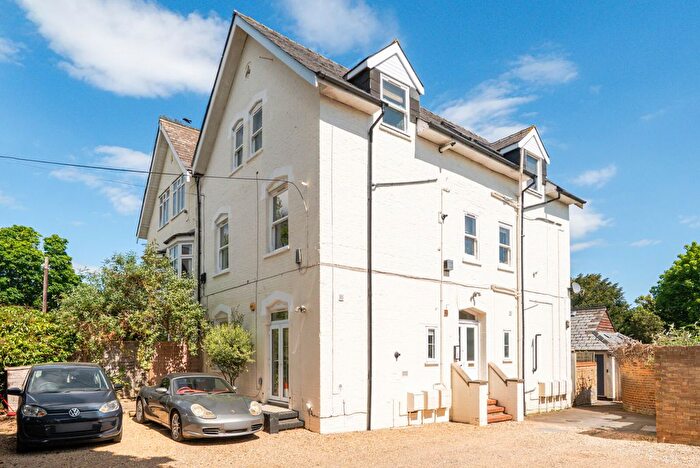
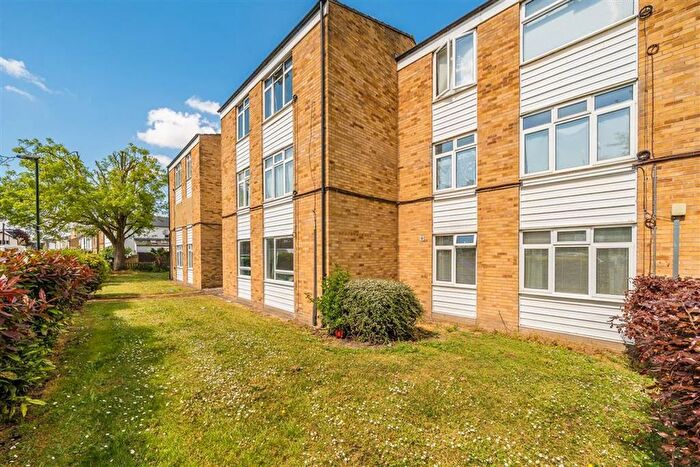
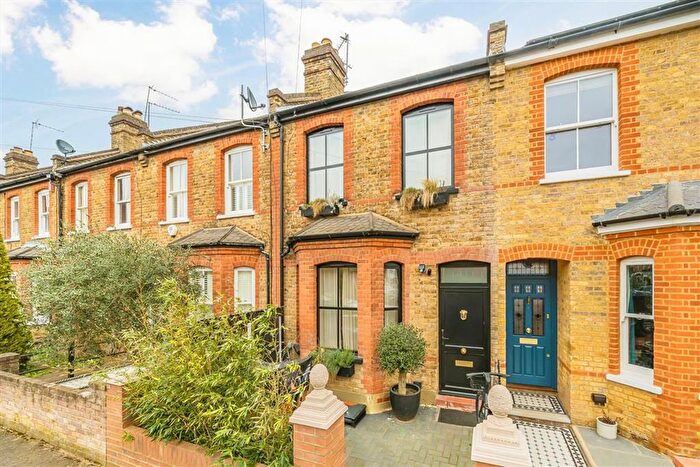
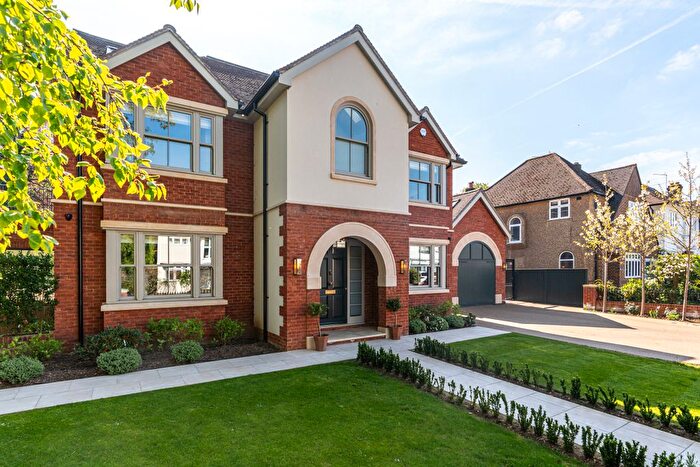
Houses and Flats for sale in TW11, Teddington
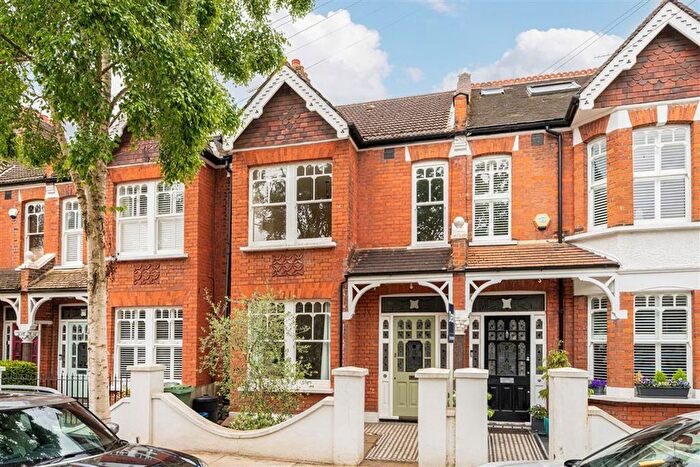
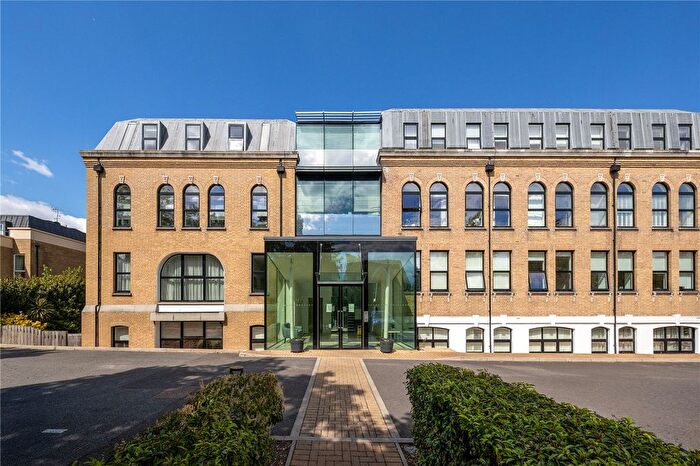
![]()
If you are looking to sell your house, let it out, or receive a property valuation, an expert can help you.
Click the button below to get started.
Frequently Asked Questions about TW11
What is the average price for a property for sale in TW11?
The average price for a property for sale in TW11 is £837,584. There are 62 property listings for sale in TW11.
Which areas are included in the TW11 postcode district?
The main area within TW11 is Teddington.
What are the most common property types in TW11?
The most common property types in TW11 are Flats, Terraced Houses, Semi Detached Houses and Detached Houses.
What has been the average sold property price in TW11 over the last three years?
Flats in TW11 have an average sold price of £531,069, while Terraced Houses have an average of £929,000. Semi Detached Houses have an average of £1,267,847 and Detached Houses have an average of £1,676,891. The average sold property price in TW11 over the last three years is approximately £770,513.
Which train stations are available in TW11?
The train station available in TW11 is Teddington Station..
Which tube stations are available in TW11?
The tube station available in TW11 is Teddington Station.