
Properties for sale in TW
Twickenham
- Info
- Price Paid By Year
- Property Type Price
House Prices in TW
Properties in TW have an average house price of £618,308 and had 19030 Property Transactions within the last 3 years.
The most expensive property was sold for £34,000,000.
Property Price Paid in TW by Year
The average sold property price by year was:
| Year | Average Sold Price | Sold Properties |
|---|---|---|
| 2026 | £595,225.00 | 2,114 Properties |
| 2025 | £614,995.00 | 6,000 Properties |
| 2024 | £609,434.00 | 5,767 Properties |
| 2023 | £641,586.00 | 5,149 Properties |
| 2022 | £620,613.00 | 6,753 Properties |
| 2021 | £586,293.00 | 8,395 Properties |
| 2020 | £577,040.00 | 5,572 Properties |
| 2019 | £545,406.00 | 6,110 Properties |
| 2018 | £536,174.00 | 6,261 Properties |
| 2017 | £527,700.00 | 6,987 Properties |
| 2016 | £506,595.00 | 7,432 Properties |
| 2015 | £475,386.00 | 8,122 Properties |
| 2014 | £437,294.00 | 8,127 Properties |
| 2013 | £415,142.00 | 7,291 Properties |
| 2012 | £396,383.00 | 6,223 Properties |
| 2011 | £374,490.00 | 5,826 Properties |
| 2010 | £365,370.00 | 6,300 Properties |
| 2009 | £338,793.00 | 4,926 Properties |
| 2008 | £339,973.00 | 5,370 Properties |
| 2007 | £342,514.00 | 10,881 Properties |
| 2006 | £307,295.00 | 11,335 Properties |
| 2005 | £286,219.00 | 8,713 Properties |
| 2004 | £276,796.00 | 10,271 Properties |
| 2003 | £256,878.00 | 10,186 Properties |
| 2002 | £233,201.00 | 11,333 Properties |
| 2001 | £208,551.00 | 10,209 Properties |
| 2000 | £185,879.00 | 9,133 Properties |
| 1999 | £165,567.00 | 10,891 Properties |
| 1998 | £143,472.00 | 9,268 Properties |
| 1997 | £118,041.00 | 10,614 Properties |
| 1996 | £106,220.00 | 9,402 Properties |
| 1995 | £98,219.00 | 7,324 Properties |
Property Price per Property Type in TW
Here you can find historic sold price data in order to help with your property search.
The average Property Paid Price for specific property types in the last three years are:
| Property Type | Average Sold Price | Sold Properties |
|---|---|---|
| Detached House | £1,062,378.00 | 1,780 Detached Houses |
| Flat | £404,368.00 | 6,867 Flats |
| Semi Detached House | £702,811.00 | 5,024 Semi Detached Houses |
| Terraced House | £665,732.00 | 5,359 Terraced Houses |
Houses and Flats for sale in TW, Twickenham

There are 4,557 results. Property prices in TW range from £185k to £4.53M with an average price of £654k.
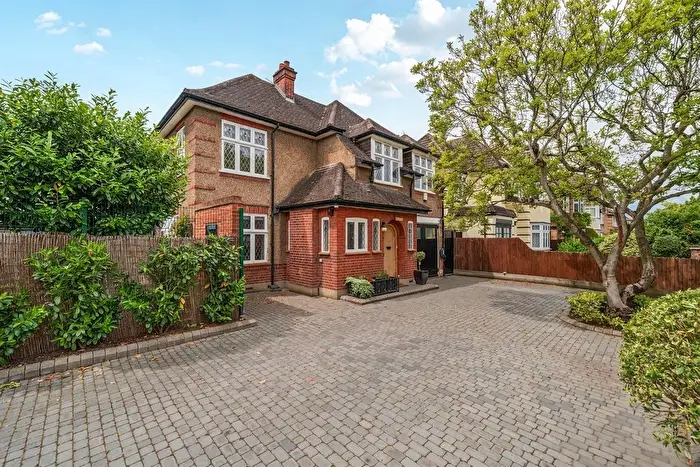

 5 Bedrooms
 4 Bathrooms


If you are looking to sell your house, let it out, or receive a property valuation, an expert can help you.
Click the button below to get started.





Postcode districts in TW, Twickenham
Navigate through our locations to find the location of your next house in TW, Twickenham, England for sale or to rent.
Transport in TW, Twickenham
Please see below transportation links in this area:
-
 Feltham Station
-
Whitton Station
-
Hounslow Station
-
 Hounslow West Station
-
Hatton Cross Station
-
Kempton Park Station
-
Hounslow Central Station
-
Fulwell Station
-
Sunbury Station
-
Hampton Station
Frequently asked questions about TW
What is the average price for a property for sale in TW?
The average price for a property for sale in TW is £618,308. This amount is 72% higher than the average price in England. There are 4,557 property listings for sale in TW.
What locations have the most expensive properties for sale in TW?
The locations with the most expensive properties for sale in TW are TW10 at an average of £1,177,018, TW9 at an average of £922,754 and TW1 at an average of £873,928.
What locations have the most affordable properties for sale in TW?
The locations with the most affordable properties for sale in TW are TW13 at an average of £394,774, TW14 at an average of £408,633 and TW3 at an average of £436,868.
Which train stations are available in or near TW?
Some of the train stations available in or near TW are Feltham, Whitton and Hounslow.
Which tube stations are available in or near TW?
Some of the tube stations available in or near TW are Hounslow West, Hatton Cross and Hounslow Central.