
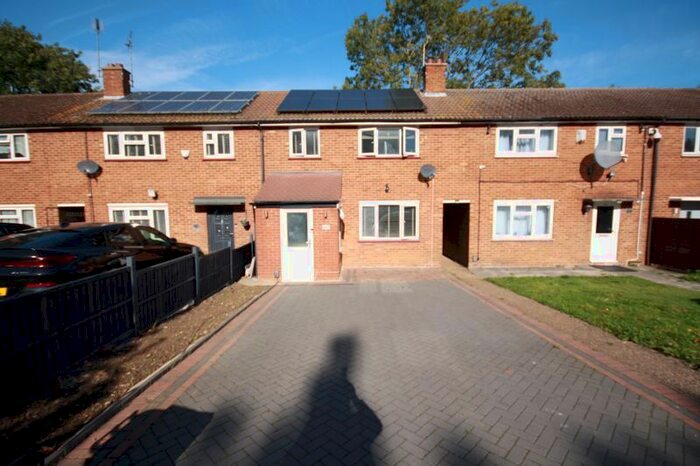
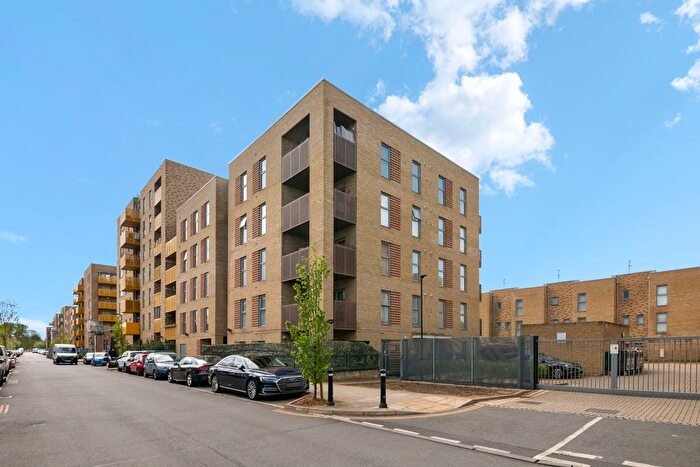
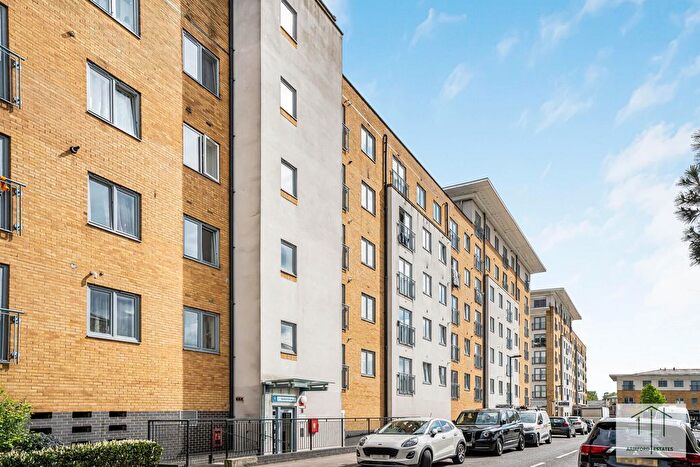
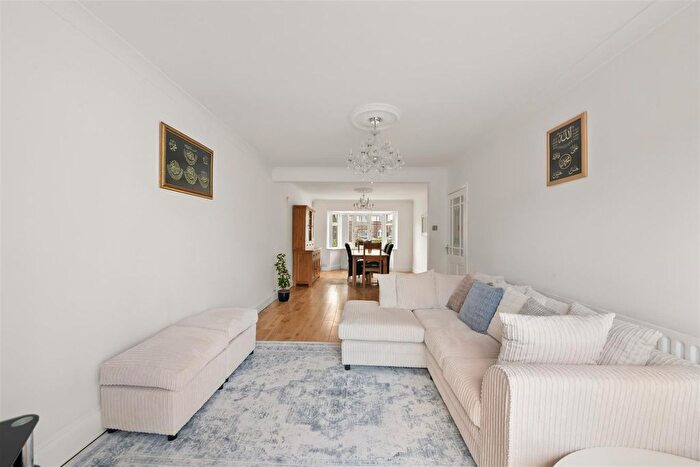
Properties for sale in UB5
Northolt
- Info
- Price Paid By Year
- Property Type Price
- Transport
House Prices in UB5
Properties in UB5 have an average house price of £394,255.00 and had 1041 Property Transactions within the last 3 years.
The most expensive property was sold for £1,100,000.00.
Property Price Paid in UB5 by Year
The average sold property price by year was:
| Year | Average Sold Price | Sold Properties |
|---|---|---|
| 2026 | £383,812.00 | 27 Properties |
| 2025 | £405,139.00 | 322 Properties |
| 2024 | £392,913.00 | 378 Properties |
| 2023 | £385,606.00 | 314 Properties |
| 2022 | £394,352.00 | 371 Properties |
| 2021 | £383,272.00 | 462 Properties |
| 2020 | £359,416.00 | 274 Properties |
| 2019 | £352,390.00 | 358 Properties |
| 2018 | £366,281.00 | 385 Properties |
| 2017 | £349,167.00 | 443 Properties |
| 2016 | £333,634.00 | 432 Properties |
| 2015 | £298,436.00 | 490 Properties |
| 2014 | £256,232.00 | 452 Properties |
| 2013 | £227,935.00 | 397 Properties |
| 2012 | £216,529.00 | 374 Properties |
| 2011 | £210,401.00 | 344 Properties |
| 2010 | £215,254.00 | 403 Properties |
| 2009 | £199,000.00 | 332 Properties |
| 2008 | £220,325.00 | 435 Properties |
| 2007 | £212,011.00 | 905 Properties |
| 2006 | £199,502.00 | 917 Properties |
| 2005 | £197,719.00 | 830 Properties |
| 2004 | £185,871.00 | 800 Properties |
| 2003 | £174,876.00 | 919 Properties |
| 2002 | £144,983.00 | 819 Properties |
| 2001 | £118,346.00 | 854 Properties |
| 2000 | £102,855.00 | 757 Properties |
| 1999 | £90,820.00 | 811 Properties |
| 1998 | £73,678.00 | 768 Properties |
| 1997 | £68,577.00 | 667 Properties |
| 1996 | £59,656.00 | 534 Properties |
| 1995 | £58,078.00 | 431 Properties |
Property Price per Property Type in UB5
Here you can find historic sold price data in order to help with your property search.
The average Property Paid Price for specific property types in the last three years are:
| Property Type | Average Sold Price | Sold Properties |
|---|---|---|
| Semi Detached House | £513,195.00 | 300 Semi Detached Houses |
| Detached House | £574,076.00 | 13 Detached Houses |
| Terraced House | £463,445.00 | 281 Terraced Houses |
| Flat | £265,704.00 | 447 Flats |


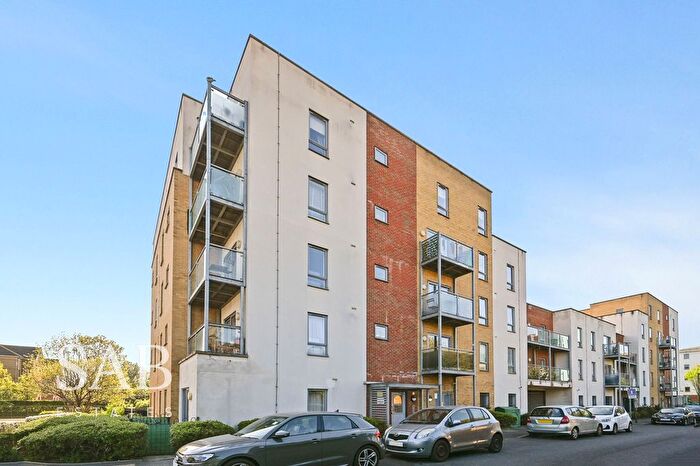
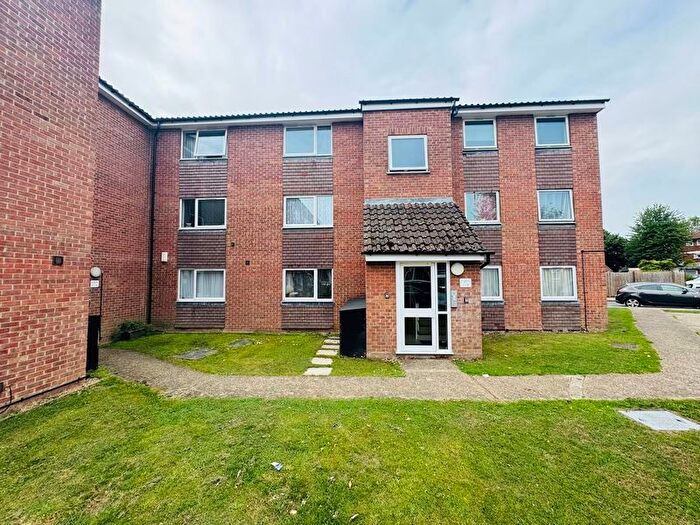
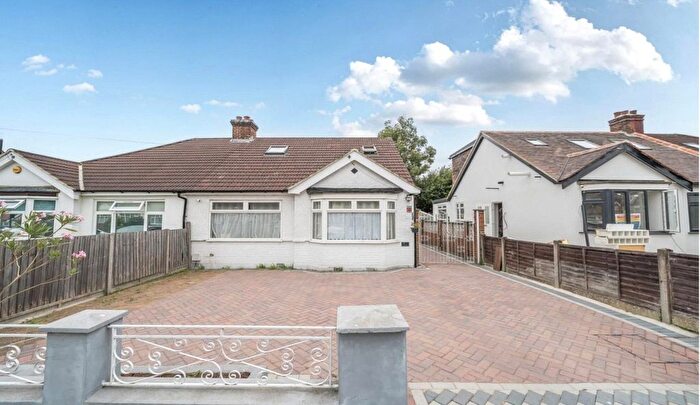
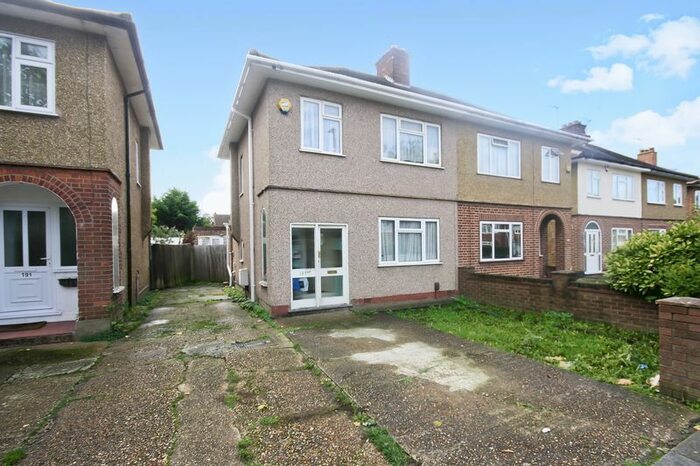
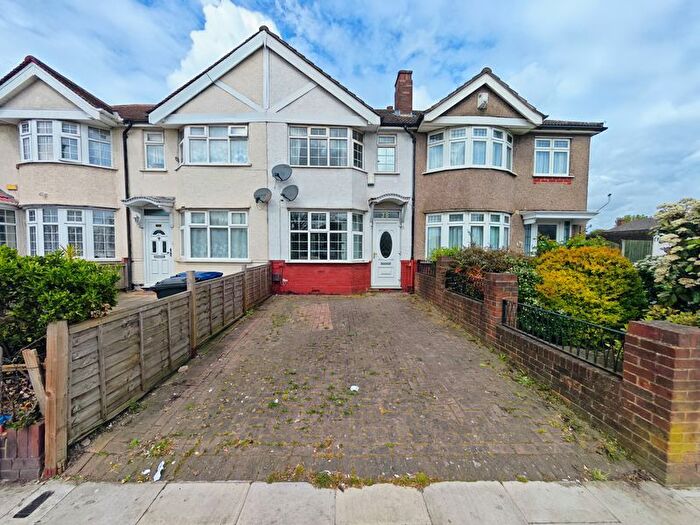
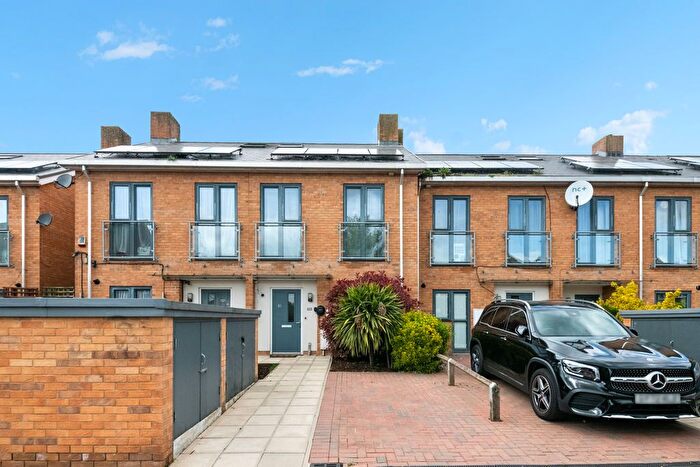
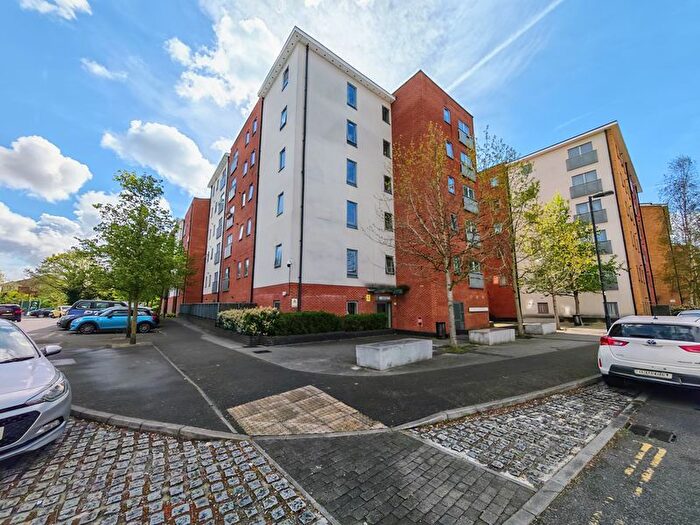
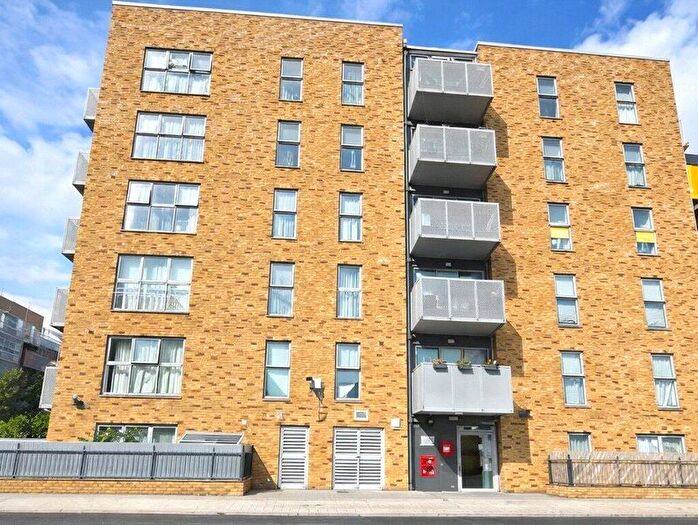
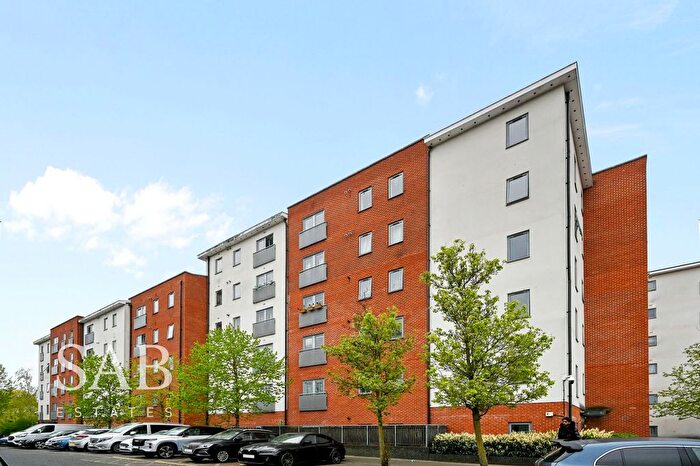
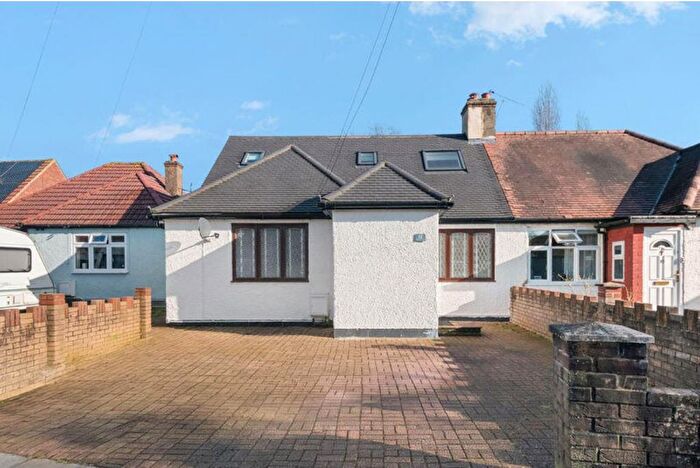
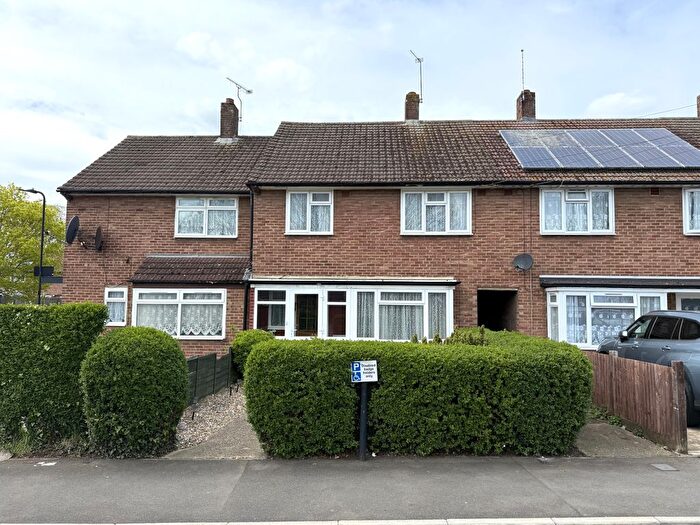
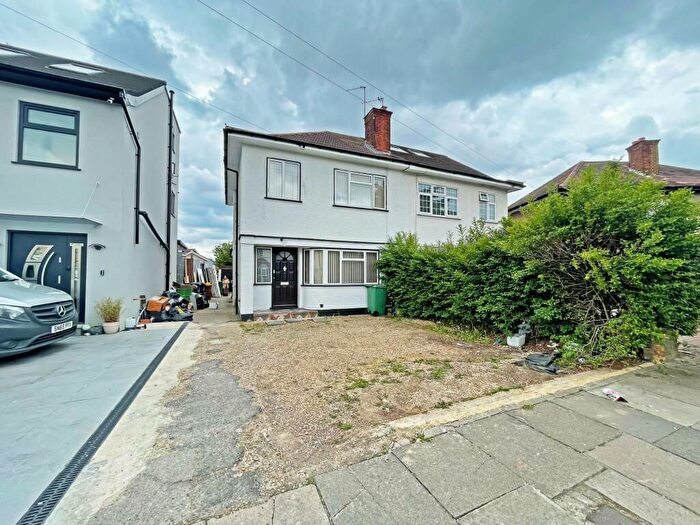
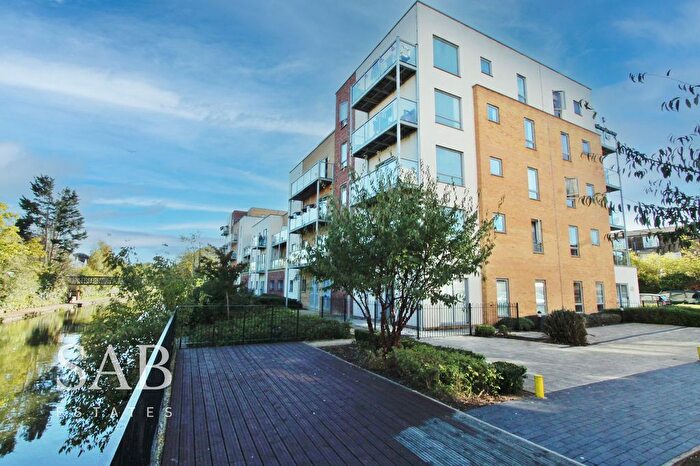
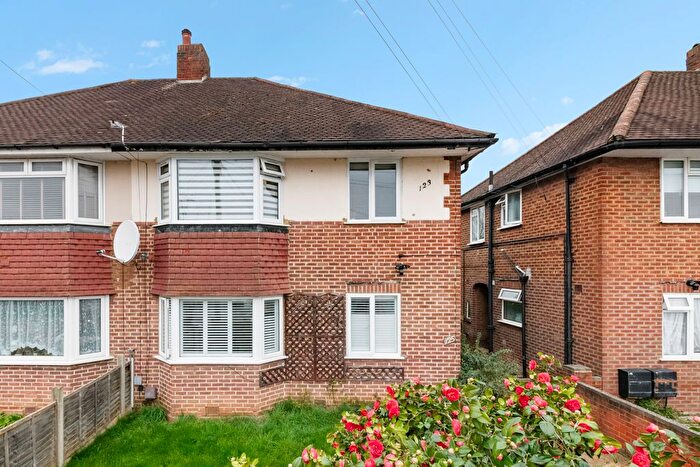
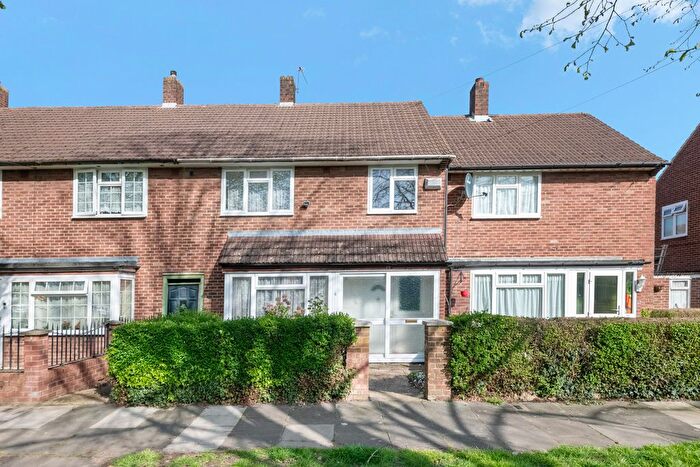
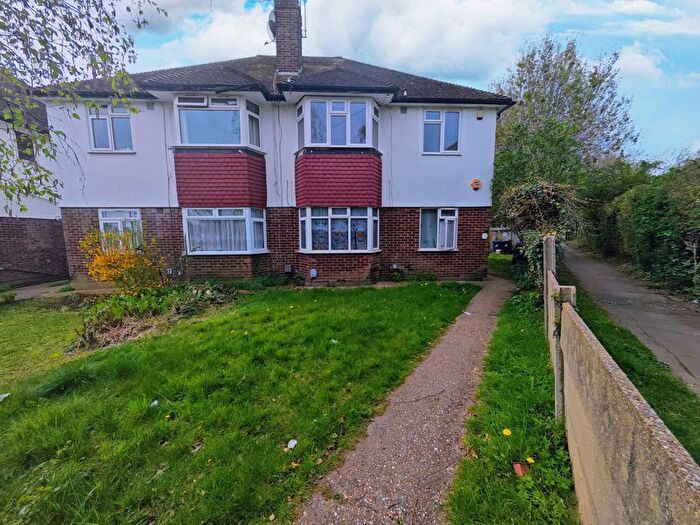
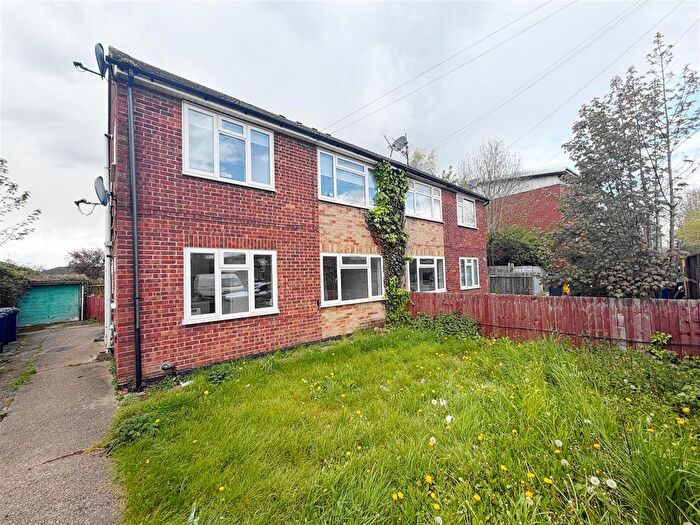
Houses and Flats for sale in UB5, Northolt
![]()
If you are looking to sell your house, let it out, or receive a property valuation, an expert can help you.
Click the button below to get started.
Frequently Asked Questions about UB5
What is the average price for a property for sale in UB5?
The average price for a property for sale in UB5 is £394,255. There are 83 property listings for sale in UB5.
Which areas are included in the UB5 postcode district?
The main area within UB5 is Northolt.
What are the most common property types in UB5?
The most common property types in UB5 are Flats, Semi Detached Houses, Terraced Houses and Detached Houses.
What has been the average sold property price in UB5 over the last three years?
Flats in UB5 have an average sold price of £265,704, while Semi Detached Houses have an average of £513,195. Terraced Houses have an average of £463,445 and Detached Houses have an average of £574,076. The average sold property price in UB5 over the last three years is approximately £393,955.
Which train stations are available in UB5?
The train station available in UB5 is Northolt Park Station..
Which tube stations are available in UB5?
The tube stations available in UB5 are Northolt Station and Northolt Park Station.