
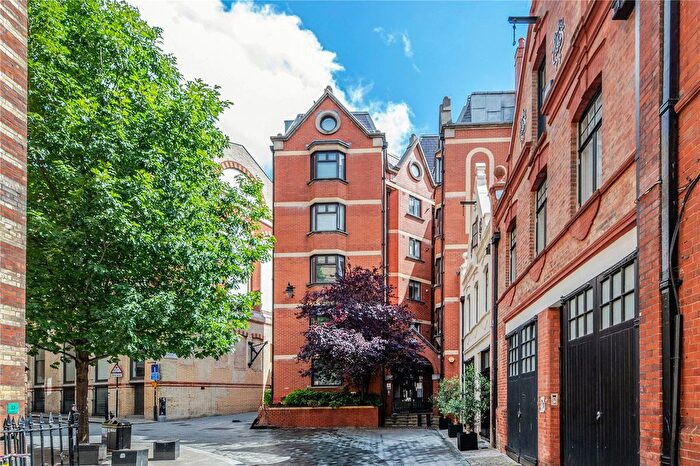
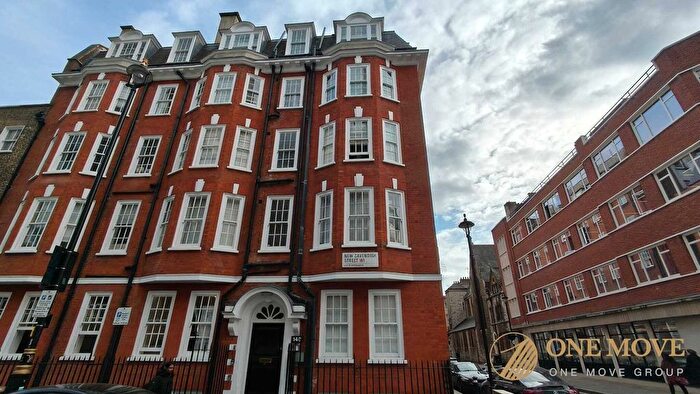
Properties for sale in W1K
Mayfair, Grosvenor Square
- Info
- Price Paid By Year
- Property Type Price
- Transport
House Prices in W1K
Properties in W1K have an average house price of £5,613,486.00 and had 152 Property Transactions within the last 3 years.
The most expensive property was sold for £34,675,400.00.
Property Price Paid in W1K by Year
The average sold property price by year was:
| Year | Average Sold Price | Sold Properties |
|---|---|---|
| 2025 | £4,269,351.00 | 27 Properties |
| 2024 | £5,852,844.00 | 66 Properties |
| 2023 | £5,960,842.00 | 59 Properties |
| 2022 | £7,991,118.00 | 89 Properties |
| 2021 | £6,258,900.00 | 72 Properties |
| 2020 | £8,707,442.00 | 96 Properties |
| 2019 | £9,236,413.00 | 67 Properties |
| 2018 | £4,486,962.00 | 49 Properties |
| 2017 | £4,306,394.00 | 52 Properties |
| 2016 | £4,313,864.00 | 79 Properties |
| 2015 | £3,359,718.00 | 77 Properties |
| 2014 | £3,616,564.00 | 57 Properties |
| 2013 | £3,179,239.00 | 62 Properties |
| 2012 | £3,602,077.00 | 29 Properties |
| 2011 | £1,926,271.00 | 42 Properties |
| 2010 | £1,228,707.00 | 73 Properties |
| 2009 | £1,675,232.00 | 44 Properties |
| 2008 | £1,373,219.00 | 52 Properties |
| 2007 | £1,115,875.00 | 102 Properties |
| 2006 | £1,014,760.00 | 116 Properties |
| 2005 | £827,563.00 | 81 Properties |
| 2004 | £941,656.00 | 110 Properties |
| 2003 | £909,991.00 | 102 Properties |
| 2002 | £692,685.00 | 111 Properties |
| 2001 | £668,488.00 | 156 Properties |
| 2000 | £678,982.00 | 164 Properties |
| 1999 | £582,506.00 | 130 Properties |
| 1998 | £787,954.00 | 113 Properties |
| 1997 | £495,222.00 | 103 Properties |
| 1996 | £366,171.00 | 62 Properties |
| 1995 | £364,584.00 | 72 Properties |
Property Price per Property Type in W1K
Here you can find historic sold price data in order to help with your property search.
The average Property Paid Price for specific property types in the last three years are:
| Property Type | Average Sold Price | Sold Properties |
|---|---|---|
| Terraced House | £10,598,076.00 | 13 Terraced Houses |
| Flat | £4,903,672.00 | 136 Flats |
| Detached House | £19,687,700.00 | 2 Detached Houses |
| Semi Detached House | £9,200,000.00 | 1 Semi Detached Houses |


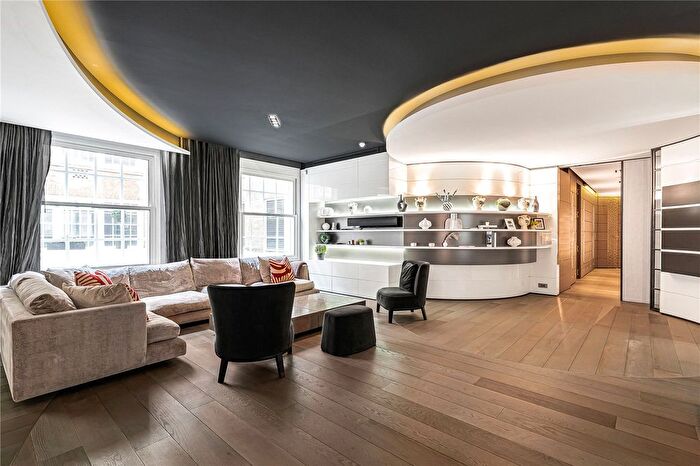
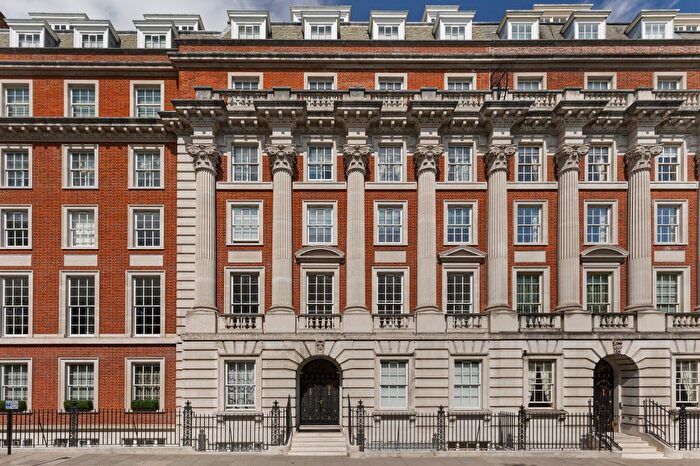
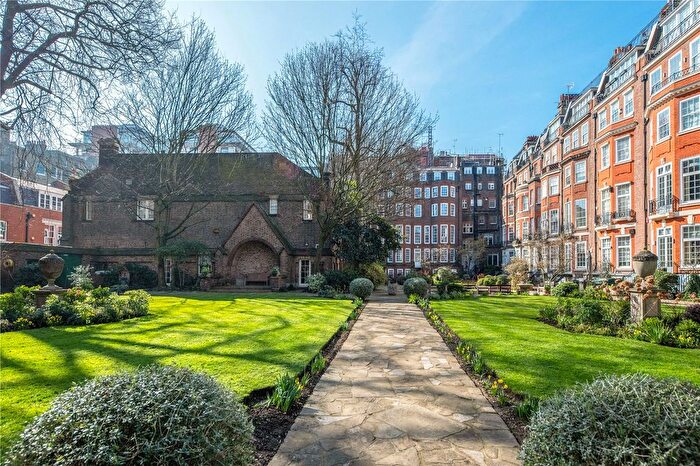
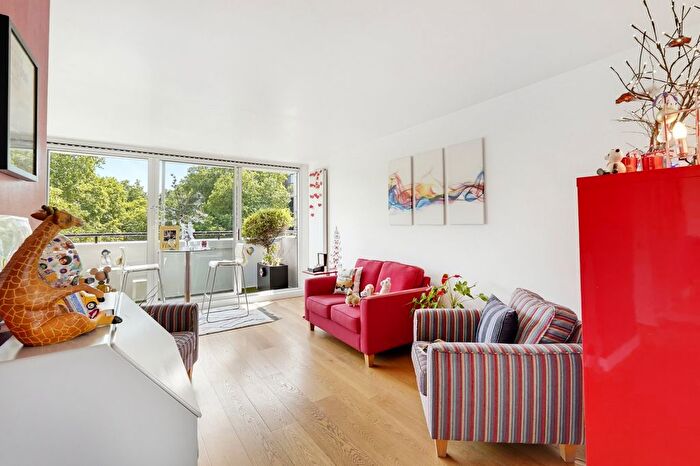
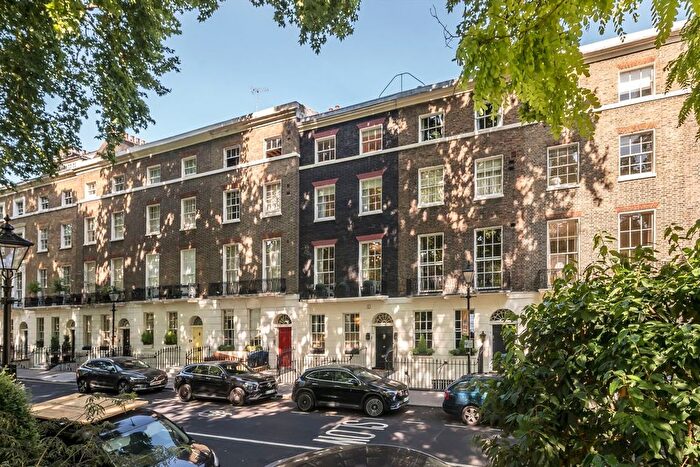
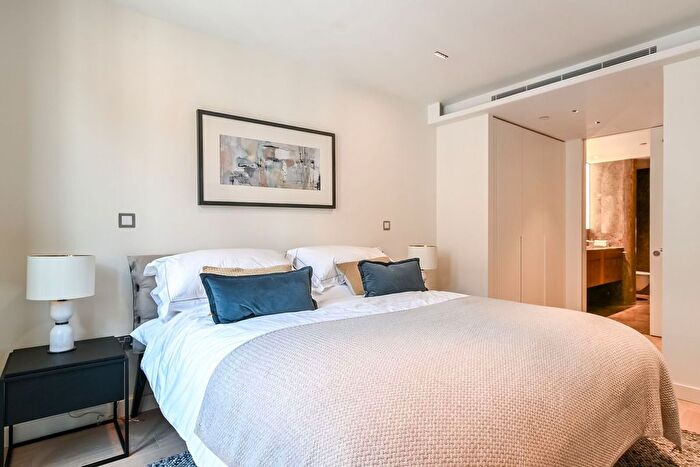
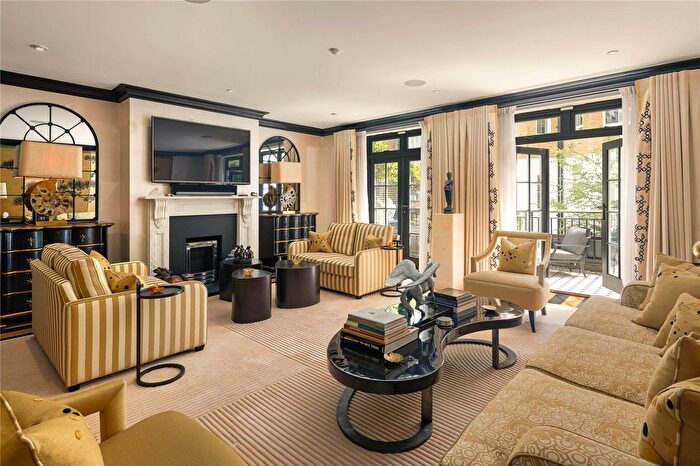
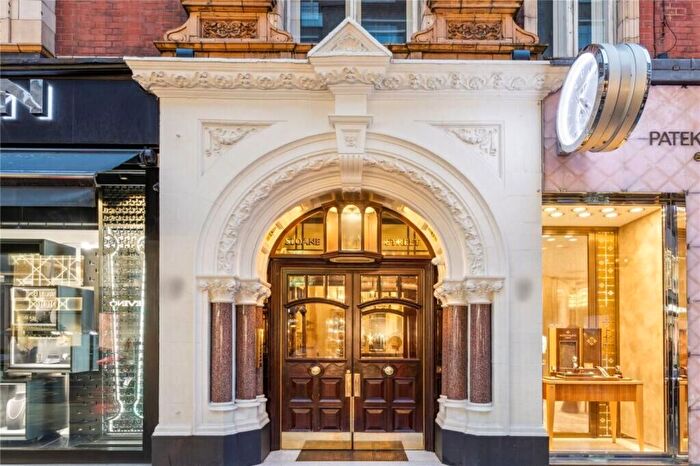
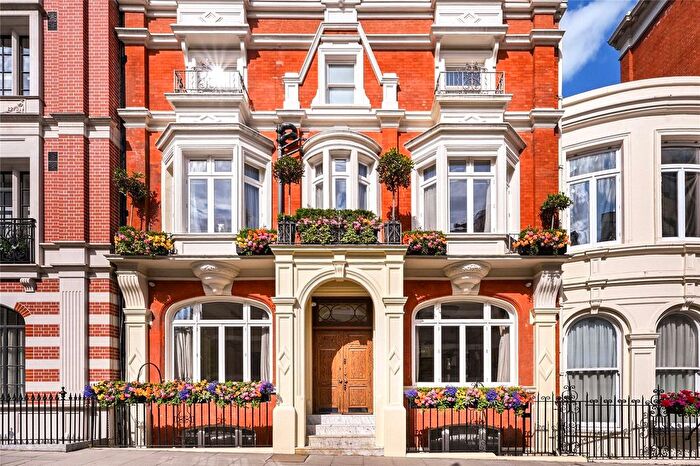
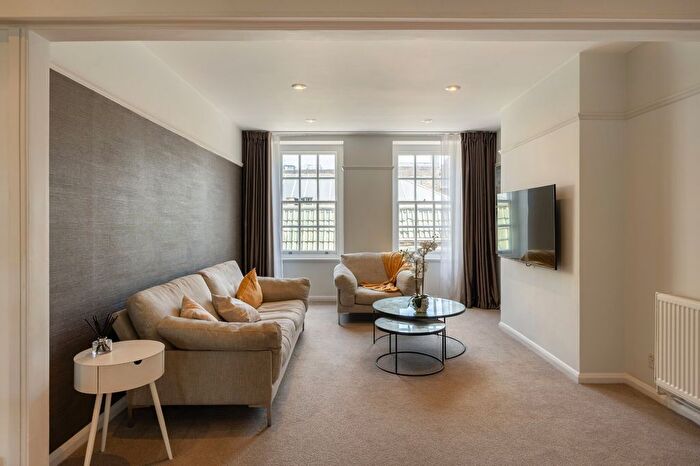
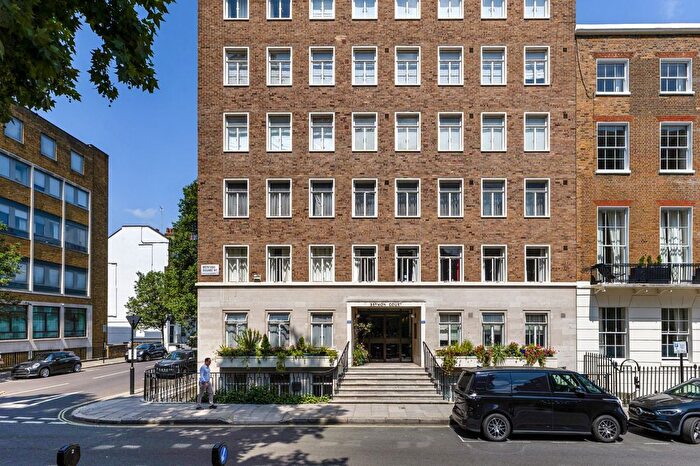
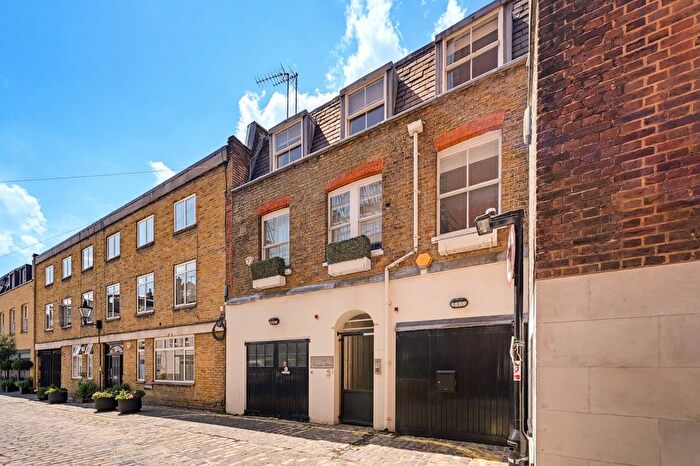
Houses and Flats for sale in W1K, Mayfair, Grosvenor Square
There are 104 results. Property prices in W1K range from £1.2M to £9.5M with an average price of £4.94M.

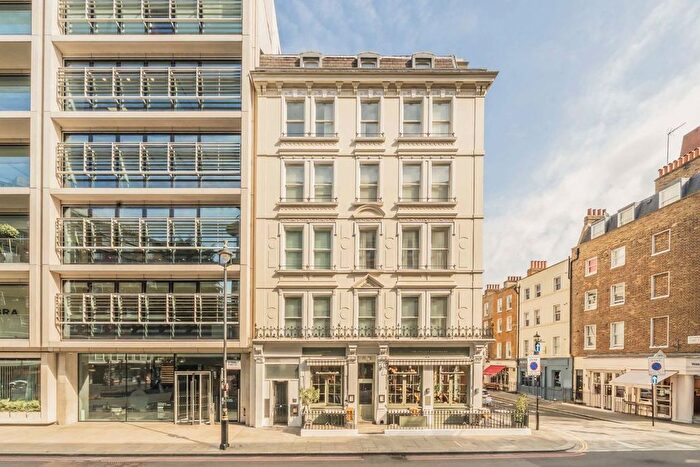
Properties for sale near W1K
![]()
If you are looking to sell your house, let it out, or receive a property valuation, an expert can help you.
Click the button below to get started.

Frequently Asked Questions about W1K
What is the average price for a property for sale in W1K?
The average price for a property for sale in W1K is £5,613,486. There are 5 property listings for sale in W1K.
Which areas are included in the W1K postcode district?
The main areas within W1K include Mayfair (north) and Grosvenor Square.
What are the most common property types in W1K?
The most common property types in W1K are Flats, Terraced Houses, Detached Houses and Semi Detached Houses.
What has been the average sold property price in W1K over the last three years?
Flats in W1K have an average sold price of £4,903,672, while Terraced Houses have an average of £10,598,076. Detached Houses have an average of £19,687,700 and Semi Detached Houses have an average of £9,200,000. The average sold property price in W1K over the last three years is approximately £5,361,012.