
Properties for sale in YO11
Cayton
- Info
- Price Paid By Year
- Property Type Price
- Transport
House Prices in YO11
Properties in YO11 have an average house price of £175,782.00 and had 1395 Property Transactions within the last 3 years.
The most expensive property was sold for £1,059,994.00.
Property Price Paid in YO11 by Year
The average sold property price by year was:
| Year | Average Sold Price | Sold Properties |
|---|---|---|
| 2026 | £168,290.00 | 10 Properties |
| 2025 | £170,790.00 | 413 Properties |
| 2024 | £176,884.00 | 494 Properties |
| 2023 | £179,113.00 | 478 Properties |
| 2022 | £180,866.00 | 608 Properties |
| 2021 | £164,814.00 | 668 Properties |
| 2020 | £161,574.00 | 542 Properties |
| 2019 | £157,959.00 | 613 Properties |
| 2018 | £142,951.00 | 560 Properties |
| 2017 | £143,785.00 | 545 Properties |
| 2016 | £131,310.00 | 602 Properties |
| 2015 | £142,120.00 | 548 Properties |
| 2014 | £126,277.00 | 443 Properties |
| 2013 | £133,834.00 | 438 Properties |
| 2012 | £124,672.00 | 287 Properties |
| 2011 | £132,174.00 | 288 Properties |
| 2010 | £136,444.00 | 271 Properties |
| 2009 | £132,172.00 | 285 Properties |
| 2008 | £140,695.00 | 365 Properties |
| 2007 | £140,244.00 | 678 Properties |
| 2006 | £131,816.00 | 688 Properties |
| 2005 | £130,617.00 | 504 Properties |
| 2004 | £122,640.00 | 627 Properties |
| 2003 | £96,318.00 | 716 Properties |
| 2002 | £78,722.00 | 874 Properties |
| 2001 | £62,400.00 | 664 Properties |
| 2000 | £56,193.00 | 616 Properties |
| 1999 | £53,566.00 | 541 Properties |
| 1998 | £52,234.00 | 475 Properties |
| 1997 | £54,095.00 | 484 Properties |
| 1996 | £47,783.00 | 395 Properties |
| 1995 | £49,557.00 | 379 Properties |
Property Price per Property Type in YO11
Here you can find historic sold price data in order to help with your property search.
The average Property Paid Price for specific property types in the last three years are:
| Property Type | Average Sold Price | Sold Properties |
|---|---|---|
| Semi Detached House | £196,096.00 | 384 Semi Detached Houses |
| Detached House | £320,052.00 | 153 Detached Houses |
| Terraced House | £165,390.00 | 268 Terraced Houses |
| Flat | £129,868.00 | 590 Flats |
Transport near YO11

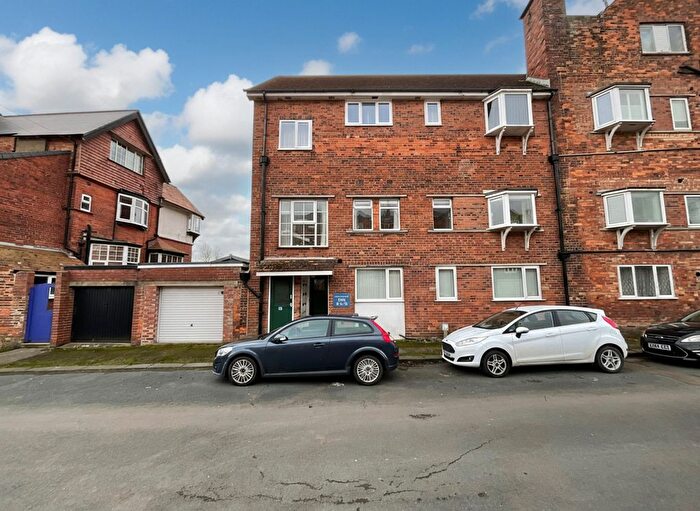
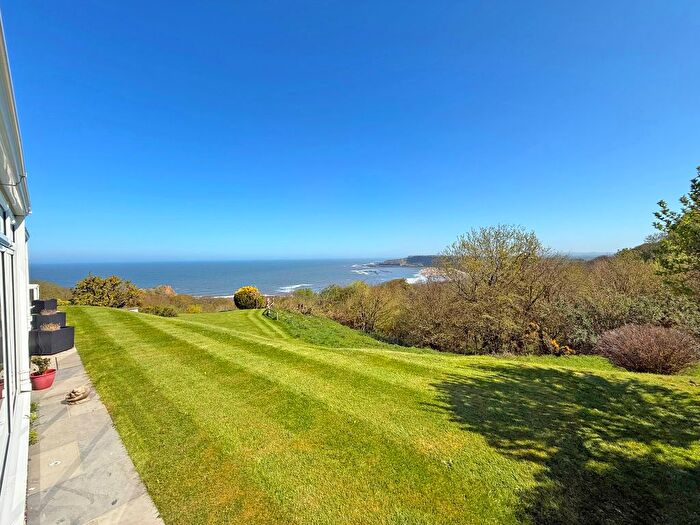
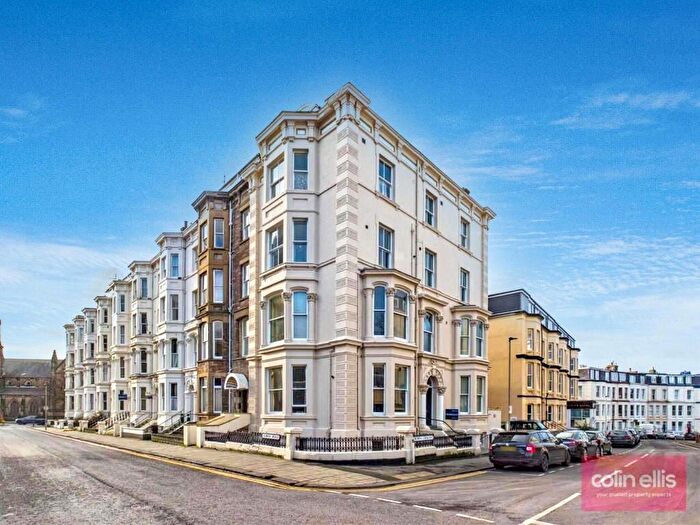
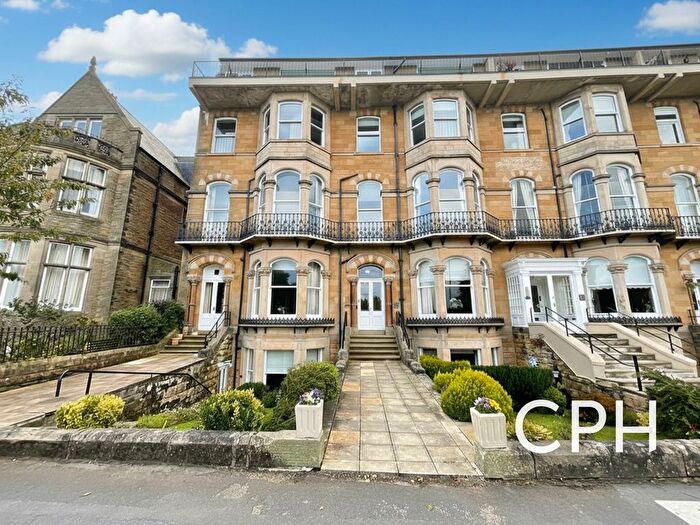
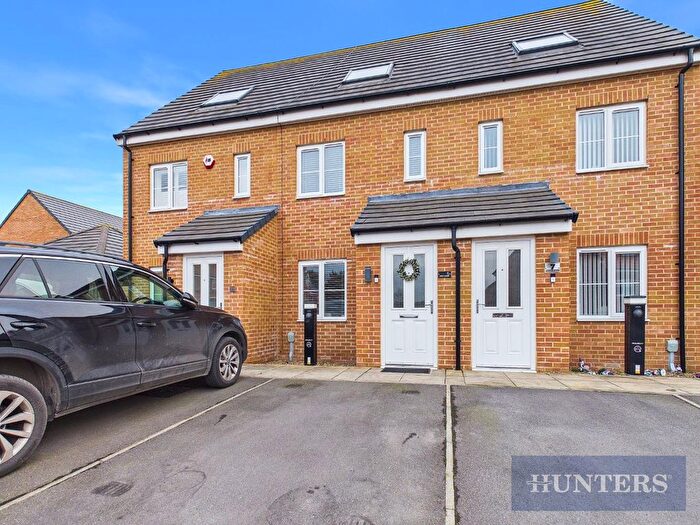
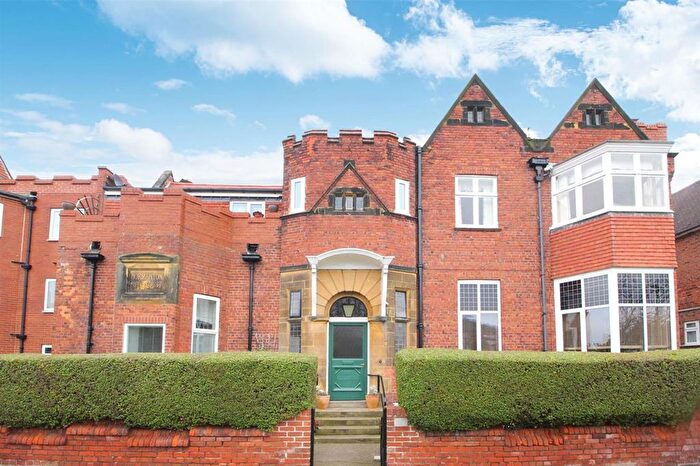
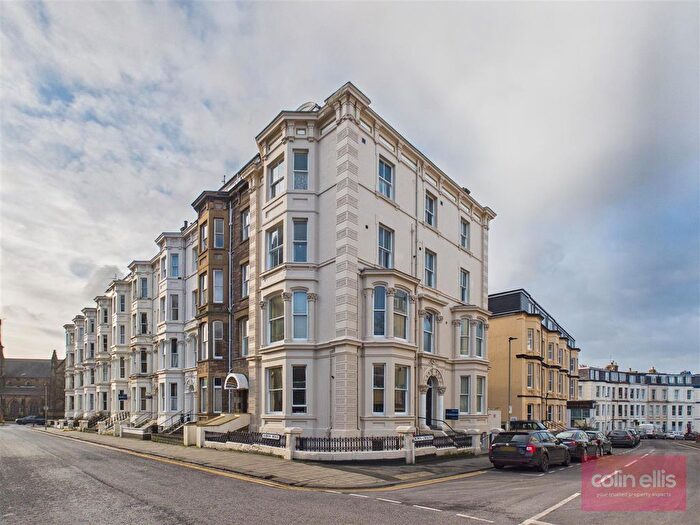
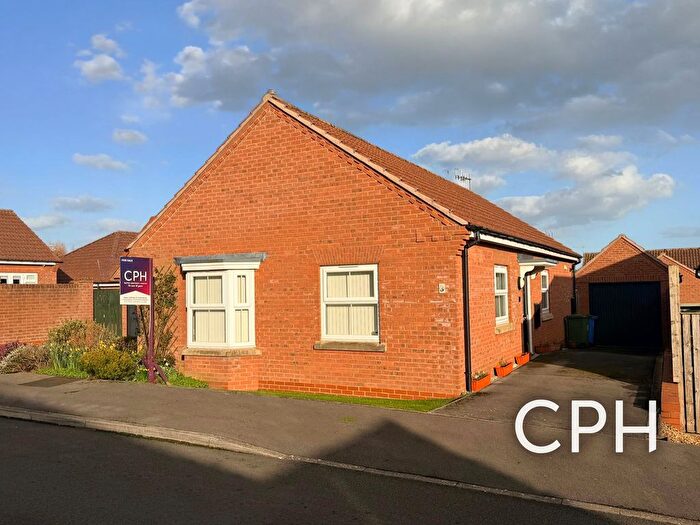
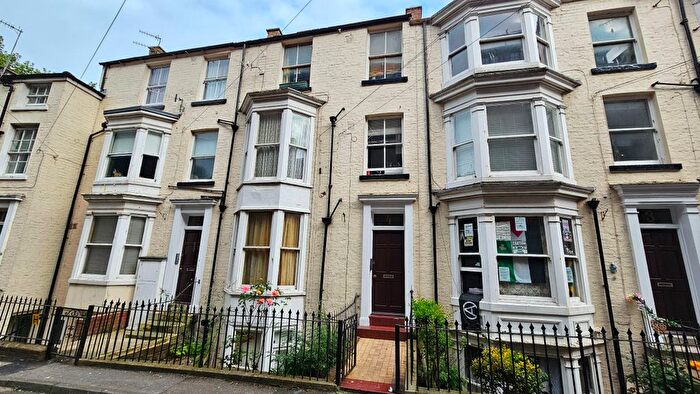
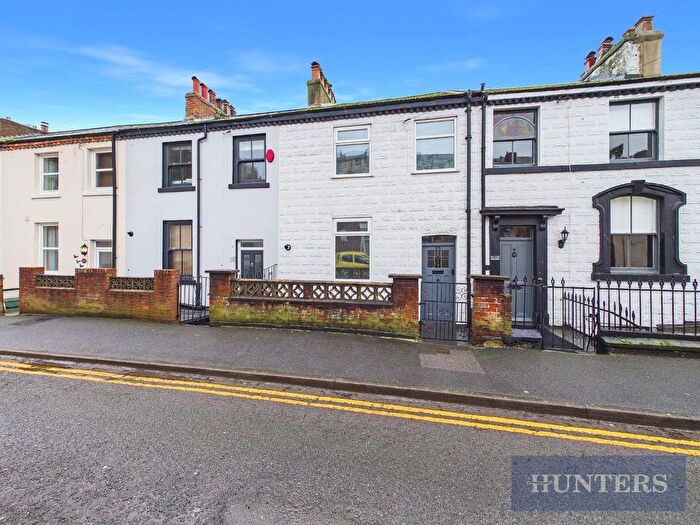
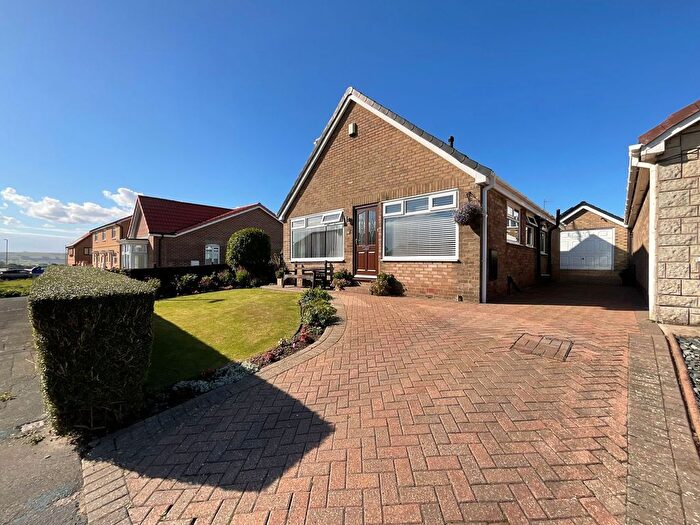
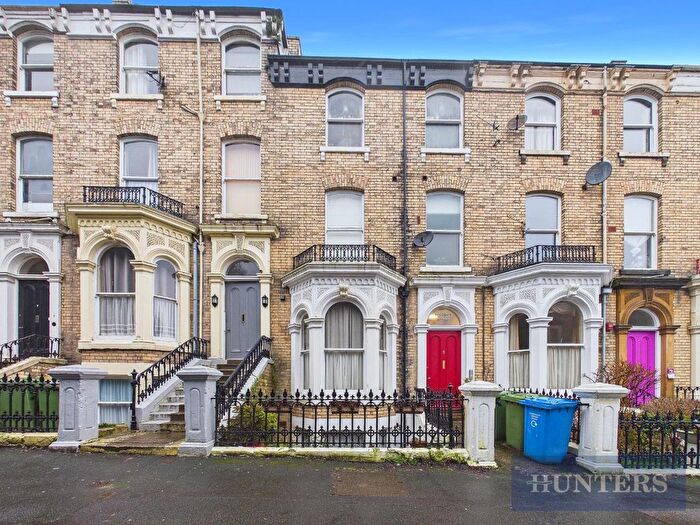
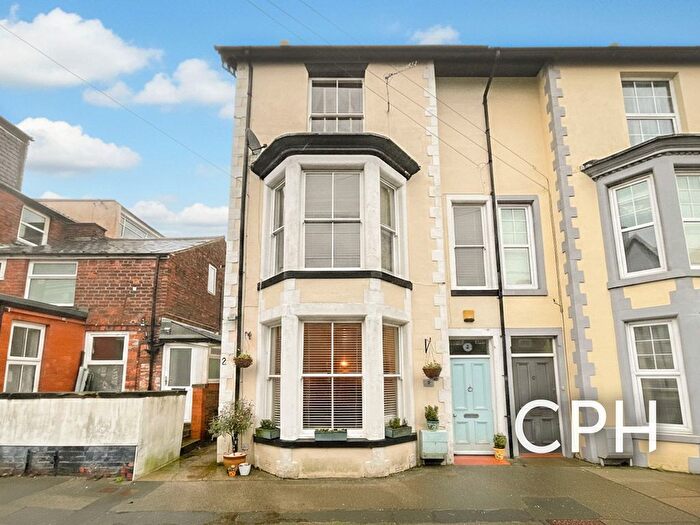
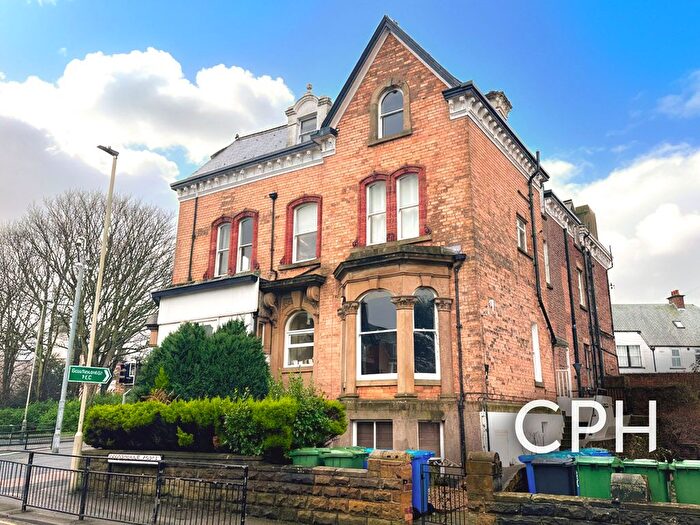
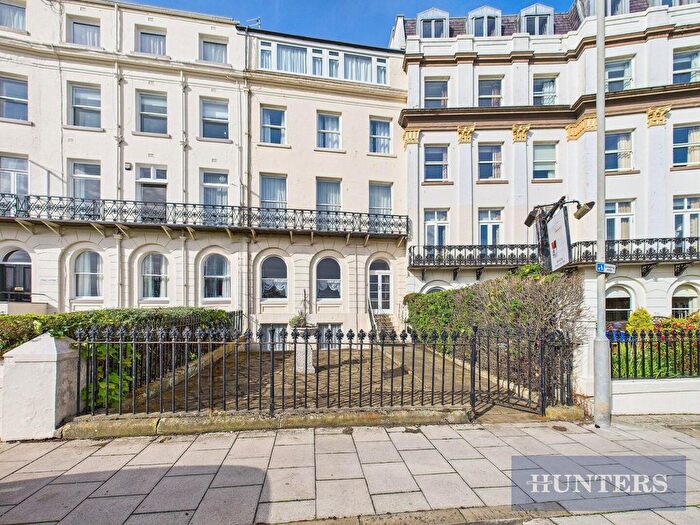
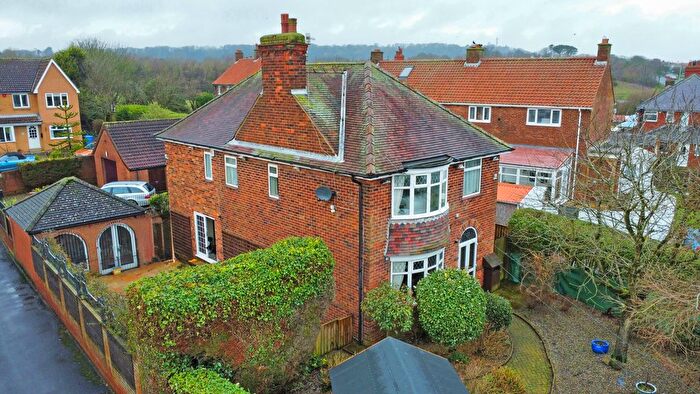
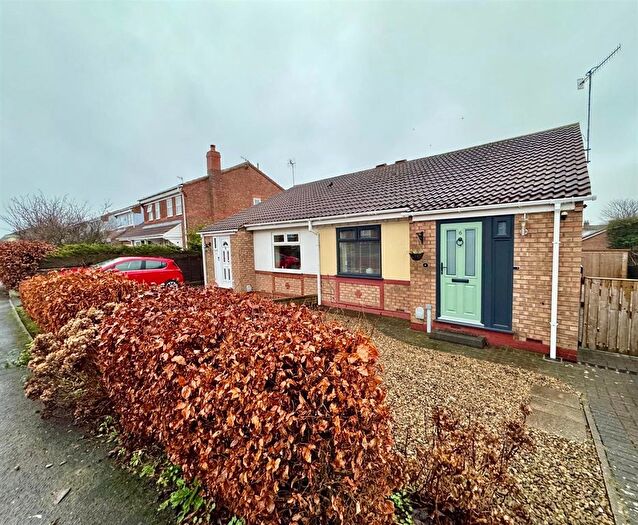
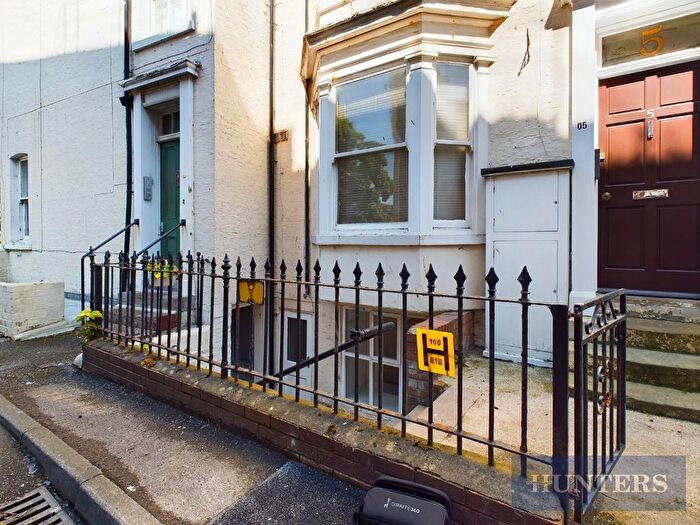
Houses and Flats for sale in YO11, Cayton
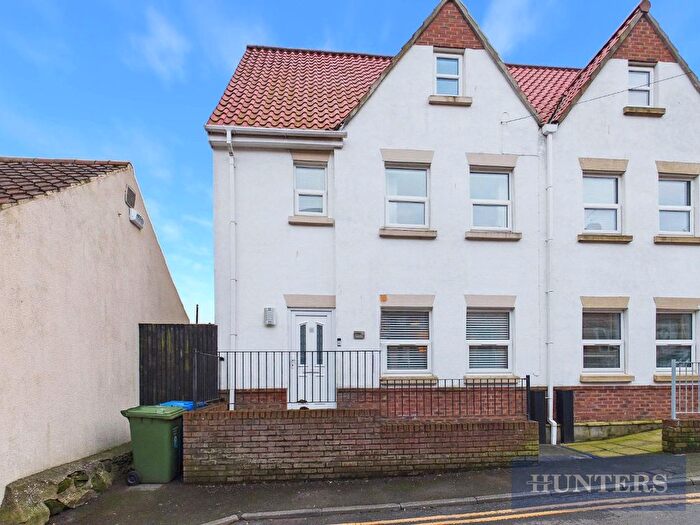
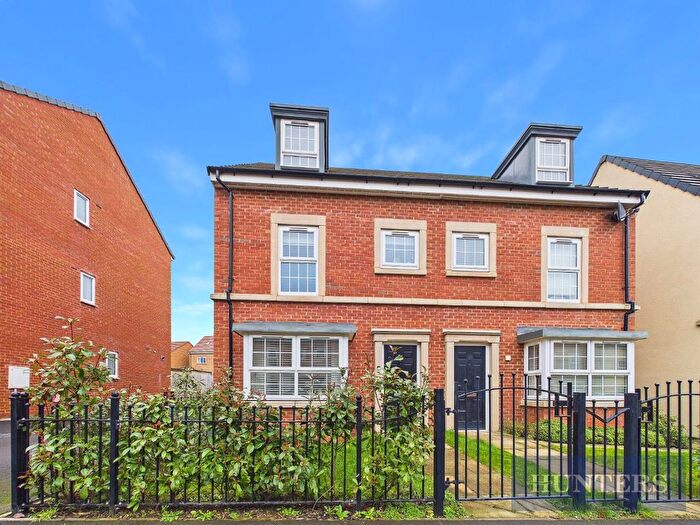
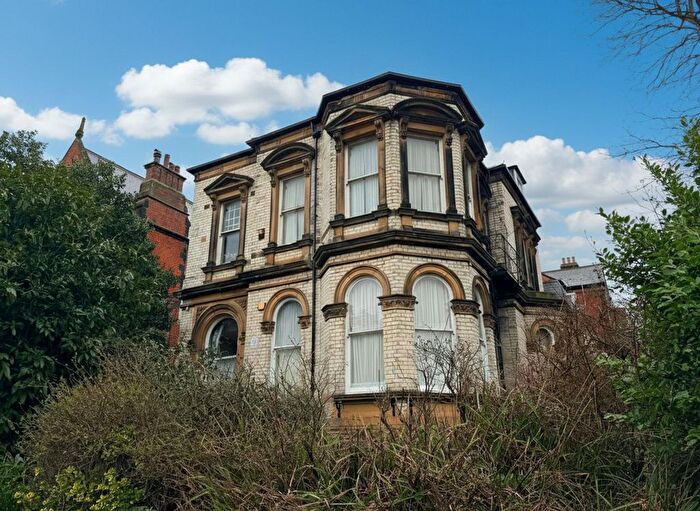
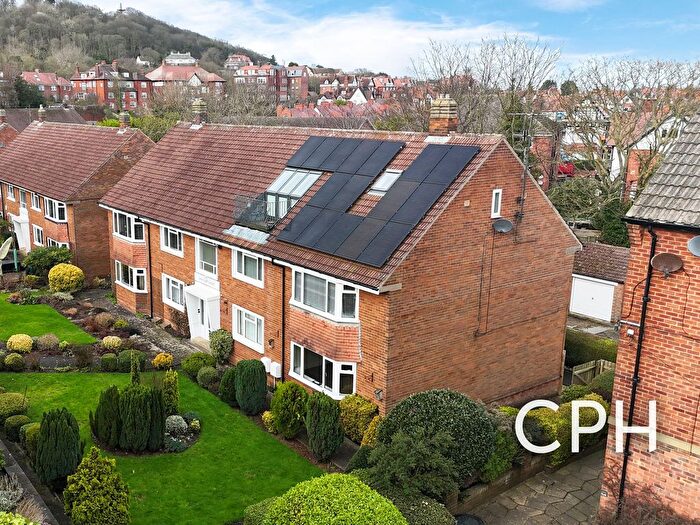
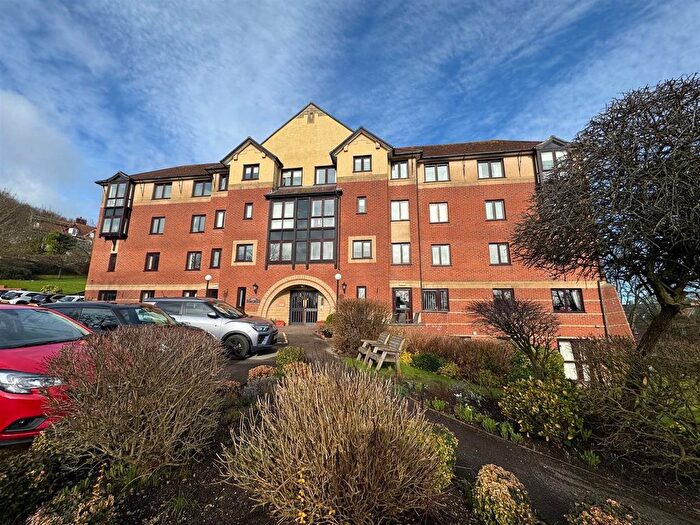
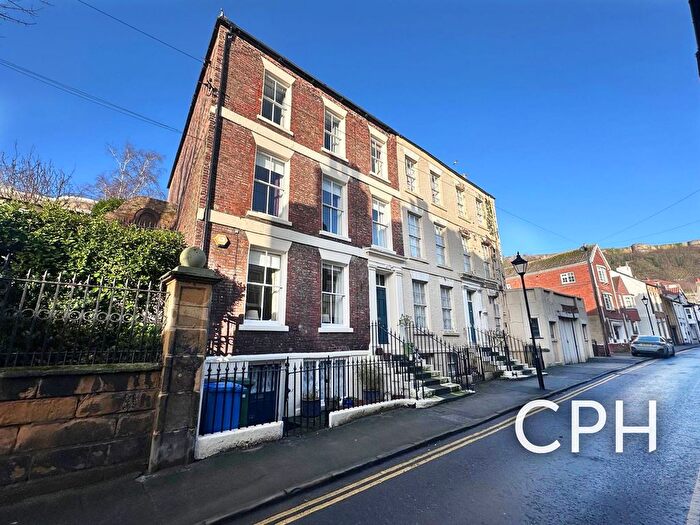
![]()
If you are looking to sell your house, let it out, or receive a property valuation, an expert can help you.
Click the button below to get started.
Frequently Asked Questions about YO11
What is the average price for a property for sale in YO11?
The average price for a property for sale in YO11 is £175,782. There are 121 property listings for sale in YO11.
Which areas are included in the YO11 postcode district?
The main area within YO11 is Cayton.
What are the most common property types in YO11?
The most common property types in YO11 are Flats, Semi Detached Houses, Terraced Houses and Detached Houses.
What has been the average sold property price in YO11 over the last three years?
Flats in YO11 have an average sold price of £129,868, while Semi Detached Houses have an average of £196,096. Terraced Houses have an average of £165,390 and Detached Houses have an average of £320,052. The average sold property price in YO11 over the last three years is approximately £171,988.
Which train stations are available in YO11?
The train station available in YO11 is Scarborough Station..