Properties for sale in YO25
Driffield
- Info
- Price Paid By Year
- Property Type Price
- Transport
House Prices in YO25
Properties in YO25 have an average house price of £239,728.00 and had 2315 Property Transactions within the last 3 years.
The most expensive property was sold for £1,300,000.00.
Property Price Paid in YO25 by Year
The average sold property price by year was:
| Year | Average Sold Price | Sold Properties |
|---|---|---|
| 2024 | £242,209.00 | 234 Properties |
| 2023 | £243,187.00 | 561 Properties |
| 2022 | £242,004.00 | 696 Properties |
| 2021 | £234,745.00 | 824 Properties |
| 2020 | £215,069.00 | 743 Properties |
| 2019 | £195,857.00 | 786 Properties |
| 2018 | £193,190.00 | 767 Properties |
| 2017 | £180,644.00 | 719 Properties |
| 2016 | £174,112.00 | 730 Properties |
| 2015 | £170,694.00 | 681 Properties |
| 2014 | £166,869.00 | 615 Properties |
| 2013 | £154,772.00 | 517 Properties |
| 2012 | £161,903.00 | 451 Properties |
| 2011 | £162,012.00 | 460 Properties |
| 2010 | £169,956.00 | 420 Properties |
| 2009 | £156,740.00 | 390 Properties |
| 2008 | £181,527.00 | 459 Properties |
| 2007 | £184,538.00 | 878 Properties |
| 2006 | £173,803.00 | 997 Properties |
| 2005 | £149,231.00 | 785 Properties |
| 2004 | £143,847.00 | 813 Properties |
| 2003 | £111,446.00 | 995 Properties |
| 2002 | £91,150.00 | 1,008 Properties |
| 2001 | £70,228.00 | 964 Properties |
| 2000 | £65,346.00 | 813 Properties |
| 1999 | £61,018.00 | 663 Properties |
| 1998 | £60,295.00 | 610 Properties |
| 1997 | £57,293.00 | 651 Properties |
| 1996 | £55,302.00 | 566 Properties |
| 1995 | £55,994.00 | 578 Properties |
Property Price per Property Type in YO25
Here you can find historic sold price data in order to help with your property search.
The average Property Paid Price for specific property types in the last three years are:
| Property Type | Average Sold Price | Sold Properties |
|---|---|---|
| Terraced House | £156,924.00 | 483 Terraced Houses |
| Flat | £94,386.00 | 96 Flats |
| Semi Detached House | £195,944.00 | 765 Semi Detached Houses |
| Detached House | £329,781.00 | 971 Detached Houses |
Transport near YO25
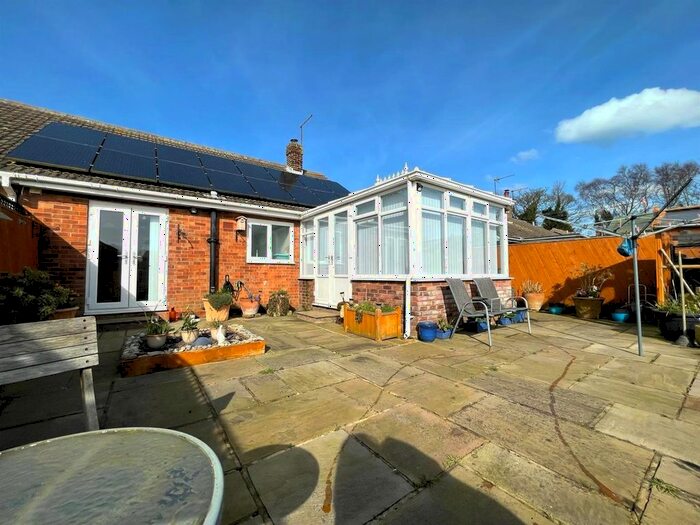
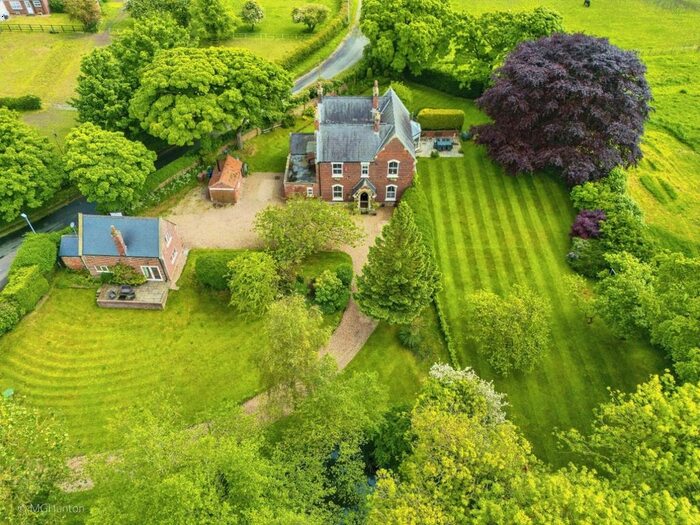
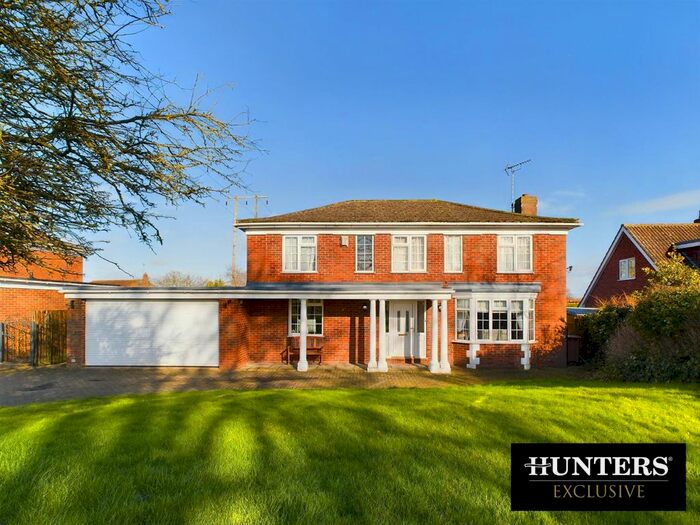
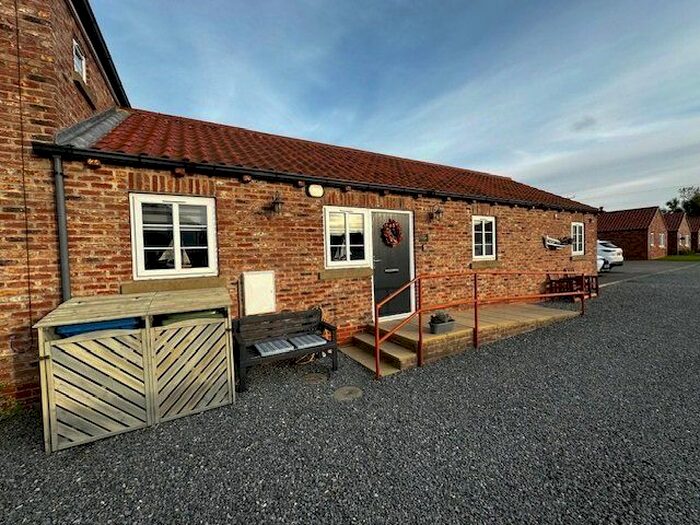
Houses and Flats for sale in YO25, Driffield
Properties for sale near YO25
Frequently Asked Questions about YO25
What is the average price for a property for sale in YO25?
The average price for a property for sale in YO25 is £239,728. There are 5 property listings for sale in YO25.
Which areas are included in the YO25 postcode district?
The main area within YO25 is Driffield.
What are the most common property types in YO25?
The most common property types in YO25 are Detached Houses, Semi Detached Houses, Terraced Houses and Flats.
What has been the average sold property price in YO25 over the last three years?
Detached Houses in YO25 have an average sold price of £329,781, while Semi Detached Houses have an average of £195,944. Terraced Houses have an average of £156,924 and Flats have an average of £94,386. The average sold property price in YO25 over the last three years is approximately £242,467.
Which train stations are available in YO25?
The train stations available in YO25 are Driffield Station, Hutton Cranswick Station and Nafferton Station..


