
Properties for sale in B69
Oldbury
- Info
- Price Paid By Year
- Property Type Price
- Transport
House Prices in B69
Properties in B69 have an average house price of £186,642.00 and had 1033 Property Transactions within the last 3 years.
The most expensive property was sold for £540,000.00.
Property Price Paid in B69 by Year
The average sold property price by year was:
| Year | Average Sold Price | Sold Properties |
|---|---|---|
| 2025 | £199,090.00 | 64 Properties |
| 2024 | £188,605.00 | 289 Properties |
| 2023 | £187,148.00 | 259 Properties |
| 2022 | £183,090.00 | 421 Properties |
| 2021 | £166,670.00 | 389 Properties |
| 2020 | £157,128.00 | 269 Properties |
| 2019 | £143,503.00 | 332 Properties |
| 2018 | £147,928.00 | 334 Properties |
| 2017 | £155,657.00 | 422 Properties |
| 2016 | £135,508.00 | 355 Properties |
| 2015 | £129,873.00 | 394 Properties |
| 2014 | £115,780.00 | 267 Properties |
| 2013 | £108,988.00 | 227 Properties |
| 2012 | £115,047.00 | 248 Properties |
| 2011 | £109,261.00 | 292 Properties |
| 2010 | £114,635.00 | 264 Properties |
| 2009 | £106,002.00 | 208 Properties |
| 2008 | £121,977.00 | 303 Properties |
| 2007 | £127,289.00 | 661 Properties |
| 2006 | £120,896.00 | 665 Properties |
| 2005 | £111,935.00 | 525 Properties |
| 2004 | £106,491.00 | 560 Properties |
| 2003 | £101,019.00 | 641 Properties |
| 2002 | £79,069.00 | 681 Properties |
| 2001 | £60,761.00 | 444 Properties |
| 2000 | £47,925.00 | 407 Properties |
| 1999 | £43,547.00 | 359 Properties |
| 1998 | £42,656.00 | 333 Properties |
| 1997 | £41,609.00 | 314 Properties |
| 1996 | £42,826.00 | 370 Properties |
| 1995 | £41,570.00 | 313 Properties |
Property Price per Property Type in B69
Here you can find historic sold price data in order to help with your property search.
The average Property Paid Price for specific property types in the last three years are:
| Property Type | Average Sold Price | Sold Properties |
|---|---|---|
| Semi Detached House | £196,117.00 | 495 Semi Detached Houses |
| Detached House | £296,411.00 | 111 Detached Houses |
| Terraced House | £173,991.00 | 279 Terraced Houses |
| Flat | £96,471.00 | 148 Flats |

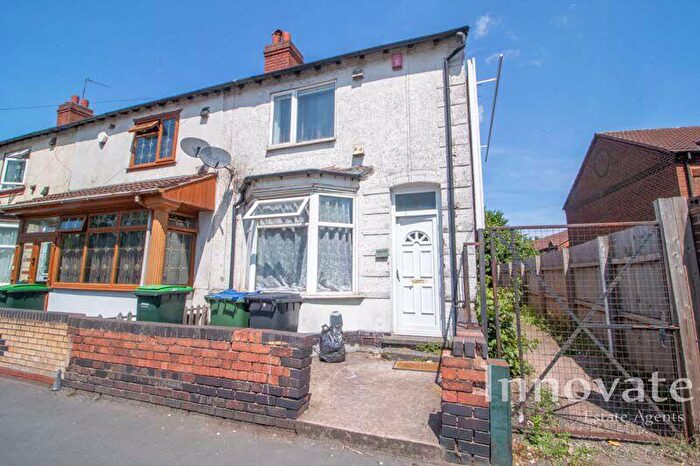
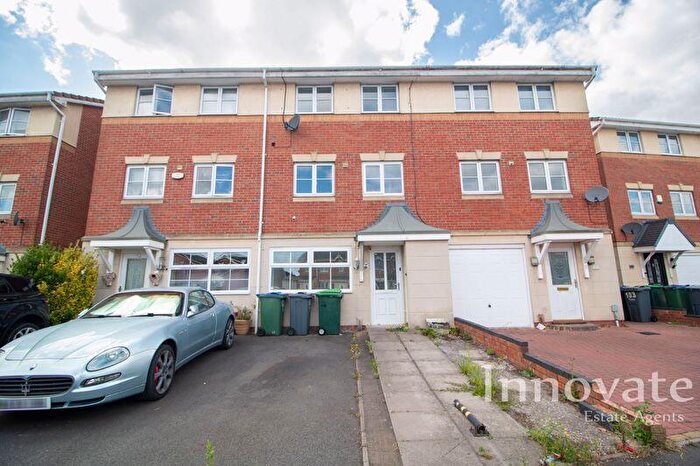
Houses and Flats for sale in B69, Oldbury


![]()
If you are looking to sell your house, let it out, or receive a property valuation, an expert can help you.
Click the button below to get started.


Frequently Asked Questions about B69
What is the average price for a property for sale in B69?
The average price for a property for sale in B69 is £186,642. There are 120 property listings for sale in B69.
Which areas are included in the B69 postcode district?
The main area within B69 is Oldbury.
What are the most common property types in B69?
The most common property types in B69 are Semi Detached Houses, Terraced Houses, Flats and Detached Houses.
What has been the average sold property price in B69 over the last three years?
Semi Detached Houses in B69 have an average sold price of £196,117, while Terraced Houses have an average of £173,991. Flats have an average of £96,471 and Detached Houses have an average of £296,411. The average sold property price in B69 over the last three years is approximately £191,614.
Which train stations are available in B69?
The train station available in B69 is Langley Green Station..