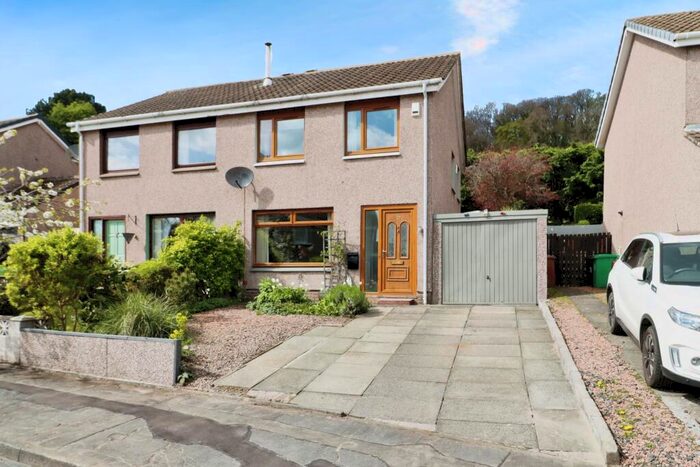
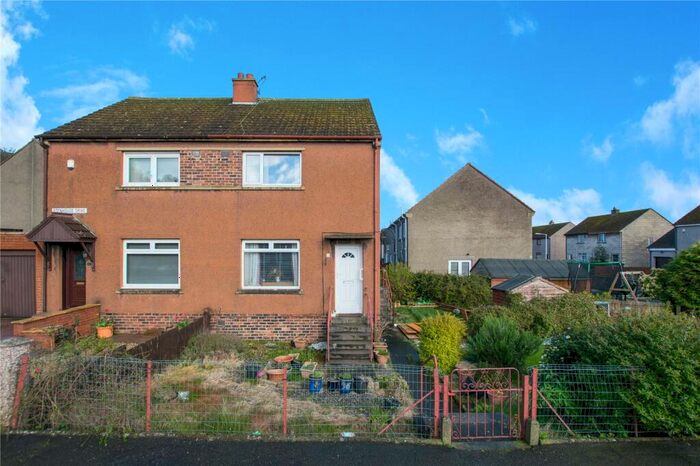
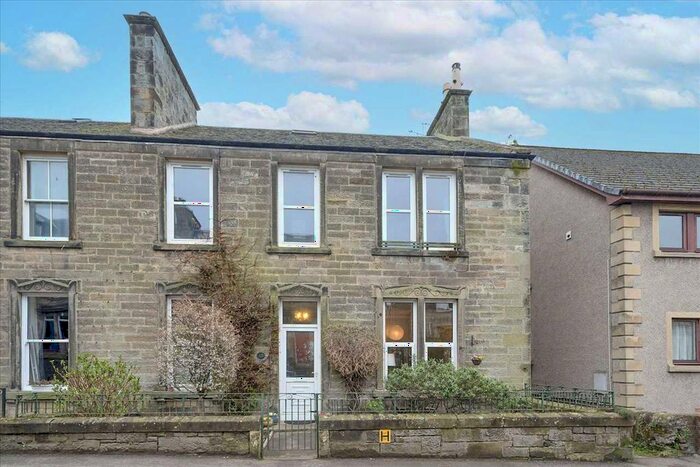
Properties for sale in KY3
Burntisland
- Info
- Price Paid By Year
- Transport
House Prices in KY3
Properties in KY3 have an average house price of £204,308.00 and had 521 Property Transactions within the last 3 years.
The most expensive property was sold for £920,000.00.
Property Price Paid in KY3 by Year
Loading ...
The average sold property price by year was:
| Year | Average Sold Price | Sold Properties |
|---|---|---|
| 2023 | £239,389.00 | 57 Properties |
| 2022 | £198,588.00 | 218 Properties |
| 2021 | £201,248.00 | 246 Properties |
| 2020 | £182,356.00 | 231 Properties |
| 2019 | £175,700.00 | 226 Properties |
| 2018 | £170,963.00 | 258 Properties |
| 2017 | £172,013.00 | 203 Properties |
| 2016 | £154,190.00 | 234 Properties |
| 2015 | £161,875.00 | 250 Properties |
| 2014 | £150,936.00 | 202 Properties |
| 2013 | £146,939.00 | 213 Properties |
| 2012 | £147,940.00 | 178 Properties |
| 2011 | £147,454.00 | 162 Properties |
| 2010 | £149,977.00 | 178 Properties |
| 2009 | £133,492.00 | 184 Properties |
| 2008 | £150,253.00 | 215 Properties |
| 2007 | £161,408.00 | 240 Properties |
| 2006 | £126,038.00 | 322 Properties |
| 2005 | £104,423.00 | 285 Properties |
| 2004 | £87,374.00 | 317 Properties |
| 2003 | £73,865.00 | 334 Properties |
| 2002 | £63,851.00 | 269 Properties |
| 2001 | £42,094.00 | 24 Properties |