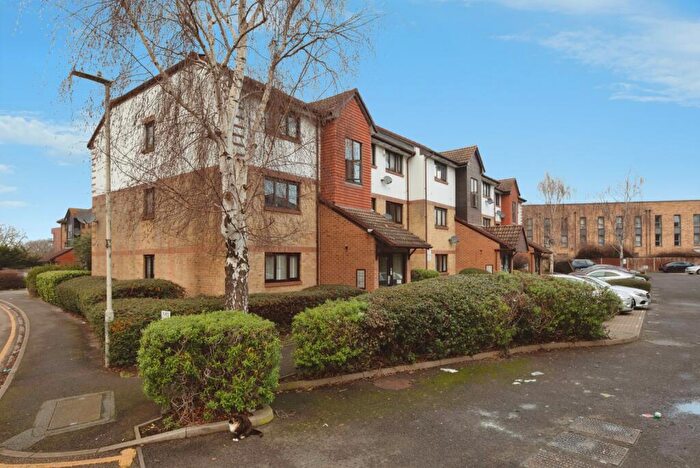
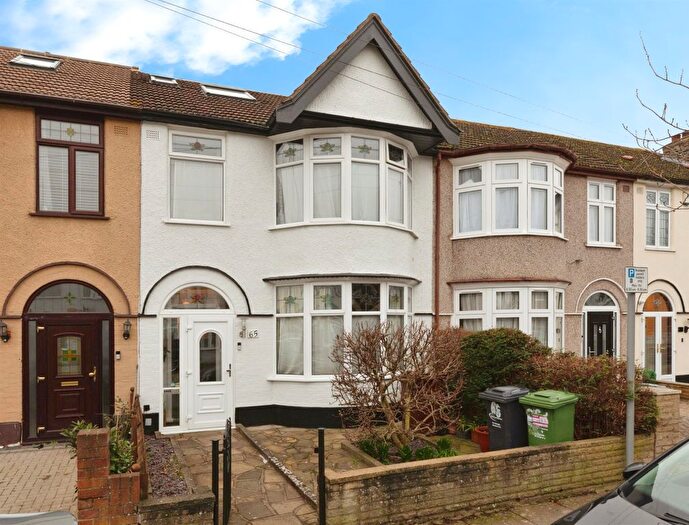
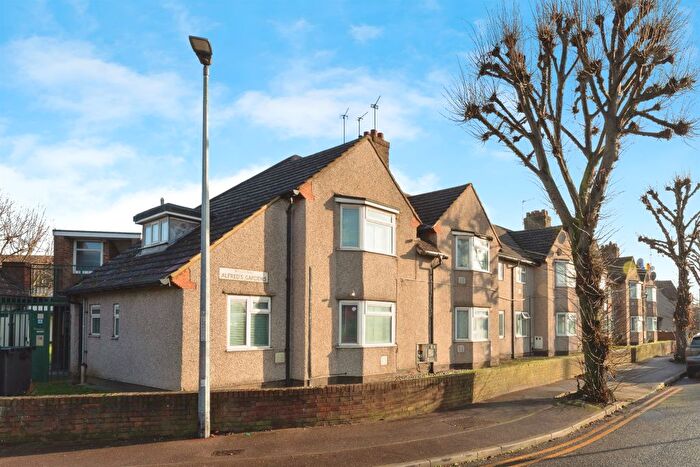
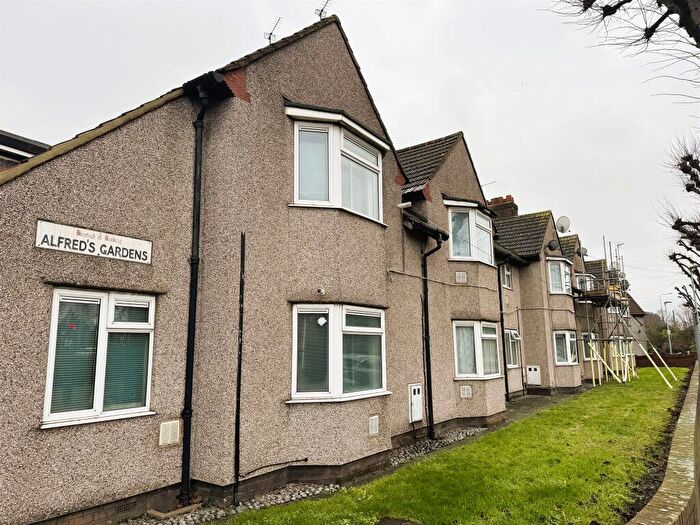
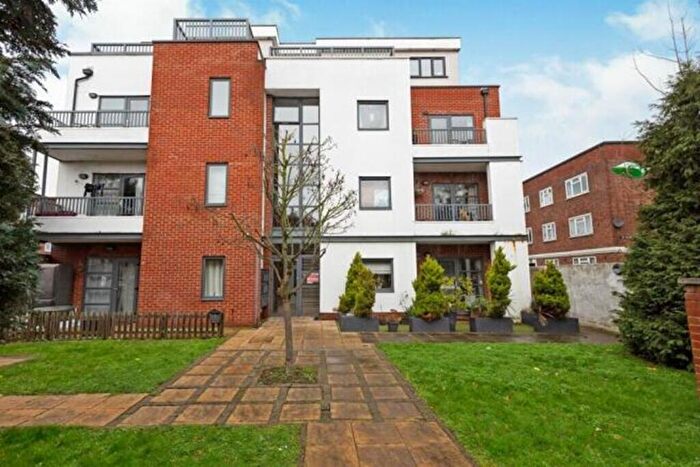
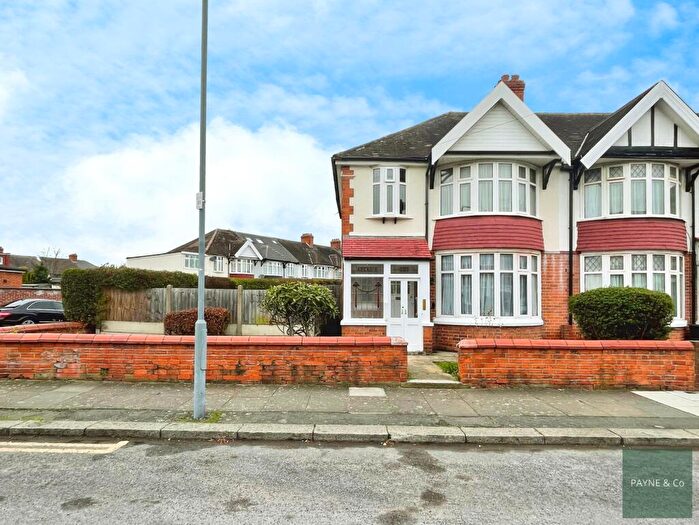
Houses for sale & to rent in Longbridge, Barking
House Prices in Longbridge
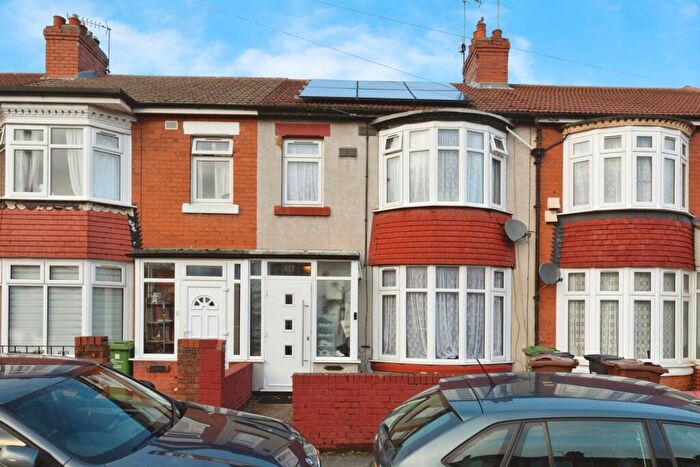
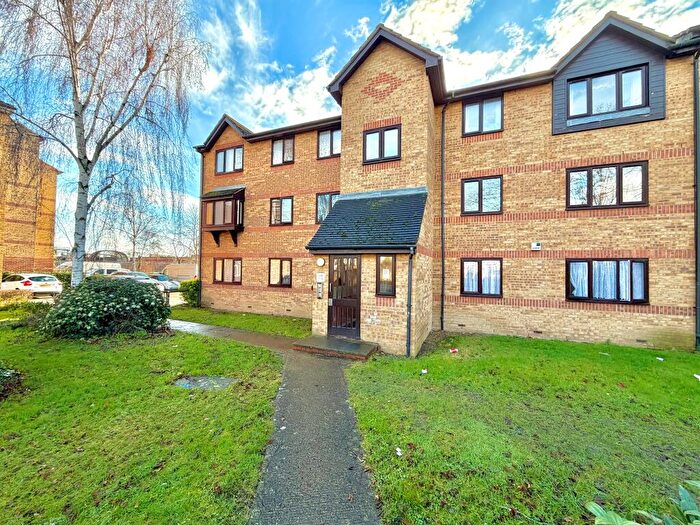
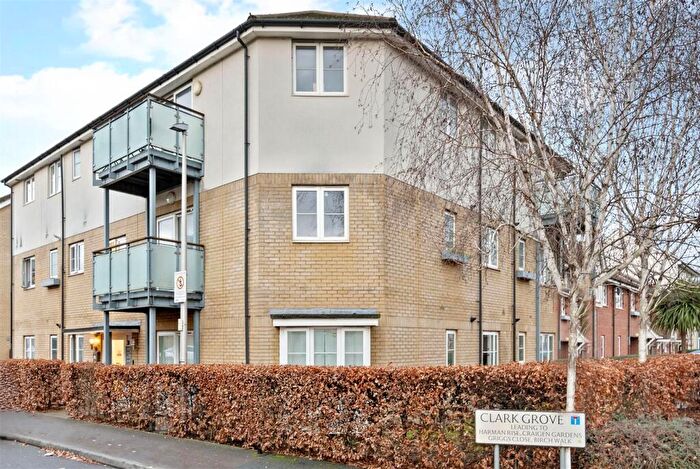
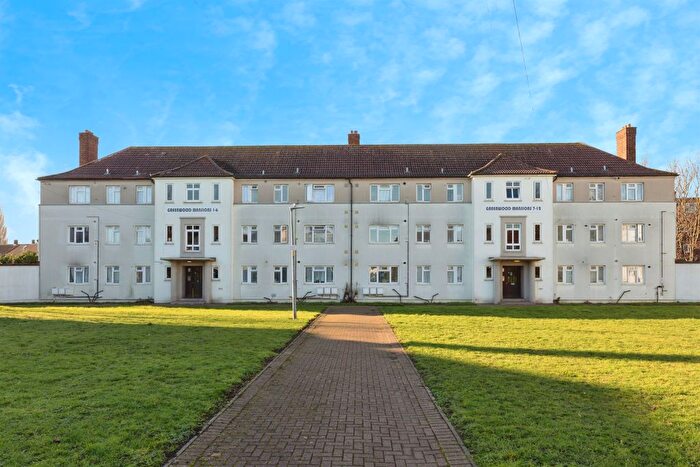
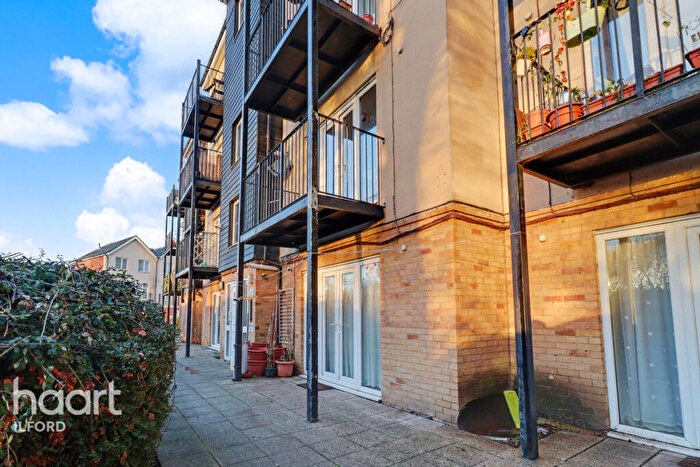
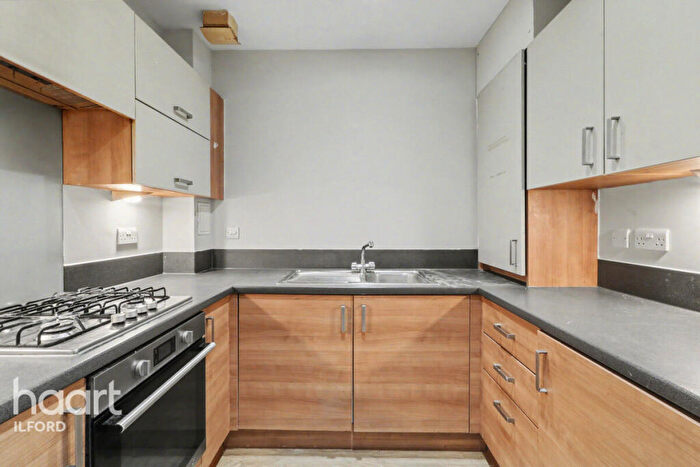
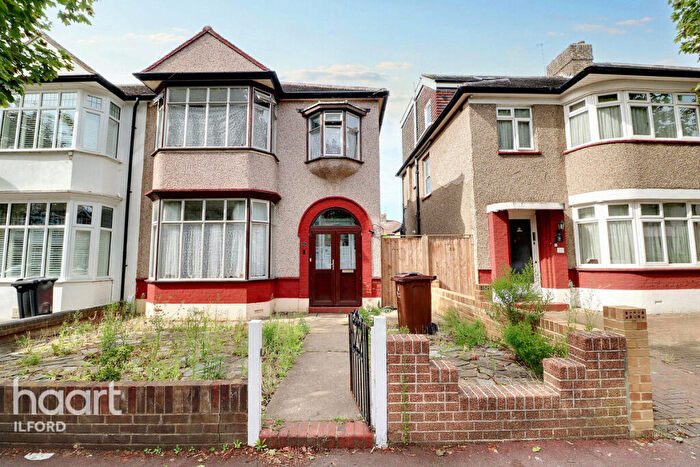
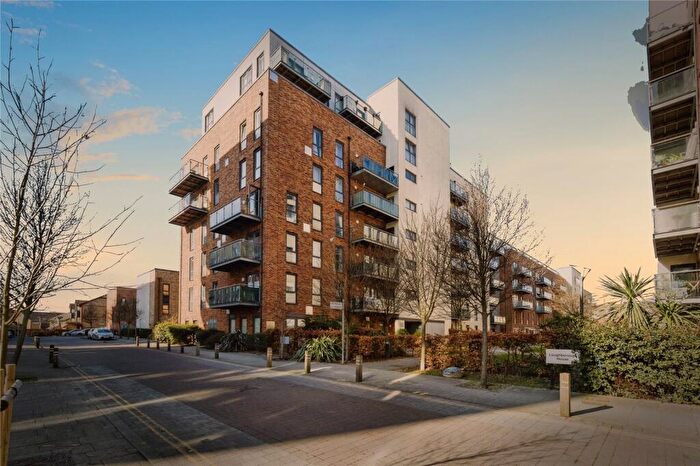
Properties in this part of Longbridge within Barking have an average house price of £501,932.00 and had 242 Property Transactions within the last 3 years¹. This area has 3,761 households² , where the most expensive property was sold for £1,200,000.00.
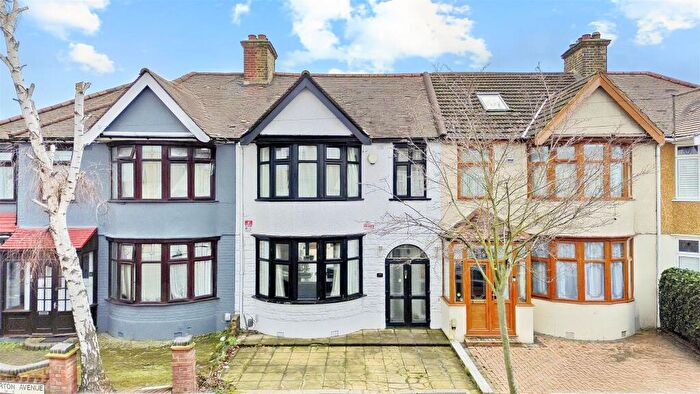
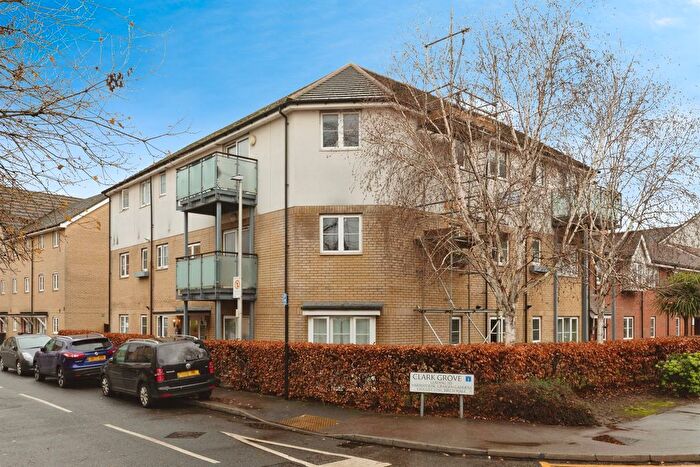
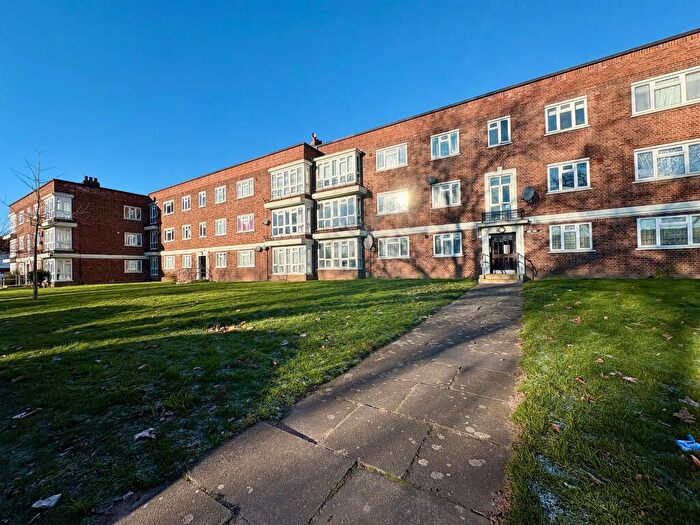
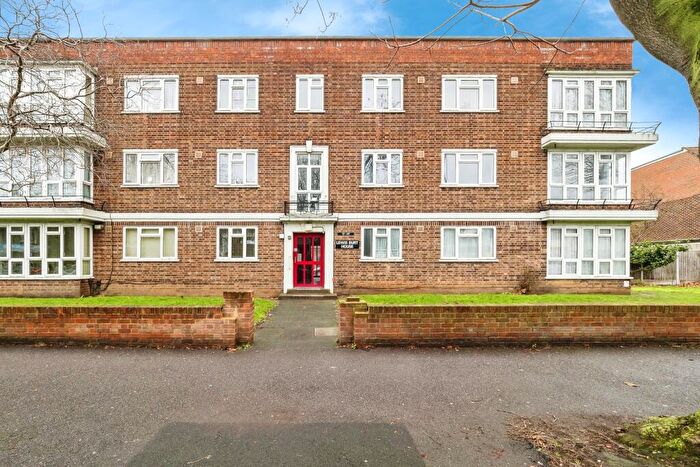
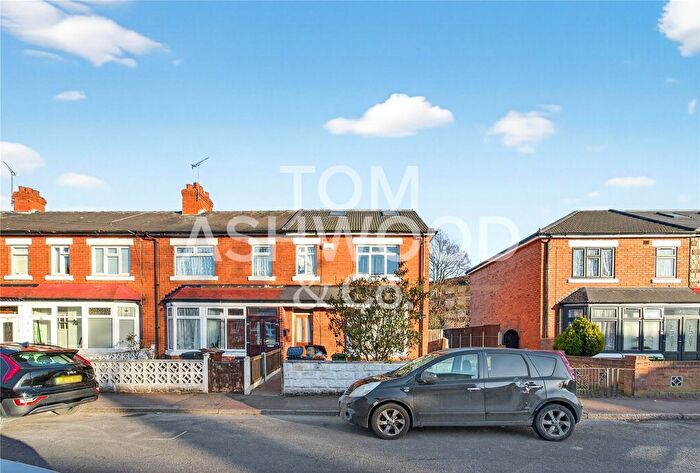
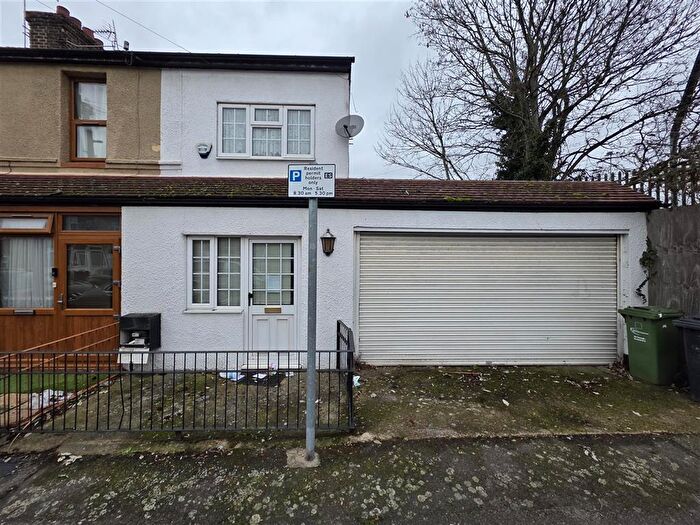
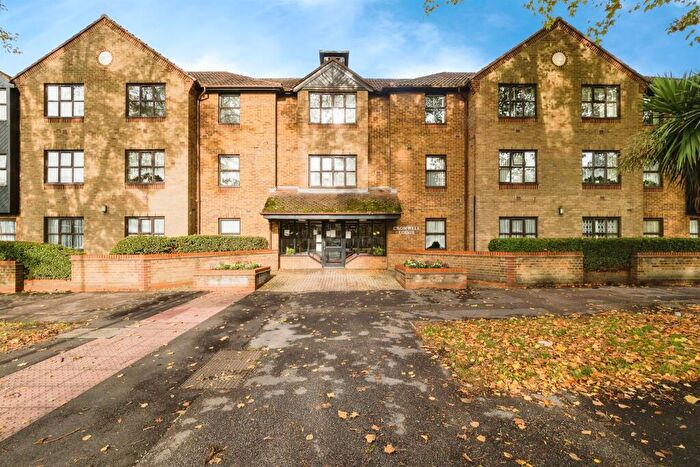
Properties for sale in Longbridge
Roads and Postcodes in Longbridge
Navigate through our locations to find the location of your next house in Longbridge, Barking for sale or to rent.
Transport near Longbridge
-
Upney Station
-
Barking Station
-
Becontree Station
-
Seven Kings Station
-
Goodmayes Station
-
Ilford Station
-
East Ham Station
-
Dagenham Heathway Station
-
Chadwell Heath Station
-
Newbury Park Station
- FAQ
- Price Paid By Year
- Property Type Price
Frequently asked questions about Longbridge
What is the average price for a property for sale in Longbridge?
The average price for a property for sale in Longbridge is £501,932. This amount is 38% higher than the average price in Barking. There are 1,619 property listings for sale in Longbridge.
What streets have the most expensive properties for sale in Longbridge?
The streets with the most expensive properties for sale in Longbridge are Melford Avenue at an average of £658,333, Upney Lane at an average of £649,166 and Beccles Drive at an average of £633,735.
What streets have the most affordable properties for sale in Longbridge?
The streets with the most affordable properties for sale in Longbridge are Champness Road at an average of £238,657, Bradfield Drive at an average of £297,375 and Thornhill Gardens at an average of £321,833.
Which train stations are available in or near Longbridge?
Some of the train stations available in or near Longbridge are Barking, Seven Kings and Goodmayes.
Which tube stations are available in or near Longbridge?
Some of the tube stations available in or near Longbridge are Upney, Barking and Becontree.
Property Price Paid in Longbridge by Year
The average sold property price by year was:
| Year | Average Sold Price | Price Change |
Sold Properties
|
|---|---|---|---|
| 2025 | £517,461 | 3% |
64 Properties |
| 2024 | £499,603 | 1% |
88 Properties |
| 2023 | £493,166 | 3% |
90 Properties |
| 2022 | £479,622 | 6% |
107 Properties |
| 2021 | £453,239 | 6% |
143 Properties |
| 2020 | £425,904 | 4% |
68 Properties |
| 2019 | £409,384 | -5% |
124 Properties |
| 2018 | £428,851 | 6% |
101 Properties |
| 2017 | £402,843 | 0,1% |
115 Properties |
| 2016 | £402,435 | 15% |
156 Properties |
| 2015 | £340,759 | 12% |
148 Properties |
| 2014 | £299,841 | 12% |
132 Properties |
| 2013 | £263,245 | 0,4% |
112 Properties |
| 2012 | £262,131 | 2% |
103 Properties |
| 2011 | £256,903 | -1% |
121 Properties |
| 2010 | £258,278 | 0,5% |
92 Properties |
| 2009 | £257,027 | -5% |
91 Properties |
| 2008 | £269,142 | -1% |
121 Properties |
| 2007 | £272,607 | 12% |
241 Properties |
| 2006 | £241,132 | 5% |
253 Properties |
| 2005 | £229,347 | 1% |
209 Properties |
| 2004 | £226,640 | 7% |
228 Properties |
| 2003 | £211,457 | 20% |
209 Properties |
| 2002 | £168,533 | 21% |
212 Properties |
| 2001 | £133,441 | 7% |
222 Properties |
| 2000 | £124,107 | 16% |
275 Properties |
| 1999 | £103,881 | 5% |
165 Properties |
| 1998 | £99,145 | 11% |
135 Properties |
| 1997 | £87,779 | 10% |
157 Properties |
| 1996 | £79,244 | 7% |
141 Properties |
| 1995 | £73,403 | - |
97 Properties |
Property Price per Property Type in Longbridge
Here you can find historic sold price data in order to help with your property search.
The average Property Paid Price for specific property types in the last three years are:
| Property Type | Average Sold Price | Sold Properties |
|---|---|---|
| Semi Detached House | £671,480.00 | 26 Semi Detached Houses |
| Detached House | £647,500.00 | 2 Detached Houses |
| Terraced House | £529,502.00 | 177 Terraced Houses |
| Flat | £243,029.00 | 37 Flats |

