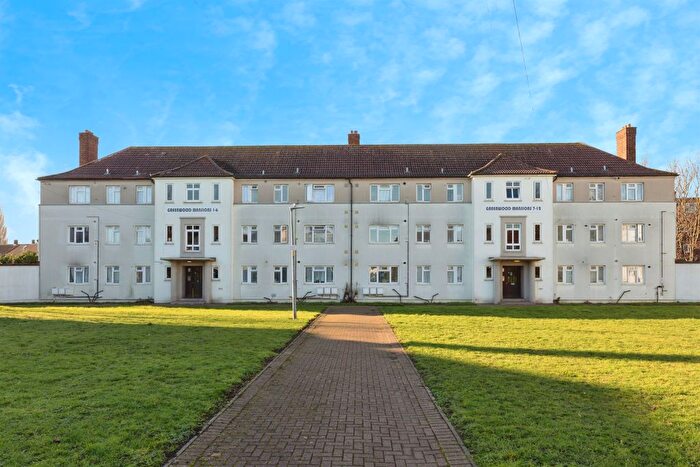
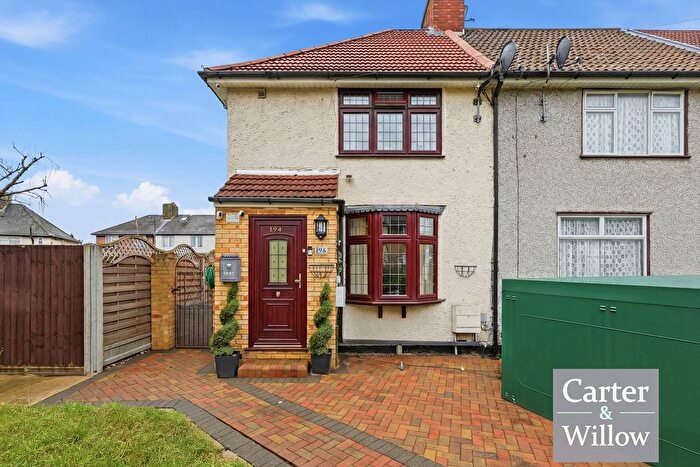
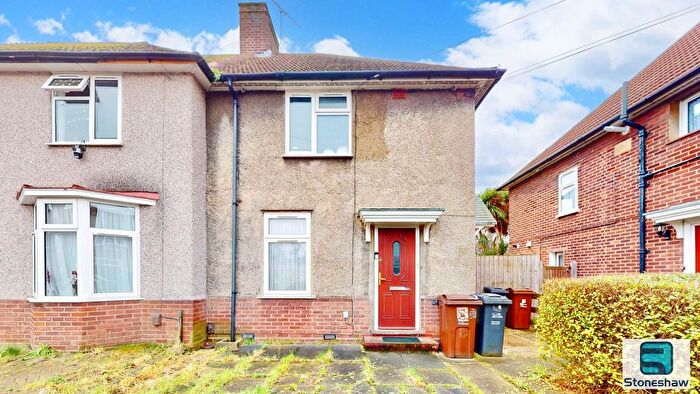
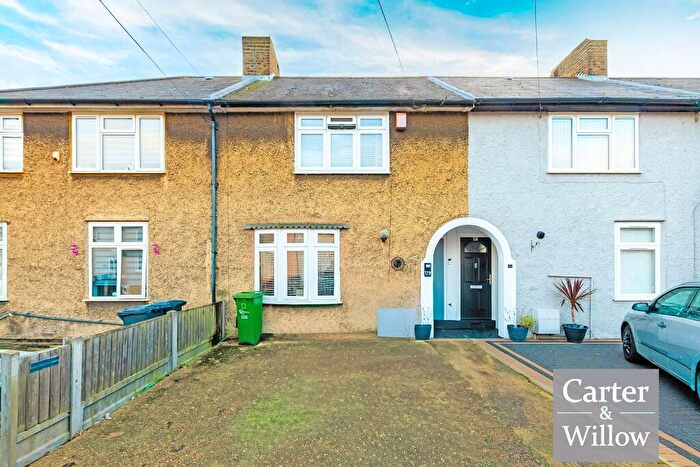
Houses for sale & to rent in Eastbury, Dagenham
House Prices in Eastbury
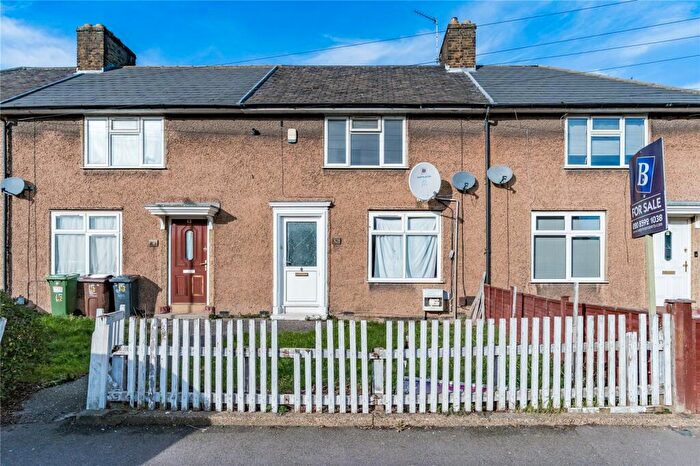
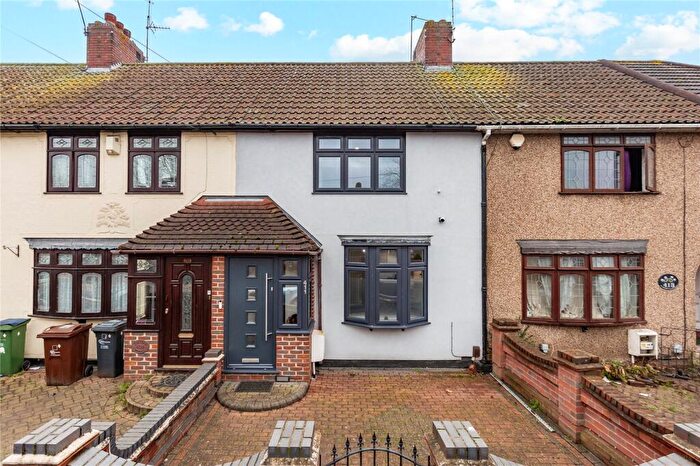
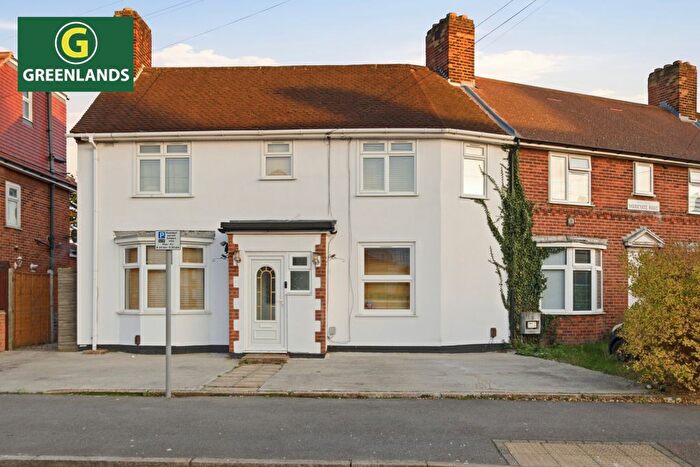
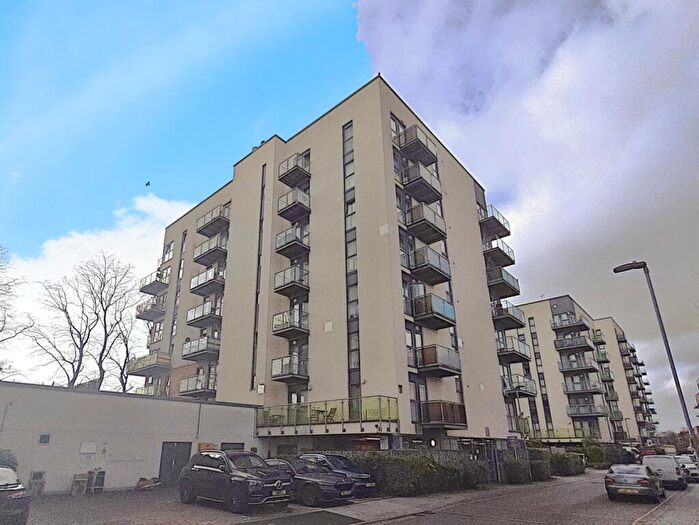
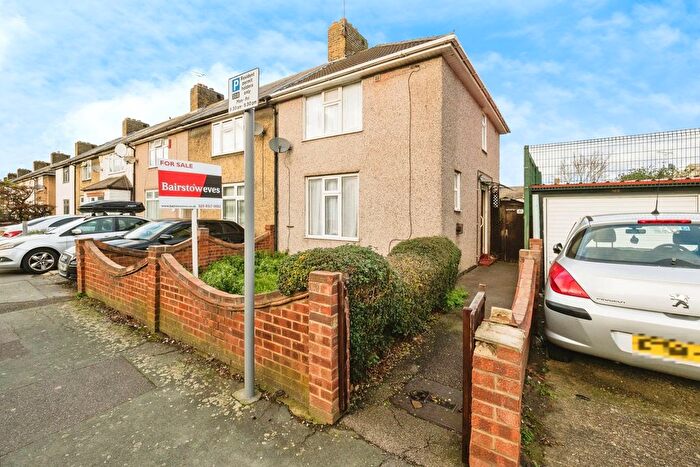
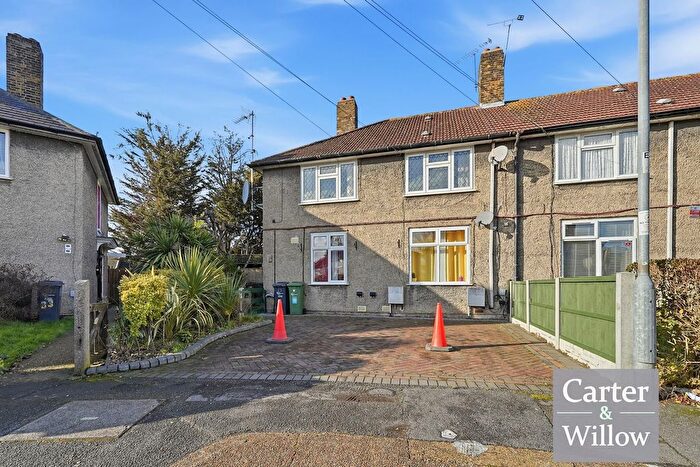
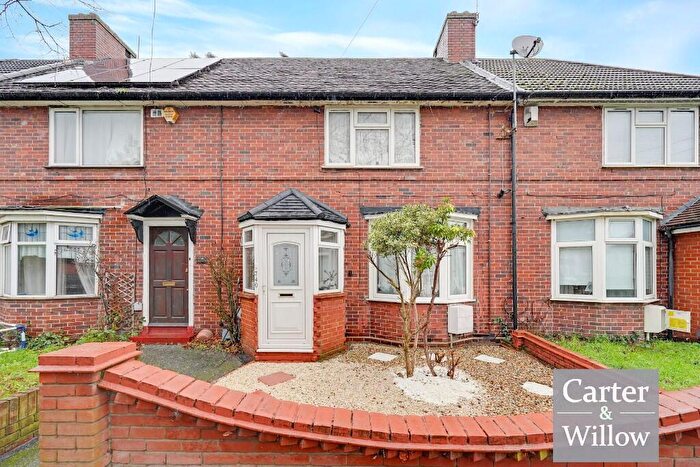
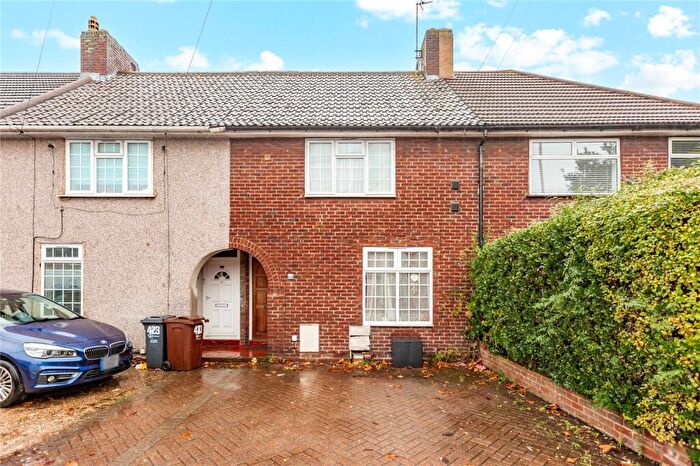
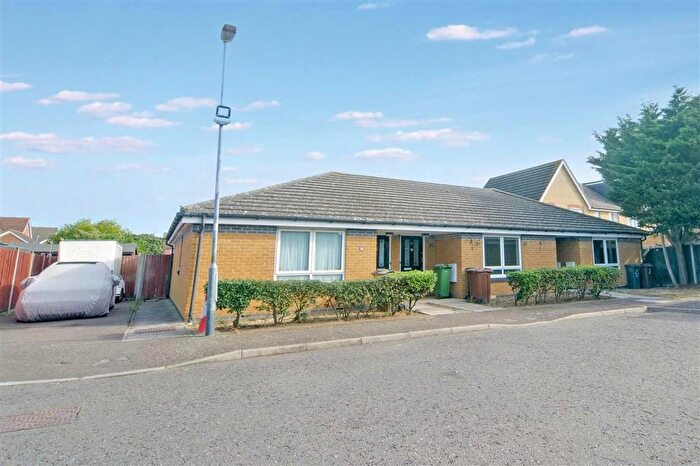
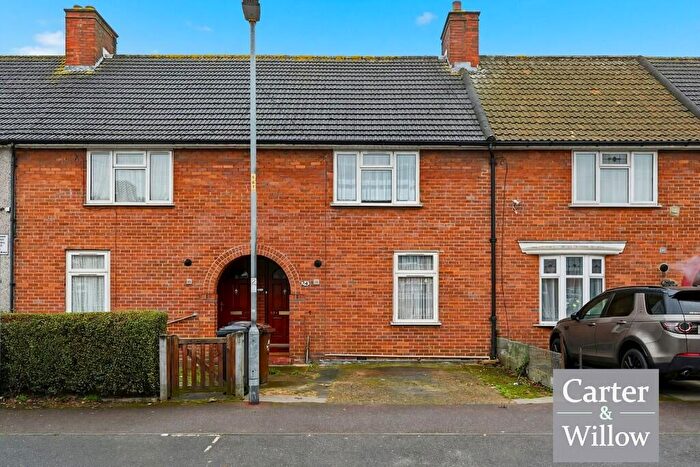
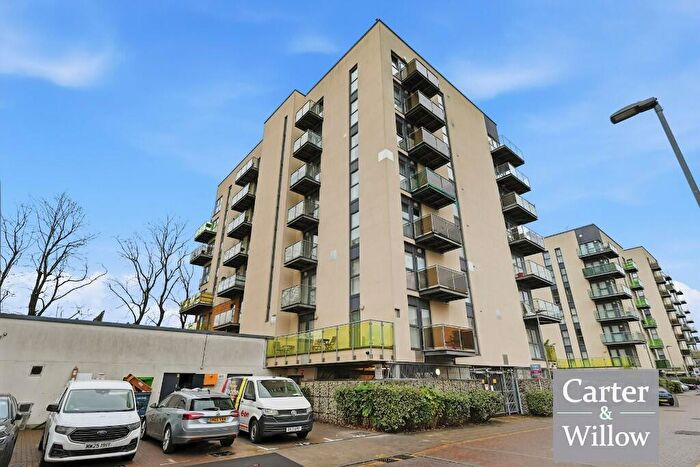
Properties in this part of Eastbury within Dagenham have an average house price of £355,966.00 and had 100 Property Transactions within the last 3 years¹. This area has 1,796 households² , where the most expensive property was sold for £547,000.00.
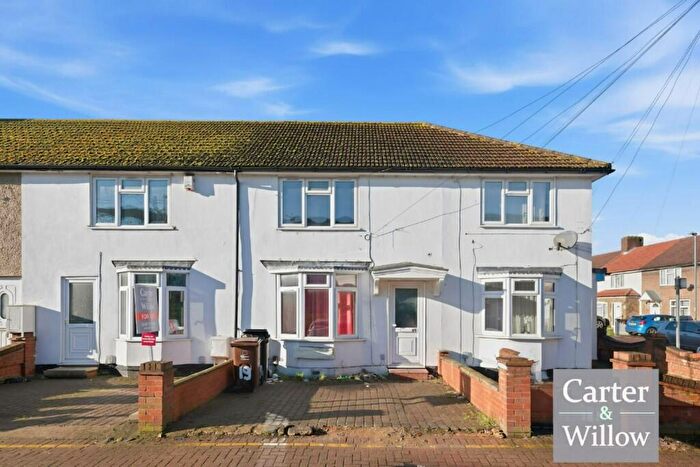
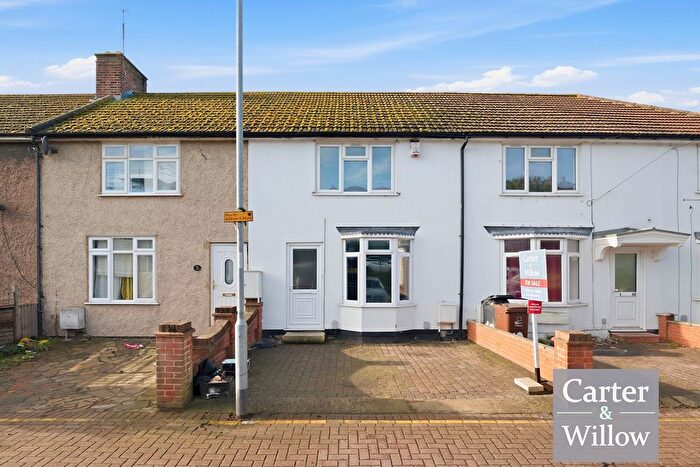
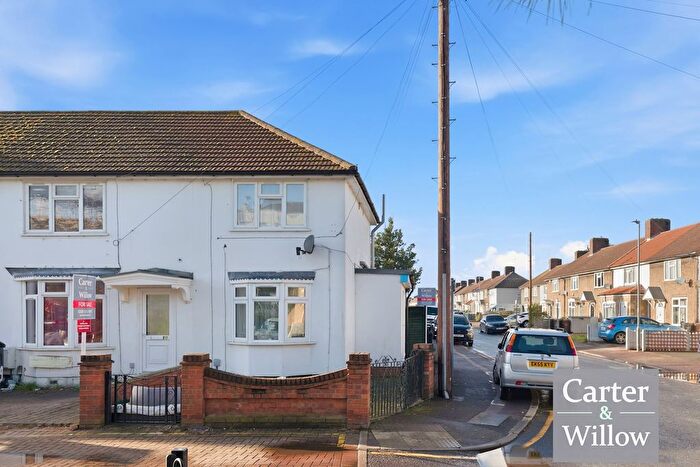
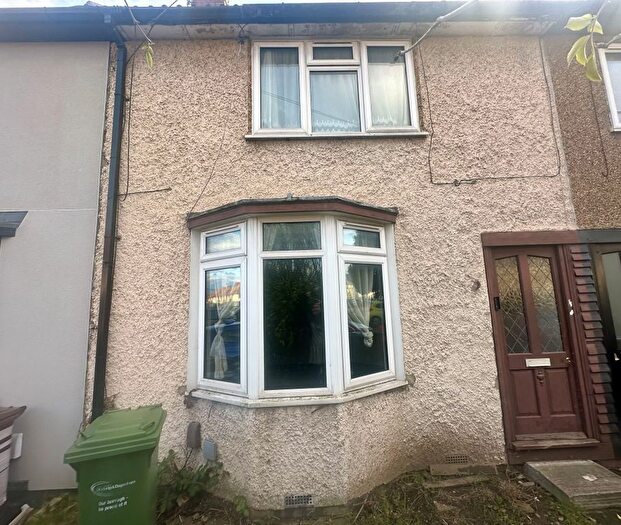
Properties for sale in Eastbury
Roads and Postcodes in Eastbury
Navigate through our locations to find the location of your next house in Eastbury, Dagenham for sale or to rent.
| Streets | Postcodes |
|---|---|
| Aconbury Road | RM9 4RD |
| Billings Close | RM9 4HP |
| Burnham Road | RM9 4RA RM9 4RB |
| Campsey Gardens | RM9 4DT |
| Campsey Road | RM9 4DR RM9 4DS |
| Canonsleigh Road | RM9 4DB RM9 4DH RM9 4DJ |
| Carrow Road | RM9 4TJ |
| Castle Road | RM9 4XS RM9 4XW |
| Cotton Close | RM9 4HN |
| Denny Gardens | RM9 4DD |
| Ellerton Gardens | RM9 4HT |
| Ellerton Road | RM9 4HR RM9 4HU RM9 4HX |
| Flamstead Road | RM9 4JR |
| Goresbrook Road | RM9 4XA RM9 4XD |
| Hamleton Terrace | RM9 4HJ |
| Lodge Avenue | RM9 4QB RM9 4QD RM9 4QH RM9 4QJ RM9 4QR RM9 4QS RM9 4QU RM9 4QX |
| Maplestead Road | RM9 4XH RM9 4XL RM9 4XR |
| Moore Crescent | RM9 4XP |
| Pinley Gardens | RM9 4RH |
| Ripple Road | RM9 4QL RM9 4QP |
| Rosedale Drive | RM9 4GD |
| Rosedale Gardens | RM9 4EA |
| Rosedale Road | RM9 4DL RM9 4DP RM9 4DU RM9 4DX |
| Rothwell Road | RM9 4JA |
| Sheppey Road | RM9 4JS RM9 4JT RM9 4JU RM9 4JX RM9 4LA |
| Stamford Gardens | RM9 4ET |
| Stamford Road | RM9 4ED RM9 4EH RM9 4EJ RM9 4EL RM9 4ER RM9 4ES |
| Stocker Gardens | RM9 4HL |
| Surmans Close | RM9 4XE |
| Wagstaff Gardens | RM9 4HQ |
| Woodward Gardens | RM9 4TL |
| Woodward Road | RM9 4ST RM9 4SU RM9 4TA RM9 4TB RM9 4TD |
Transport near Eastbury
-
Becontree Station
-
Upney Station
-
Dagenham Heathway Station
-
Dagenham Dock Station
-
Barking Station
-
Goodmayes Station
-
Seven Kings Station
-
Dagenham East Station
-
Chadwell Heath Station
-
Ilford Station
- FAQ
- Price Paid By Year
- Property Type Price
Frequently asked questions about Eastbury
What is the average price for a property for sale in Eastbury?
The average price for a property for sale in Eastbury is £355,966. This amount is 0.06% higher than the average price in Dagenham. There are 1,209 property listings for sale in Eastbury.
What streets have the most expensive properties for sale in Eastbury?
The streets with the most expensive properties for sale in Eastbury are Carrow Road at an average of £401,666, Stamford Road at an average of £396,672 and Cotton Close at an average of £396,666.
What streets have the most affordable properties for sale in Eastbury?
The streets with the most affordable properties for sale in Eastbury are Moore Crescent at an average of £252,250, Billings Close at an average of £270,000 and Wagstaff Gardens at an average of £301,250.
Which train stations are available in or near Eastbury?
Some of the train stations available in or near Eastbury are Dagenham Dock, Barking and Goodmayes.
Which tube stations are available in or near Eastbury?
Some of the tube stations available in or near Eastbury are Becontree, Upney and Dagenham Heathway.
Property Price Paid in Eastbury by Year
The average sold property price by year was:
| Year | Average Sold Price | Price Change |
Sold Properties
|
|---|---|---|---|
| 2025 | £349,614 | -3% |
24 Properties |
| 2024 | £358,787 | 0,4% |
33 Properties |
| 2023 | £357,346 | -1% |
43 Properties |
| 2022 | £361,984 | 10% |
39 Properties |
| 2021 | £327,085 | 1% |
64 Properties |
| 2020 | £324,173 | 9% |
26 Properties |
| 2019 | £294,783 | -4% |
30 Properties |
| 2018 | £307,267 | 3% |
58 Properties |
| 2017 | £297,008 | 7% |
67 Properties |
| 2016 | £277,431 | 11% |
51 Properties |
| 2015 | £247,397 | 14% |
49 Properties |
| 2014 | £212,445 | 20% |
64 Properties |
| 2013 | £170,212 | 4% |
41 Properties |
| 2012 | £162,653 | 3% |
26 Properties |
| 2011 | £158,375 | -6% |
24 Properties |
| 2010 | £168,133 | 10% |
45 Properties |
| 2009 | £151,177 | -29% |
41 Properties |
| 2008 | £195,304 | 7% |
41 Properties |
| 2007 | £182,539 | 10% |
86 Properties |
| 2006 | £164,361 | 2% |
118 Properties |
| 2005 | £161,340 | 2% |
67 Properties |
| 2004 | £158,444 | 13% |
96 Properties |
| 2003 | £137,325 | 17% |
130 Properties |
| 2002 | £114,212 | 24% |
89 Properties |
| 2001 | £86,302 | -2% |
66 Properties |
| 2000 | £87,702 | 31% |
125 Properties |
| 1999 | £60,588 | 8% |
42 Properties |
| 1998 | £55,455 | 14% |
58 Properties |
| 1997 | £47,434 | 4% |
56 Properties |
| 1996 | £45,644 | -1% |
36 Properties |
| 1995 | £45,981 | - |
43 Properties |
Property Price per Property Type in Eastbury
Here you can find historic sold price data in order to help with your property search.
The average Property Paid Price for specific property types in the last three years are:
| Property Type | Average Sold Price | Sold Properties |
|---|---|---|
| Semi Detached House | £369,068.00 | 11 Semi Detached Houses |
| Terraced House | £371,332.00 | 78 Terraced Houses |
| Flat | £233,909.00 | 11 Flats |

