
Houses for sale & to rent in EN5 1NU, Landsdown Close, Oakleigh, Barnet
House Prices in EN5 1NU, Landsdown Close, Oakleigh
Properties in EN5 1NU have no sales history available within the last 3 years. EN5 1NU is a postcode in Landsdown Close located in Oakleigh, an area in Barnet, Barnet London Borough, with 3 households².
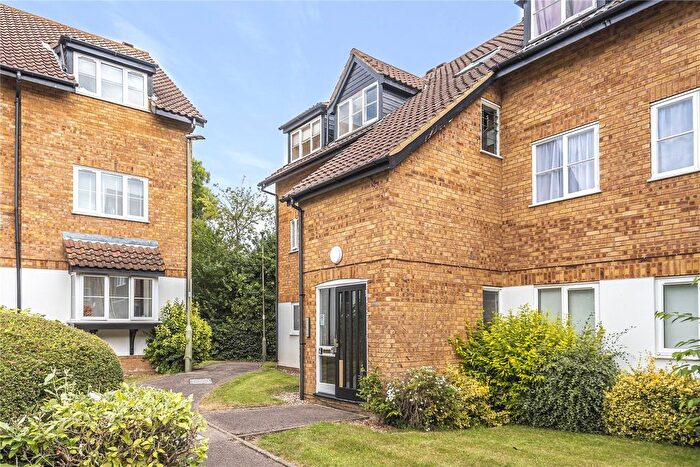
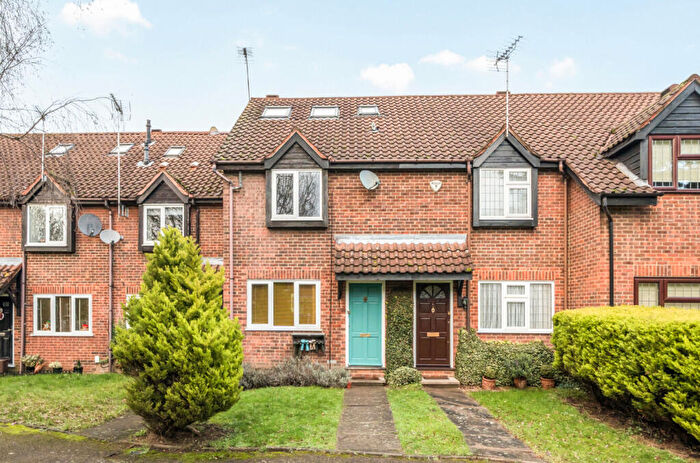
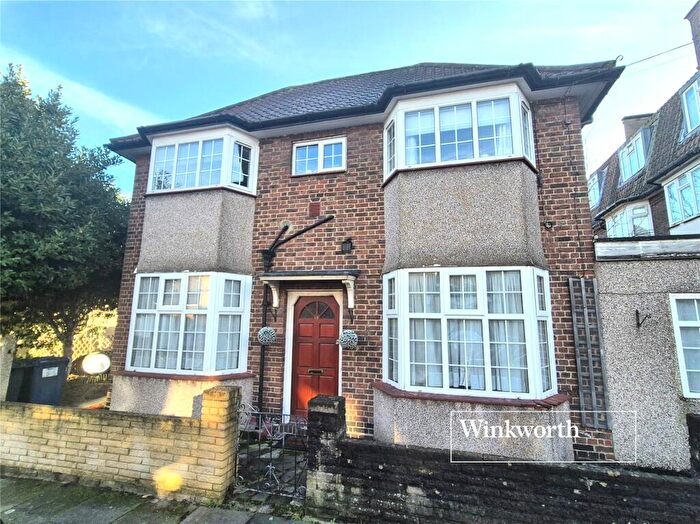
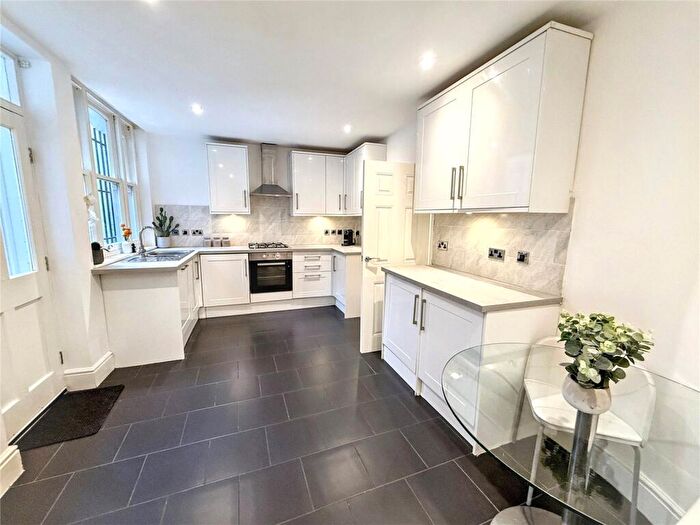
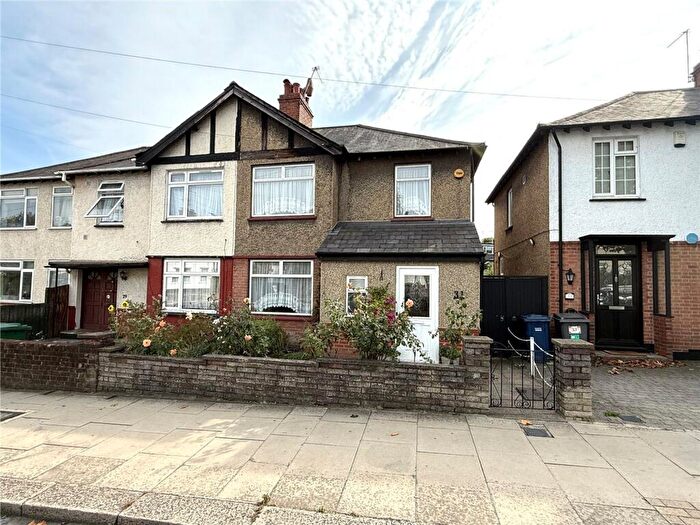
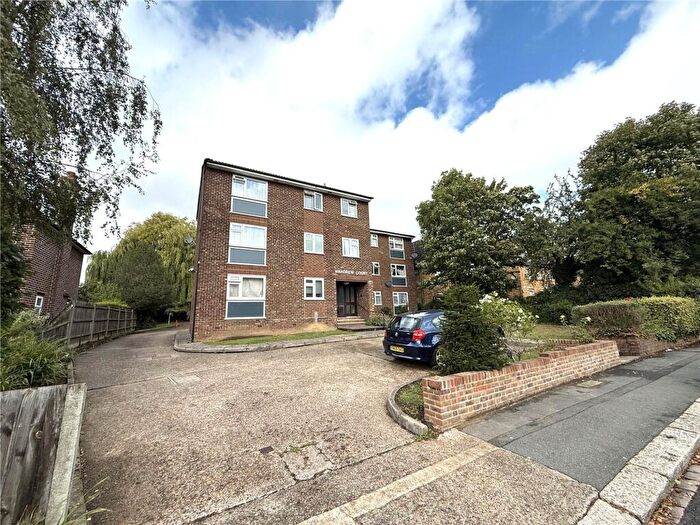
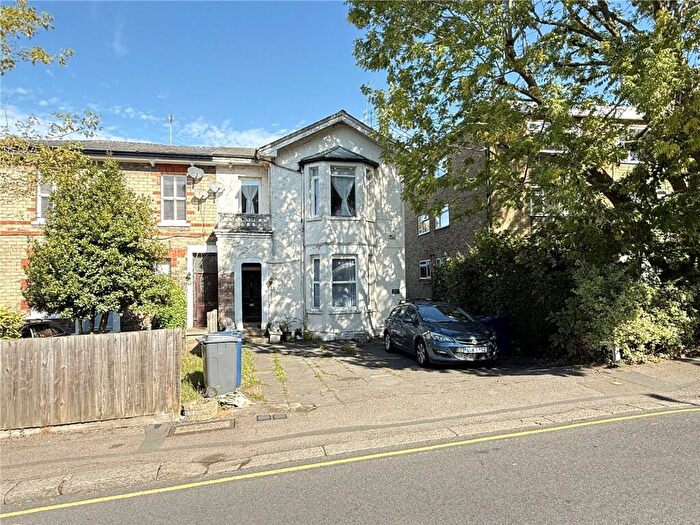
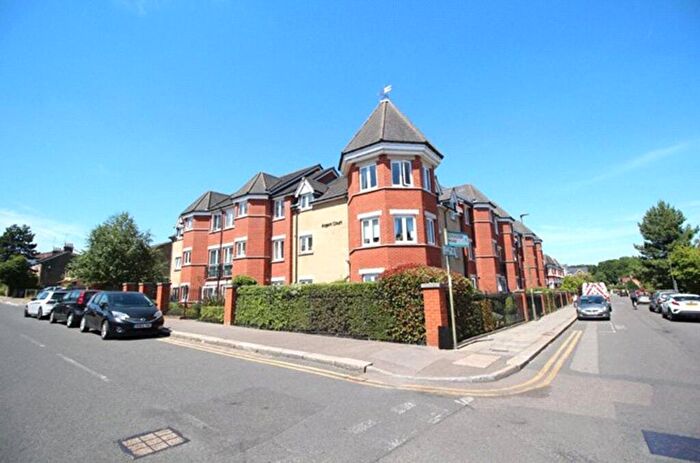
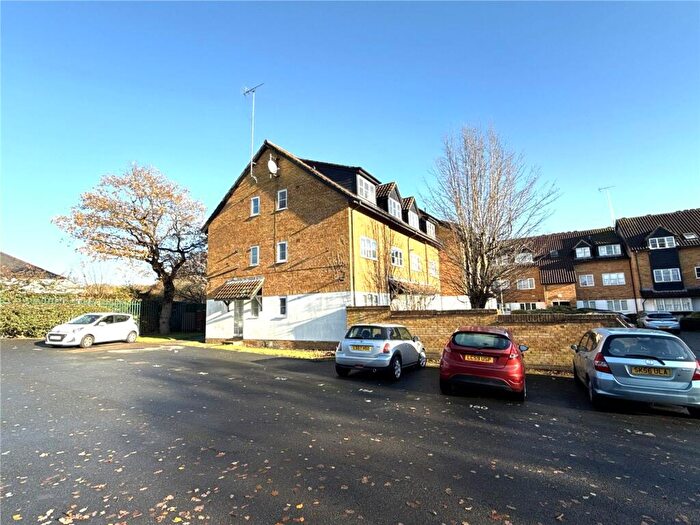
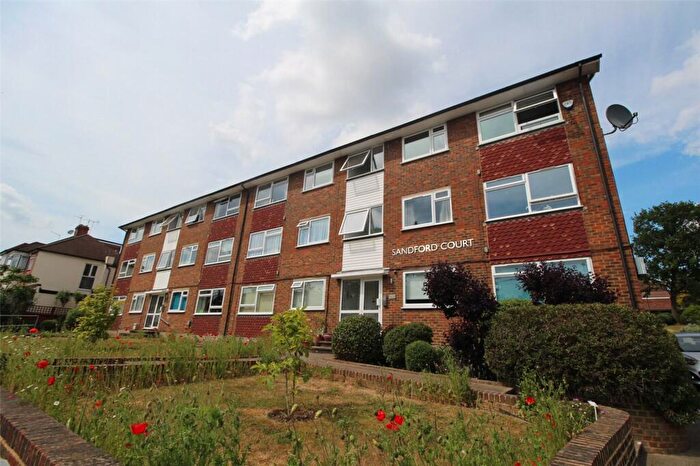
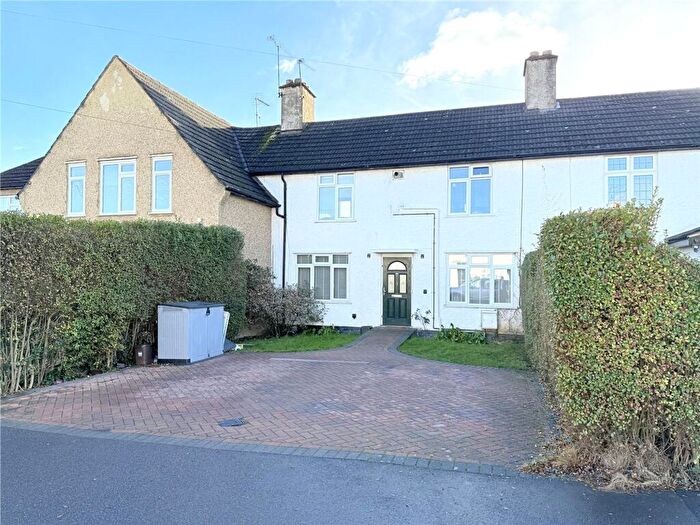
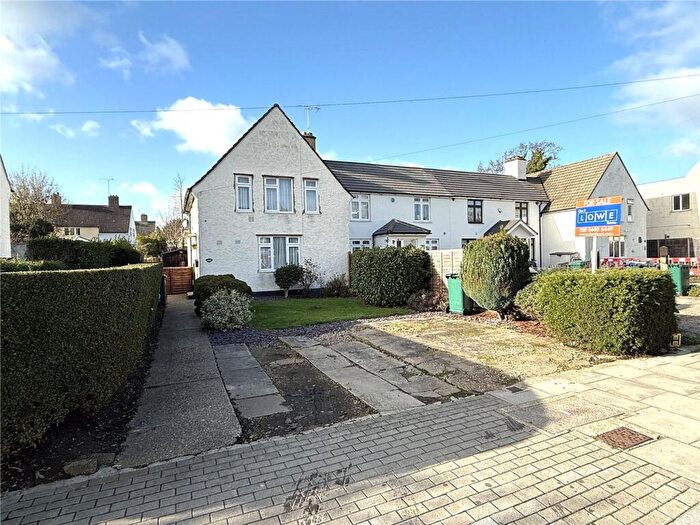
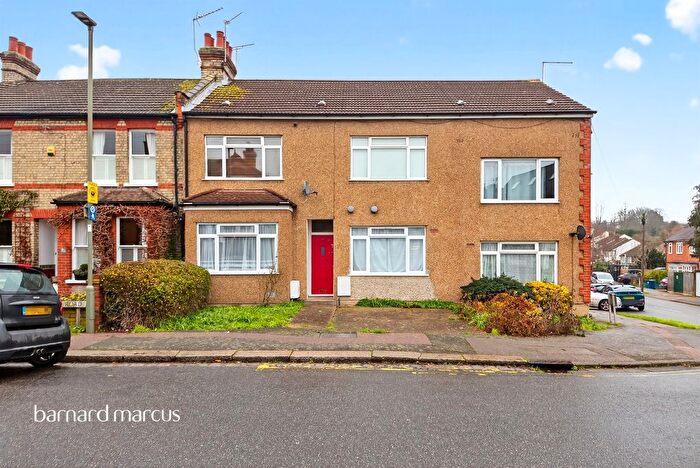
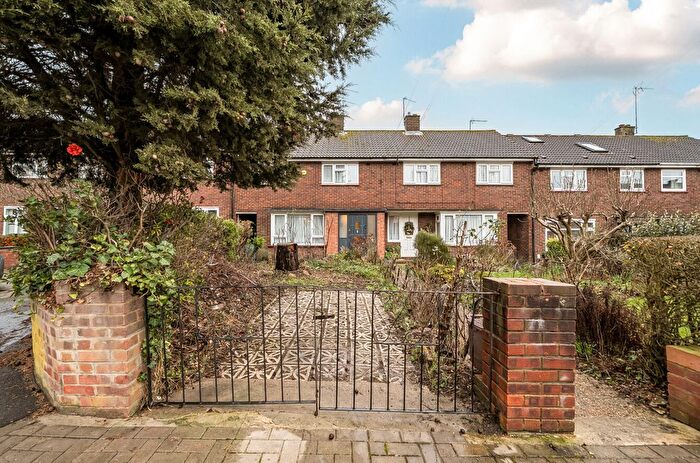
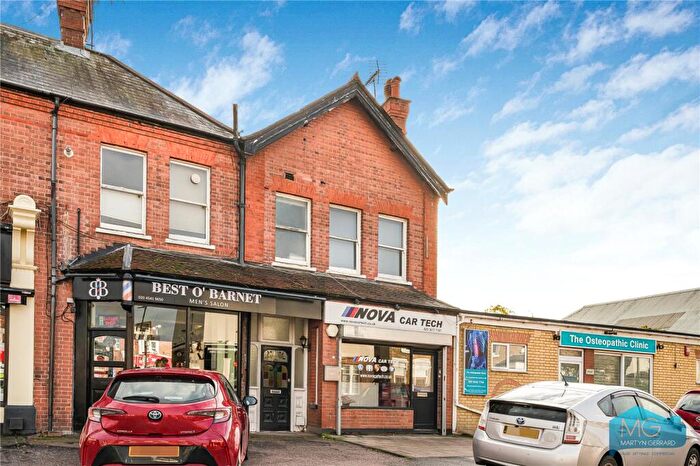
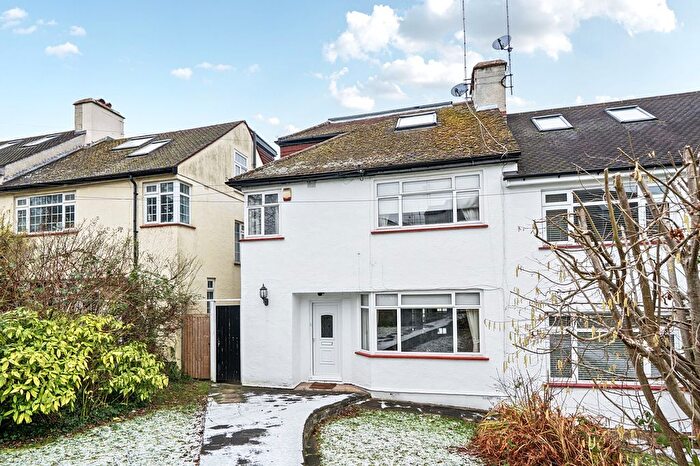
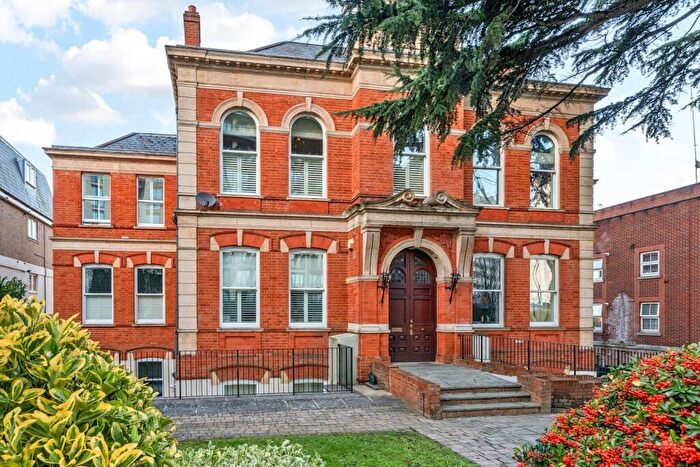
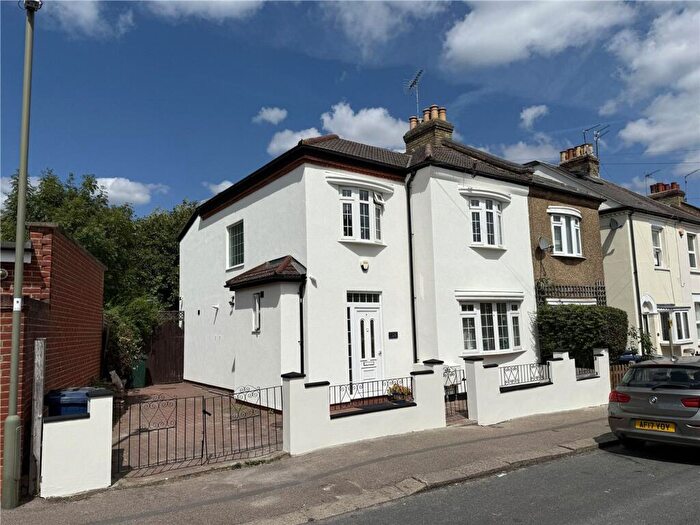
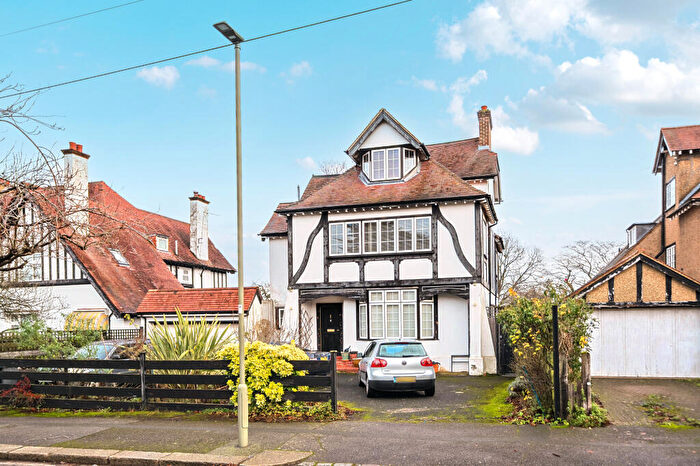
Properties for sale near EN5 1NU, Landsdown Close

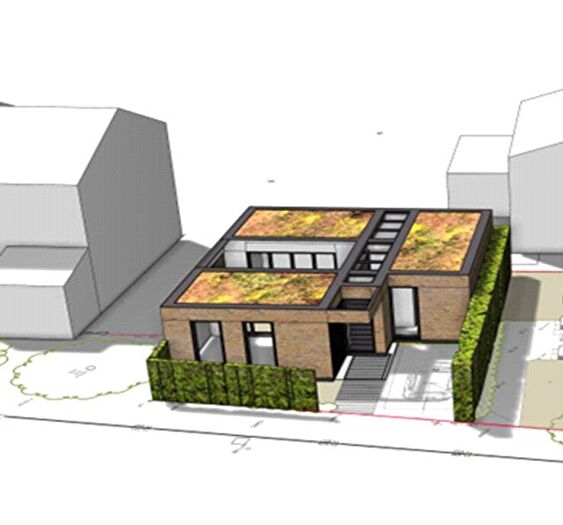
![]()
If you are looking to sell your house, let it out, or receive a property valuation, an expert can help you.
Click the button below to get started.

Price Paid in Landsdown Close, EN5 1NU, Oakleigh
2 Landsdown Close, EN5 1NU, Oakleigh Barnet
Property 2 has been sold 3 times. The last time it was sold was in 23/02/2021 and the sold price was £862,000.00.
This detached house, sold as a freehold on 23/02/2021, is a 64 sqm detached bungalow with an EPC rating of C.
| Date | Price | Property Type | Tenure | Classification |
|---|---|---|---|---|
| 23/02/2021 | £862,000.00 | Detached House | freehold | Established Building |
| 17/04/2014 | £626,000.00 | Detached House | freehold | Established Building |
| 03/03/2006 | £495,000.00 | Detached House | freehold | New Build |
1 Landsdown Close, EN5 1NU, Oakleigh Barnet
Property 1 has been sold 3 times. The last time it was sold was in 14/12/2017 and the sold price was £840,000.00.
This detached house, sold as a freehold on 14/12/2017, is a 129 sqm detached house with an EPC rating of D.
| Date | Price | Property Type | Tenure | Classification |
|---|---|---|---|---|
| 14/12/2017 | £840,000.00 | Detached House | freehold | Established Building |
| 26/02/2014 | £599,950.00 | Detached House | freehold | Established Building |
| 01/11/2006 | £480,000.00 | Semi Detached House | freehold | Established Building |
Transport near EN5 1NU, Landsdown Close
-
 New Barnet Station
 -
 High Barnet Station
 -
Oakleigh Park Station
-
Cockfosters Station
-
Totteridge and Whetstone Station
-
Hadley Wood Station
-
Oakwood Station
-
Woodside Park Station
-
Southgate Station
-
West Finchley Station
House price paid reports for EN5 1NU, Landsdown Close
Click on the buttons below to see price paid reports by year or property price:
- Price Paid By Year
Property Price Paid in EN5 1NU, Landsdown Close by Year
The average sold property price by year was:
| Year | Average Sold Price | Price Change |
Sold Properties
|
|---|---|---|---|
| 2021 | £862,000 | 3% |
1 Property |
| 2017 | £840,000 | 27% |
1 Property |
| 2014 | £612,975 | 20% |
2 Properties |
| 2006 | £487,500 | - |
2 Properties |