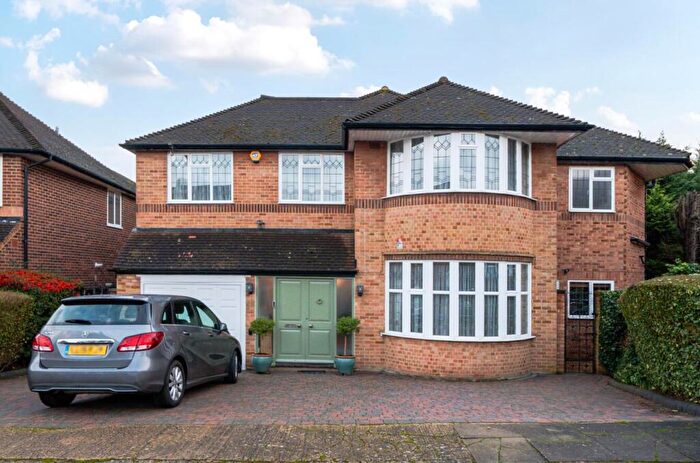
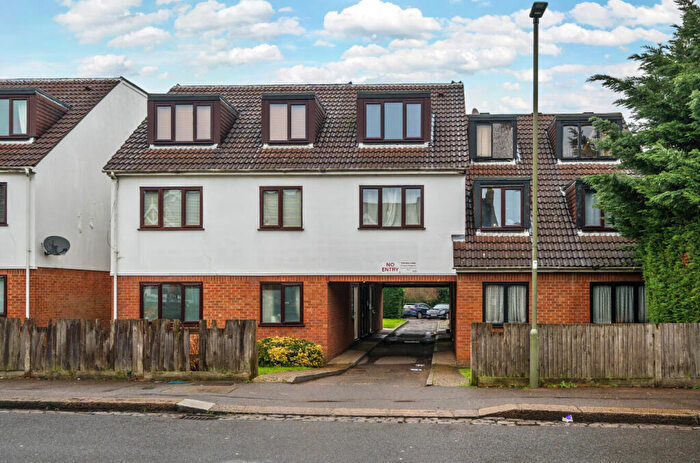
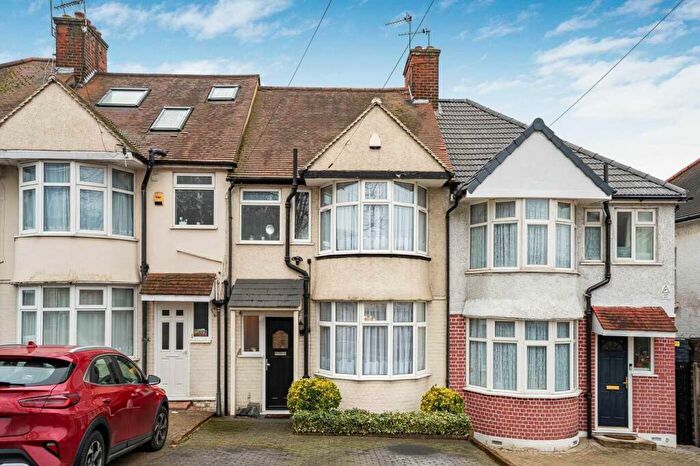
Houses for sale & to rent in Barnet, Barnet London Borough
House Prices in Barnet
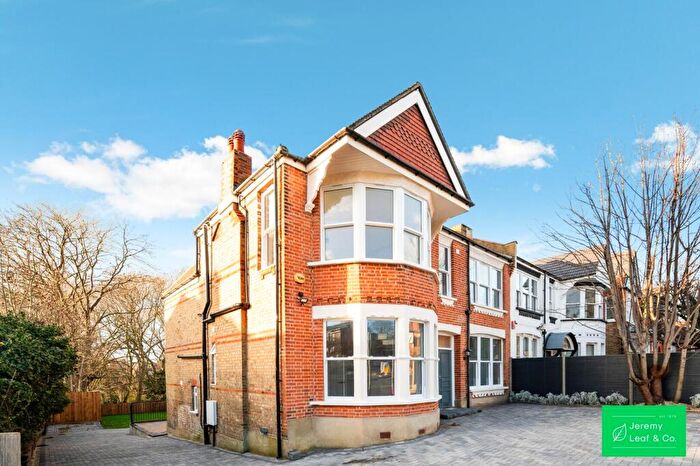
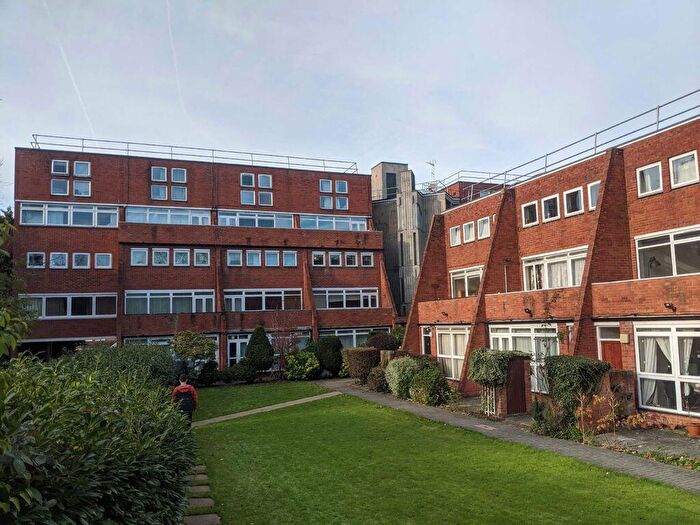
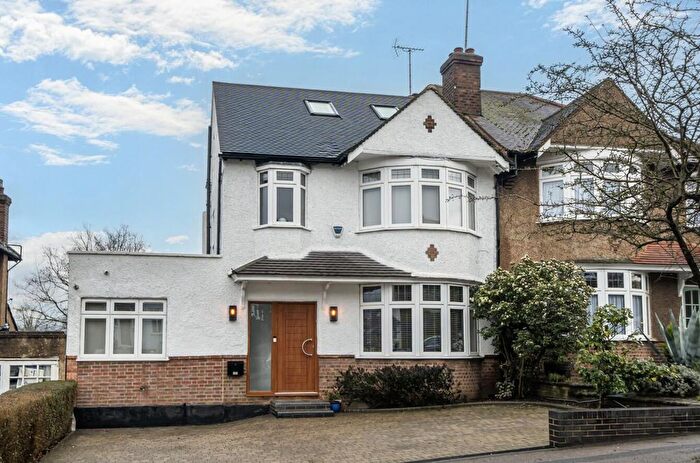
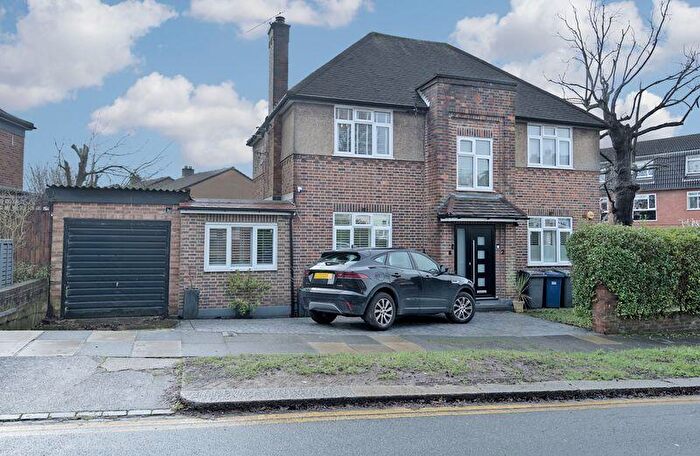
Properties in this part of Barnet within the Barnet London Borough have an average house price of £600,026.00 and had 1,815 Property Transactions within the last 3 years.¹ This area has 23,252 households² , where the most expensive property was sold for £6,000,000.00.
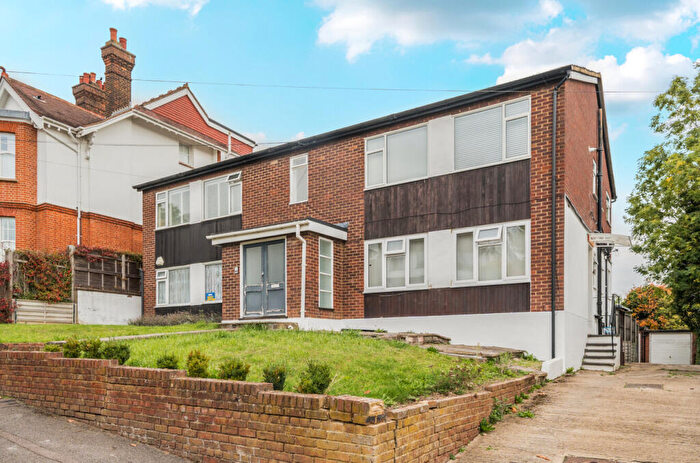
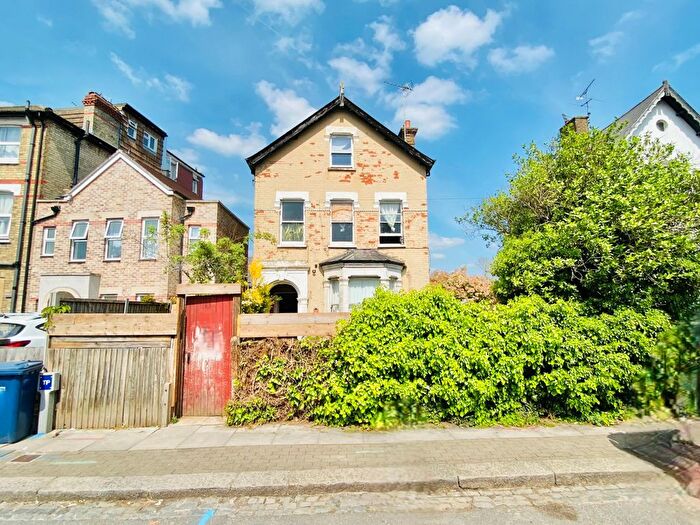
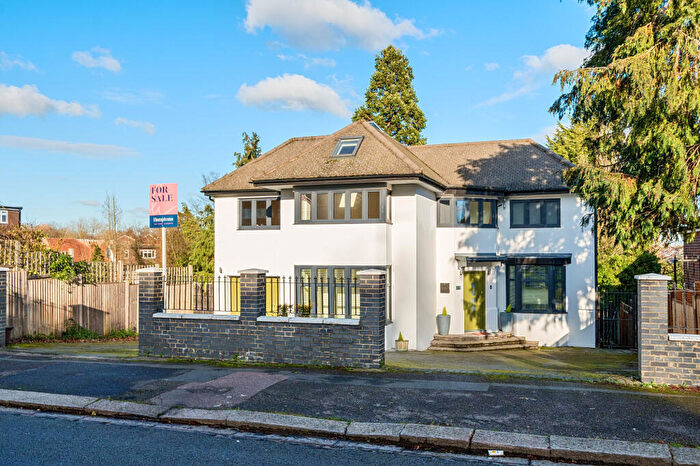
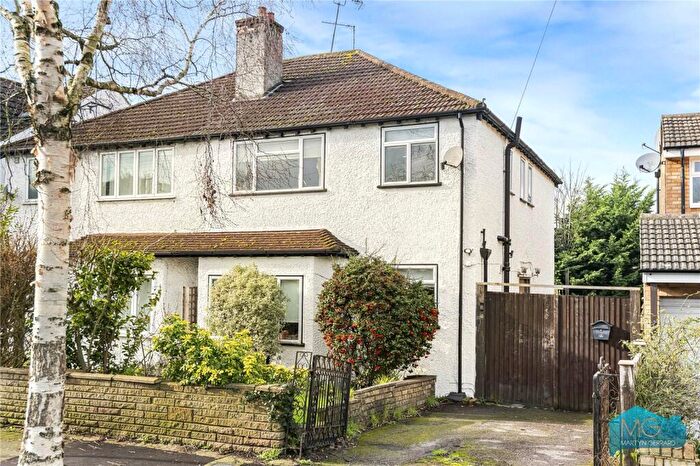
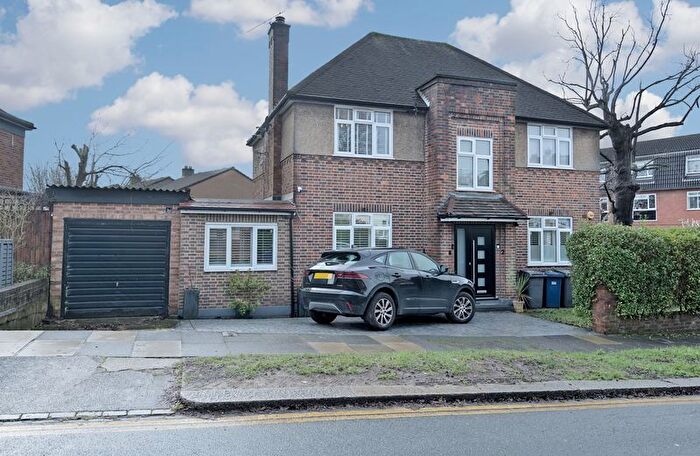
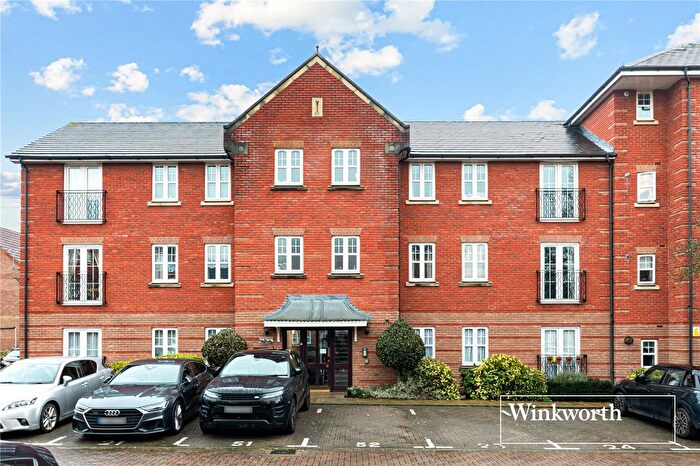
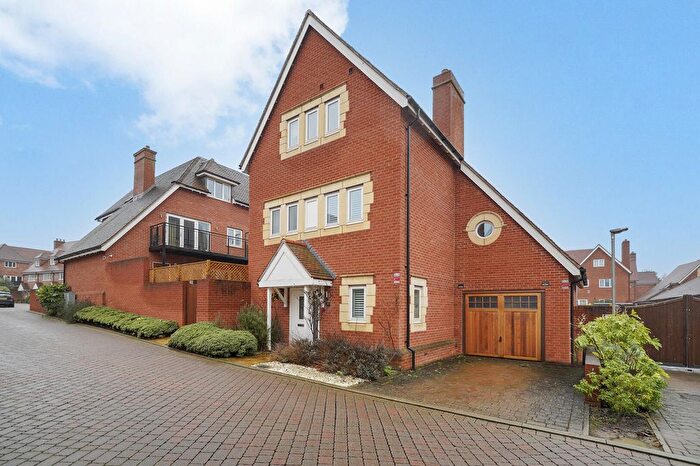
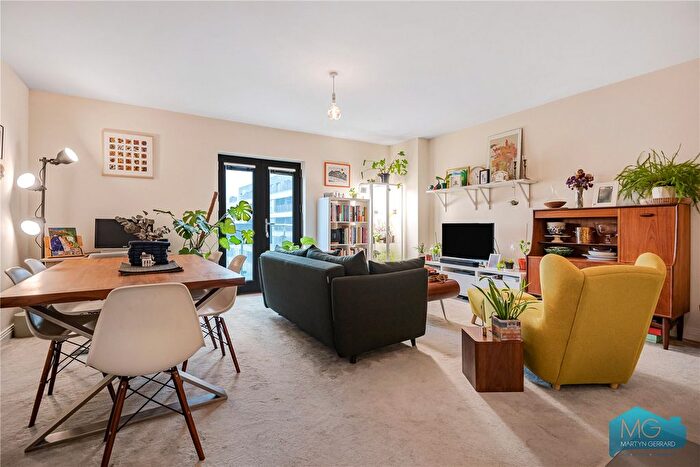
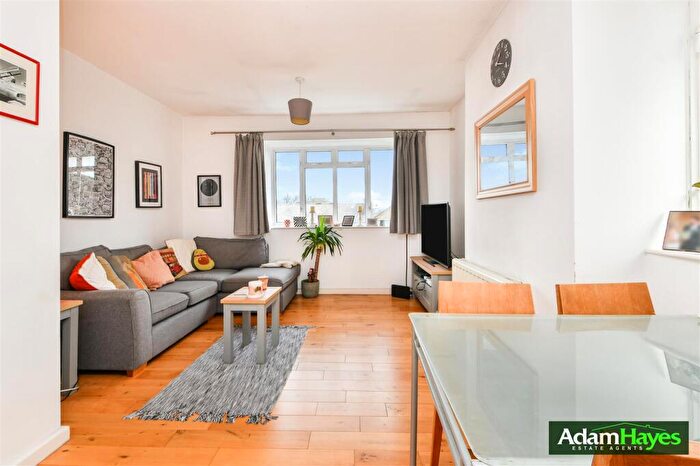
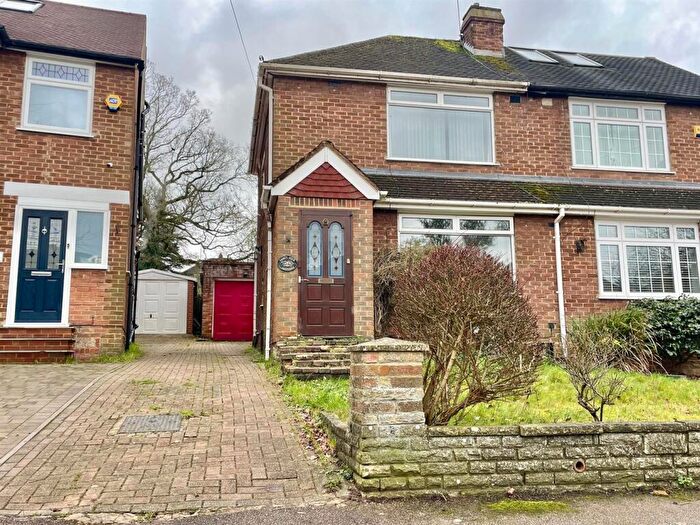
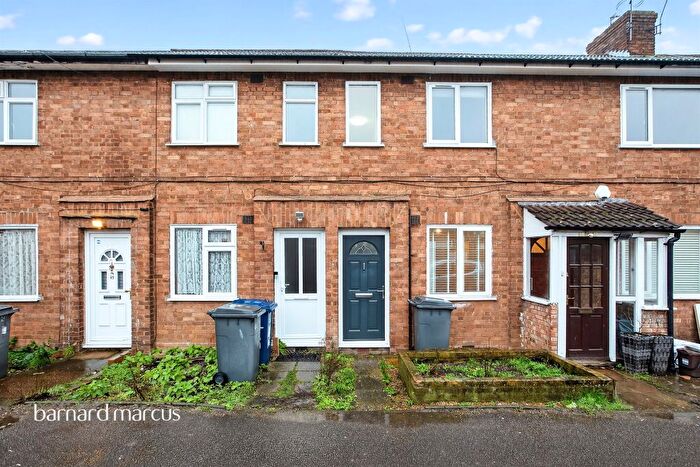
Properties for sale in Barnet
Neighbourhoods in Barnet
Navigate through our locations to find the location of your next house in Barnet, Barnet London Borough for sale or to rent.
Transport in Barnet
Please see below transportation links in this area:
-
High Barnet Station
-
New Barnet Station
-
Oakleigh Park Station
-
Totteridge and Whetstone Station
-
Hadley Wood Station
-
Cockfosters Station
-
Woodside Park Station
-
Oakwood Station
-
West Finchley Station
-
Southgate Station
- FAQ
- Price Paid By Year
- Property Type Price
Frequently asked questions about Barnet
What is the average price for a property for sale in Barnet?
The average price for a property for sale in Barnet is £600,026. This amount is 19% lower than the average price in Barnet London Borough. There are more than 10,000 property listings for sale in Barnet.
What locations have the most expensive properties for sale in Barnet?
The locations with the most expensive properties for sale in Barnet are Oakleigh at an average of £640,802, High Barnet at an average of £625,546 and Brunswick Park at an average of £619,403.
What locations have the most affordable properties for sale in Barnet?
The locations with the most affordable properties for sale in Barnet are East Barnet at an average of £552,902 and Underhill at an average of £592,179.
Which train stations are available in or near Barnet?
Some of the train stations available in or near Barnet are New Barnet, Oakleigh Park and Hadley Wood.
Which tube stations are available in or near Barnet?
Some of the tube stations available in or near Barnet are High Barnet, Totteridge and Whetstone and Cockfosters.
Property Price Paid in Barnet by Year
The average sold property price by year was:
| Year | Average Sold Price | Price Change |
Sold Properties
|
|---|---|---|---|
| 2025 | £606,535 | 1% |
567 Properties |
| 2024 | £600,723 | 1% |
688 Properties |
| 2023 | £592,578 | -5% |
560 Properties |
| 2022 | £620,641 | -2% |
829 Properties |
| 2021 | £632,273 | 3% |
1,020 Properties |
| 2020 | £613,520 | 9% |
649 Properties |
| 2019 | £559,344 | 2% |
652 Properties |
| 2018 | £550,615 | 2% |
753 Properties |
| 2017 | £539,301 | 0,4% |
762 Properties |
| 2016 | £536,884 | 10% |
901 Properties |
| 2015 | £484,148 | 12% |
953 Properties |
| 2014 | £424,777 | 5% |
975 Properties |
| 2013 | £403,118 | 3% |
863 Properties |
| 2012 | £392,663 | 5% |
698 Properties |
| 2011 | £372,510 | 4% |
695 Properties |
| 2010 | £358,919 | 10% |
796 Properties |
| 2009 | £324,012 | -4% |
614 Properties |
| 2008 | £336,801 | 1% |
559 Properties |
| 2007 | £332,134 | 10% |
1,303 Properties |
| 2006 | £298,990 | 7% |
1,297 Properties |
| 2005 | £277,216 | 2% |
1,014 Properties |
| 2004 | £271,615 | 9% |
1,172 Properties |
| 2003 | £246,913 | 7% |
1,114 Properties |
| 2002 | £229,636 | 13% |
1,439 Properties |
| 2001 | £199,166 | 13% |
1,312 Properties |
| 2000 | £173,268 | 18% |
1,216 Properties |
| 1999 | £141,443 | 12% |
1,449 Properties |
| 1998 | £125,040 | 10% |
1,178 Properties |
| 1997 | £112,795 | 11% |
1,317 Properties |
| 1996 | £100,489 | -1% |
1,251 Properties |
| 1995 | £101,901 | - |
912 Properties |
Property Price per Property Type in Barnet
Here you can find historic sold price data in order to help with your property search.
The average Property Paid Price for specific property types in the last three years are:
| Property Type | Average Sold Price | Sold Properties |
|---|---|---|
| Semi Detached House | £740,594.00 | 538 Semi Detached Houses |
| Terraced House | £605,516.00 | 413 Terraced Houses |
| Detached House | £1,110,442.00 | 182 Detached Houses |
| Flat | £349,602.00 | 682 Flats |

