
Houses for sale & to rent in Timsbury, Bath
House Prices in Timsbury
Properties in Timsbury have an average house price of £391k and had 101 Property Transactions within the last 3 years¹.
Timsbury is an area in Bath, Bath and North East Somerset with 1,113 households², where the most expensive property was sold for £2M.
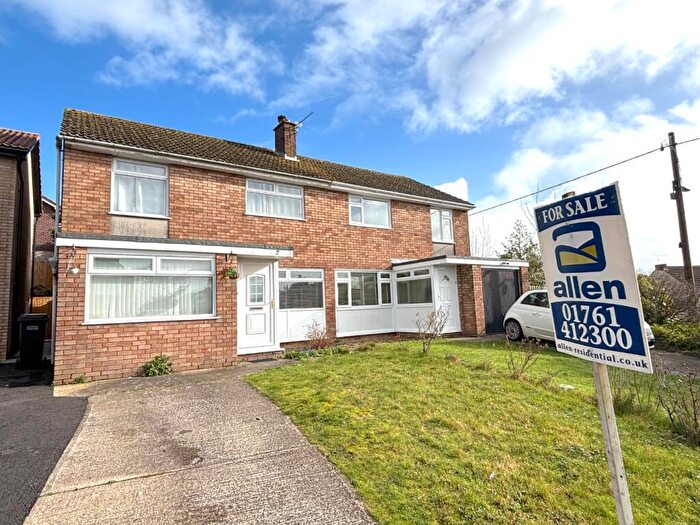
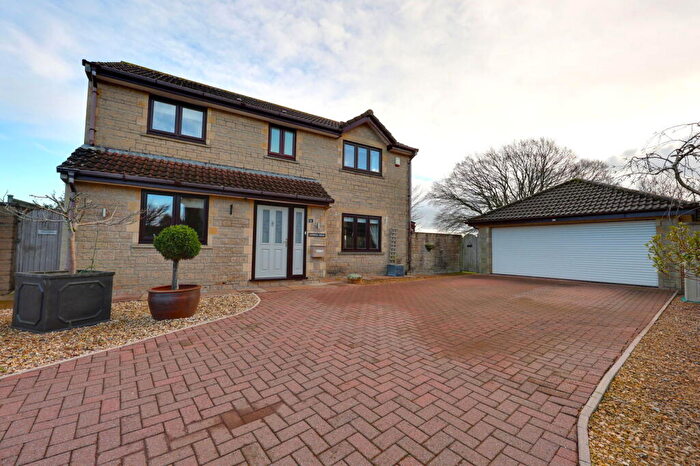
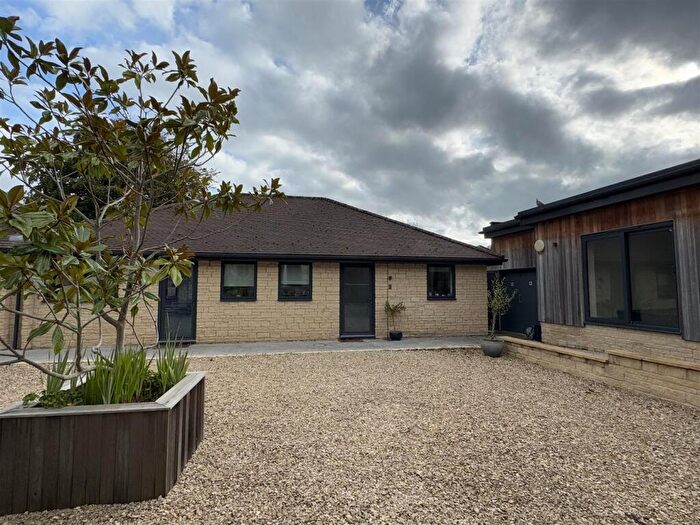
Properties for sale in Timsbury
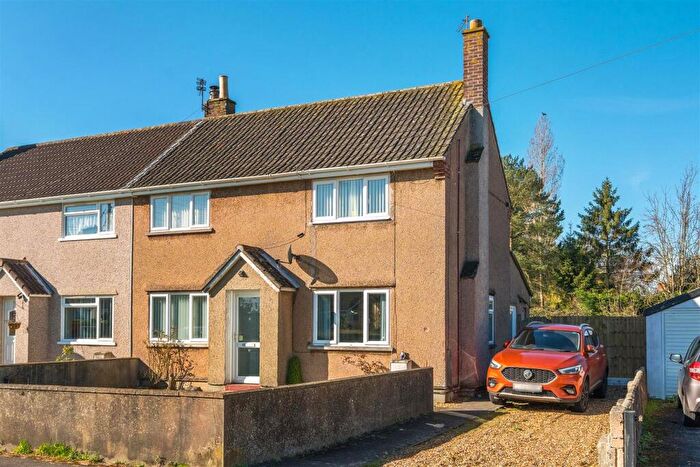
![]()
If you are looking to sell your house, let it out, or receive a property valuation, an expert can help you.
Click the button below to get started.
Previously listed properties in Timsbury
Roads and Postcodes in Timsbury
Navigate through our locations to find the location of your next house in Timsbury, Bath for sale or to rent.
| Streets | Postcodes |
|---|---|
| Amesbury | BA2 0HF |
| Bakers Parade | BA2 0LY |
| Bloomfield Avenue | BA2 0LS BA2 0LW |
| Bloomfield Close | BA2 0LP |
| Bloomfield Park Road | BA2 0LN BA2 0LR |
| Bloomfield Road | BA2 0AA BA2 0LH BA2 0LJ BA2 0LQ |
| Chapel Row | BA2 0JL |
| Chapel Walk | BA2 0JZ |
| Church Hill | BA2 0LG |
| Church Lane | BA2 0LF |
| Conygre Green | BA2 0JU |
| Crockbarton | BA2 0JY |
| Crocombe | BA2 0JS BA2 0SJ |
| Crocombe Lane | BA2 0JW |
| Greenvale | BA2 0EW |
| Greenvale Close | BA2 0HS |
| Greenvale Drive | BA2 0HP BA2 0HW BA2 0NR |
| Hayeswood Road | BA2 0FQ |
| High Street | BA2 0HT |
| Hill View | BA2 0EL |
| Homefield | BA2 0LU |
| Hook | BA2 0NE |
| Hook Hill | BA2 0ND BA2 0NF BA2 0NG |
| Lansdown Crescent | BA2 0JX |
| Lansdown View | BA2 0JP BA2 0JR |
| Laurel Gardens | BA2 0EP |
| Lippiatt Lane | BA2 0JD BA2 0JE BA2 0JF BA2 0GE |
| Loves Hill | BA2 0EU |
| Maggs Hill | BA2 0LX |
| Meadgate | BA2 0NQ |
| Mill Lane | BA2 0EH BA2 0EN |
| Newmans Lane | BA2 0JA BA2 0JB |
| North Road | BA2 0JH BA2 0JJ BA2 0JN BA2 0JQ |
| Northfield | BA2 0JT |
| Parkway Lane | BA2 0NT |
| Priors Hill | BA2 0DG BA2 0HE |
| Radford | BA2 0QF |
| Radford Hill | BA2 0LE BA2 0QQ BA2 0QP |
| Rectory Lane | BA2 0LA BA2 0LB |
| Sleight View | BA2 0LL |
| Somerset Folly | BA2 0HD |
| South Road | BA2 0EJ BA2 0ER BA2 0LD BA2 0NA BA2 0NB BA2 0ES |
| South View | BA2 0LZ |
| Southlands Drive | BA2 0HB |
| St Johns Road | BA2 0HR |
| St Marys Close | BA2 0HX |
| St Marys Green | BA2 0HA |
| Sunnyside Gardens | BA2 0BQ |
| The Avenue | BA2 0HU |
| The Elms | BA2 0HZ |
| The Glebe | BA2 0LT |
| The Mead | BA2 0NS |
| The Square | BA2 0HY |
| Timsbury Bottom | BA2 0EX BA2 0EZ |
| Timsbury Industrial Estate | BA2 0HQ |
| Tyning | BA2 0HG |
| Upper Furlong | BA2 0NN |
| Weekesley Lane | BA2 0NH |
| Withymills Cottages | BA2 0EY |
| BA2 0ET BA2 0HN |
Transport near Timsbury
-
 Oldfield Park Station
 -
Bath Spa Station
-
Keynsham Station
-
Freshford Station
-
Avoncliff Station
-
Parson Street Station
-
Bedminster Station
-
Bristol Temple Meads Station
-
Lawrence Hill Station
-
Bradford-On-Avon Station
- FAQ
- Price Paid By Year
- Property Type Price
Frequently asked questions about Timsbury
What is the average price for a property for sale in Timsbury?
The average price for a property for sale in Timsbury is £391,357. This amount is 29% lower than the average price in Bath. There are 210 property listings for sale in Timsbury.
What streets have the most expensive properties for sale in Timsbury?
The streets with the most expensive properties for sale in Timsbury are Withymills Cottages at an average of £650,000, The Mead at an average of £575,000 and Newmans Lane at an average of £560,000.
What streets have the most affordable properties for sale in Timsbury?
The streets with the most affordable properties for sale in Timsbury are Conygre Green at an average of £221,250, Greenvale Drive at an average of £251,171 and Church Lane at an average of £255,000.
Which train stations are available in or near Timsbury?
Some of the train stations available in or near Timsbury are Oldfield Park, Bath Spa and Keynsham.
Property Price Paid in Timsbury by Year
The average sold property price by year was:
| Year | Average Sold Price | Price Change |
Sold Properties
|
|---|---|---|---|
| 2025 | £346,584 | 5% |
38 Properties |
| 2024 | £329,360 | -50% |
29 Properties |
| 2023 | £494,279 | 28% |
34 Properties |
| 2022 | £355,217 | 6% |
42 Properties |
| 2021 | £332,200 | 6% |
56 Properties |
| 2020 | £310,895 | 4% |
34 Properties |
| 2019 | £297,557 | -3% |
26 Properties |
| 2018 | £307,594 | 6% |
34 Properties |
| 2017 | £287,955 | 5% |
35 Properties |
| 2016 | £272,383 | 9% |
46 Properties |
| 2015 | £248,460 | -1% |
51 Properties |
| 2014 | £252,161 | -49% |
44 Properties |
| 2013 | £376,173 | 44% |
23 Properties |
| 2012 | £210,016 | -38% |
39 Properties |
| 2011 | £289,317 | 31% |
34 Properties |
| 2010 | £198,672 | 4% |
20 Properties |
| 2009 | £190,754 | -16% |
34 Properties |
| 2008 | £222,153 | -17% |
26 Properties |
| 2007 | £260,726 | 19% |
56 Properties |
| 2006 | £211,369 | -2% |
44 Properties |
| 2005 | £216,104 | 14% |
46 Properties |
| 2004 | £185,579 | 3% |
53 Properties |
| 2003 | £180,404 | 14% |
56 Properties |
| 2002 | £154,378 | 9% |
52 Properties |
| 2001 | £140,721 | -16% |
32 Properties |
| 2000 | £162,988 | 43% |
40 Properties |
| 1999 | £92,092 | -1% |
41 Properties |
| 1998 | £93,470 | 10% |
39 Properties |
| 1997 | £84,492 | 5% |
65 Properties |
| 1996 | £80,475 | 14% |
64 Properties |
| 1995 | £69,100 | - |
26 Properties |
Property Price per Property Type in Timsbury
Here you can find historic sold price data in order to help with your property search.
The average Property Paid Price for specific property types in the last three years are:
| Property Type | Average Sold Price | Sold Properties |
|---|---|---|
| Semi Detached House | £347,046.00 | 32 Semi Detached Houses |
| Detached House | £583,125.00 | 28 Detached Houses |
| Terraced House | £299,317.00 | 32 Terraced Houses |
| Flat | £279,555.00 | 9 Flats |