
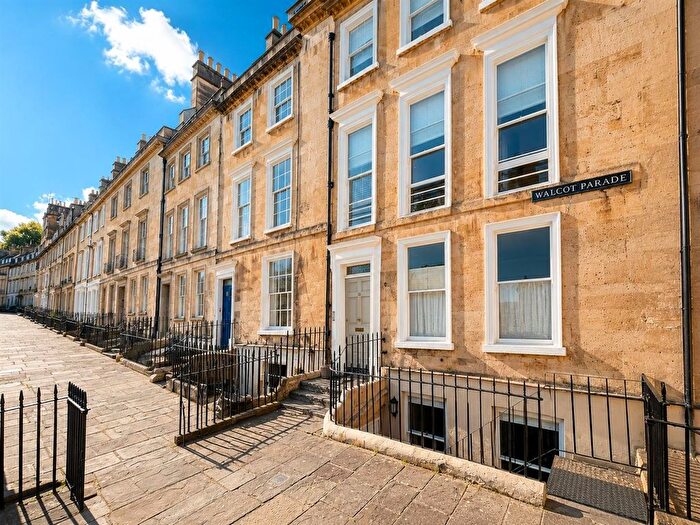
Houses for sale in Bath, Bath and North East Somerset
House Prices in Bath
Properties in Bath have an average house price of £549k and had 4,969 Property Transactions within the last 3 years.¹
Bath is an area in Bath and North East Somerset with 49,030 households², where the most expensive property was sold for £6M.
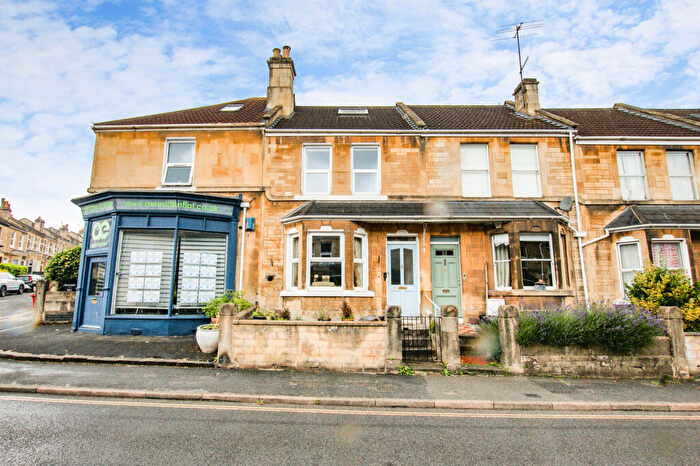
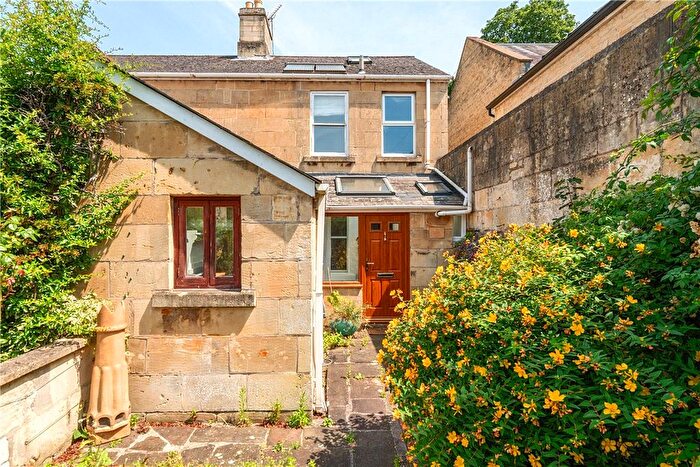
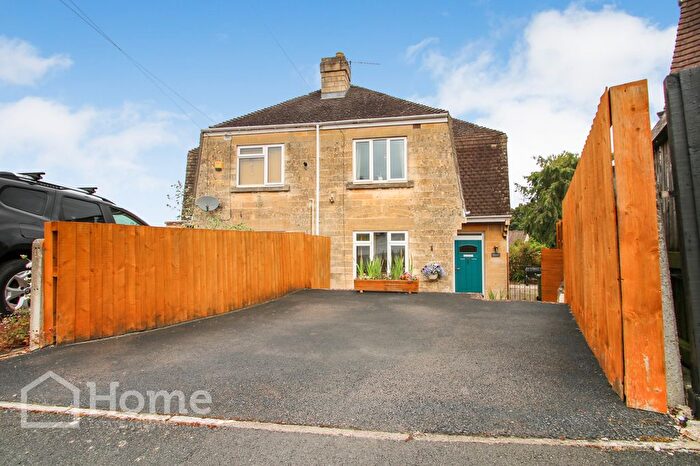
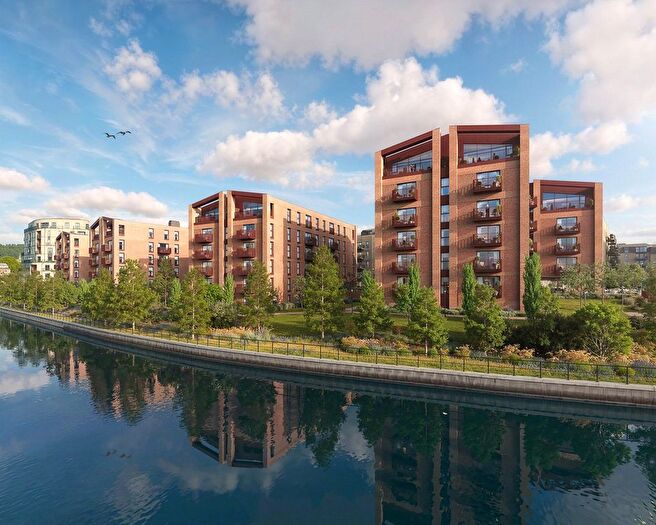
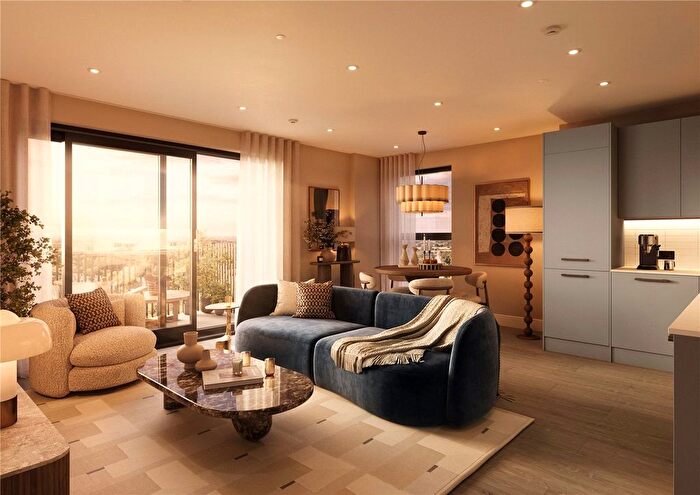
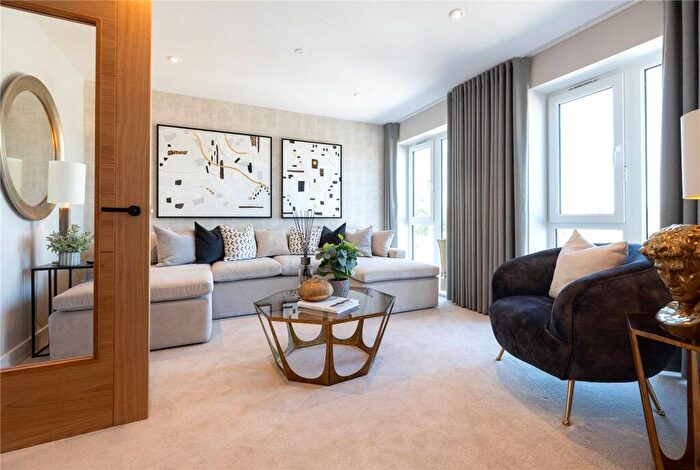
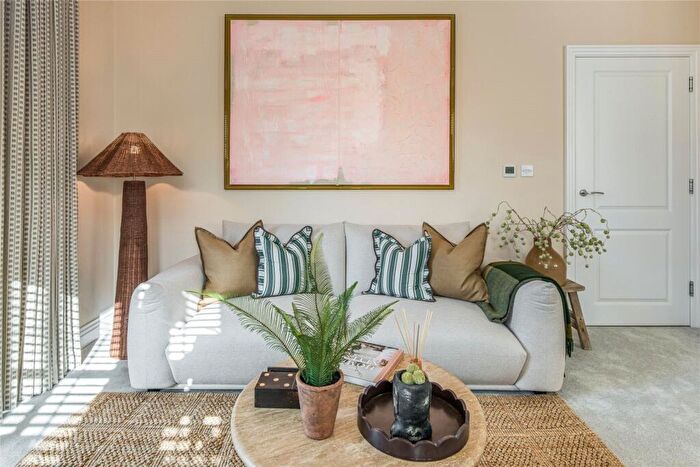
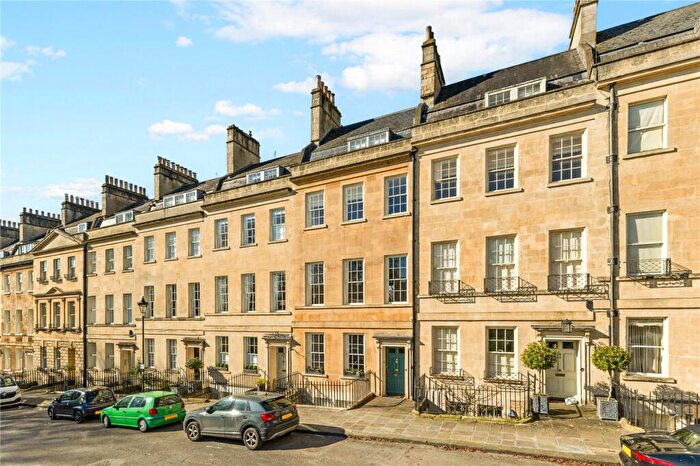
Properties for sale in Bath
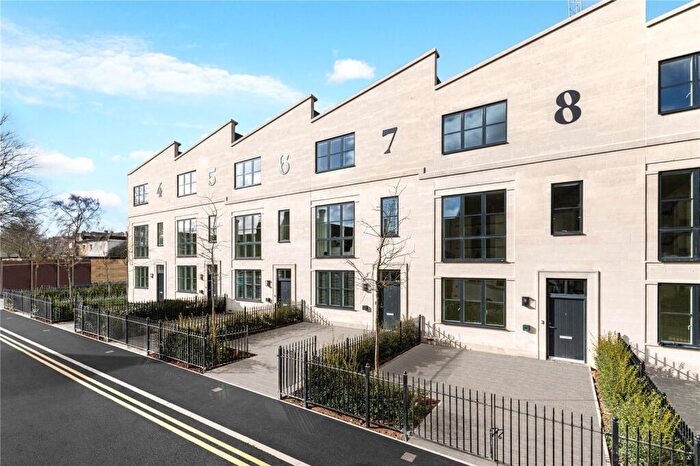
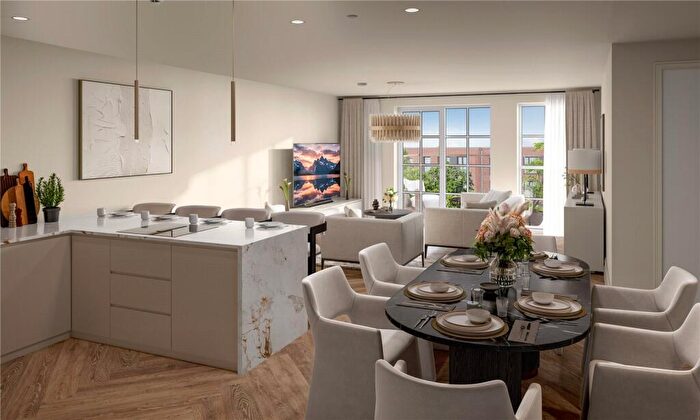
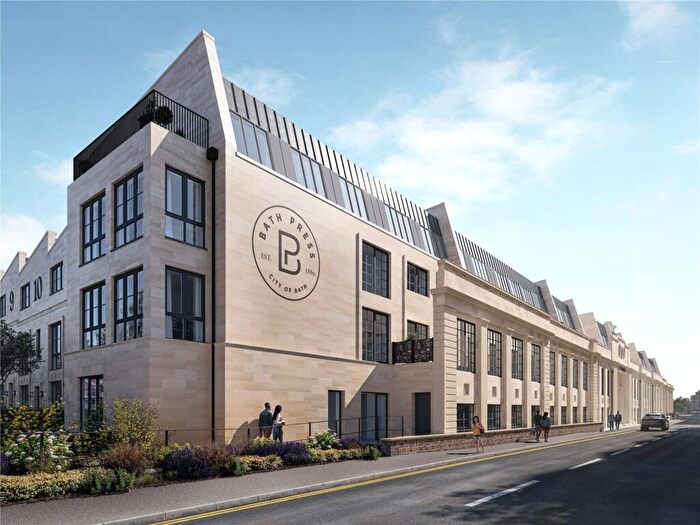
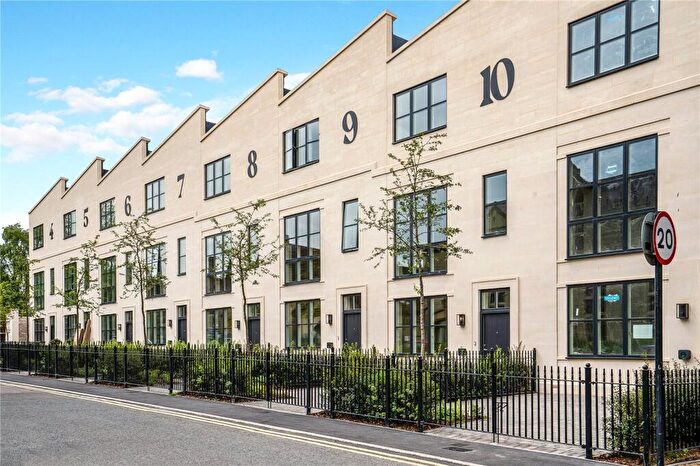

![]()
If you are looking to sell your house, let it out, or receive a property valuation, an expert can help you.
Click the button below to get started.
Neighbourhoods in Bath
Navigate through our locations to find the location of your next house in Bath, Bath and North East Somerset for sale or to rent.
Property price trends in Bath
According to the latest Land Registry data, the average home in Bath sold for £508,267 in 2026. That figure comes from a substantial record of 63,029 sales logged over the past 31 years.
Prices have fallen back over the last three years. Compared with 2023, when the typical sale came in around £552,222, that's a fall of roughly 8%.
Looking back five years, average prices are down about 1.8% since 2021, a drop of around £9,112 in cash terms.
Zoom out to the past decade for the fuller picture. Back in 2016, homes here averaged £436,112, so the typical sold price has climbed about 16.5% since then, roughly 1.5% a year. Stretch the view to fifteen years and that annual pace edges up closer to 3.2%.
Frequently asked questions about Bath
What is the average price for a property for sale in Bath?
The average price for a property for sale in Bath is £548,691. This amount is 13% higher than the average price in Bath and North East Somerset. There are more than 10,000 property listings for sale in Bath.
What locations have the most expensive properties for sale in Bath?
The locations with the most expensive properties for sale in Bath are Bathwick at an average of £993,124, Lansdown at an average of £875,821 and Bathavon South at an average of £750,923.
What locations have the most affordable properties for sale in Bath?
The locations with the most affordable properties for sale in Bath are Twerton at an average of £321,433, Peasedown at an average of £344,089 and Odd Down at an average of £355,197.
Which train stations are available in or near Bath?
Some of the train stations available in or near Bath are Oldfield Park, Bath Spa and Freshford.
Property Price Paid in Bath by Year
The average sold property price by year was:
| Year | Average Sold Price | Price Change |
Sold Properties
|
|---|---|---|---|
| 2026 | £508,267 | -6% |
98 Properties |
| 2025 | £538,291 | -4% |
1,573 Properties |
| 2024 | £557,193 | 1% |
1,745 Properties |
| 2023 | £552,222 | -2% |
1,553 Properties |
| 2022 | £561,134 | 8% |
1,896 Properties |
| 2021 | £517,379 | 6% |
2,384 Properties |
| 2020 | £487,055 | 2% |
1,543 Properties |
| 2019 | £476,804 | 4% |
1,757 Properties |
| 2018 | £459,277 | 3% |
1,914 Properties |
| 2017 | £447,669 | 3% |
1,833 Properties |
Property Price per Property Type in Bath
Here you can find historic sold price data in order to help with your property search.
The average Property Paid Price for specific property types in the last three years are:
| Property Type | Average Sold Price | Sold Properties |
|---|---|---|
| Semi Detached House | £557,950.00 | 1,006 Semi Detached Houses |
| Terraced House | £517,493.00 | 1,798 Terraced Houses |
| Detached House | £928,408.00 | 811 Detached Houses |
| Flat | £355,803.00 | 1,354 Flats |
Transport in Bath
Please see below transportation links in this area:
