
Houses for sale & to rent in BS39 5UX, Chapel Cottages, Chew Valley South, Bristol
House Prices in BS39 5UX, Chapel Cottages, Chew Valley South
Properties in BS39 5UX have no sales history available within the last 3 years. BS39 5UX is a postcode in Chapel Cottages located in Chew Valley South, an area in Bristol, Bath and North East Somerset, with 3 households².
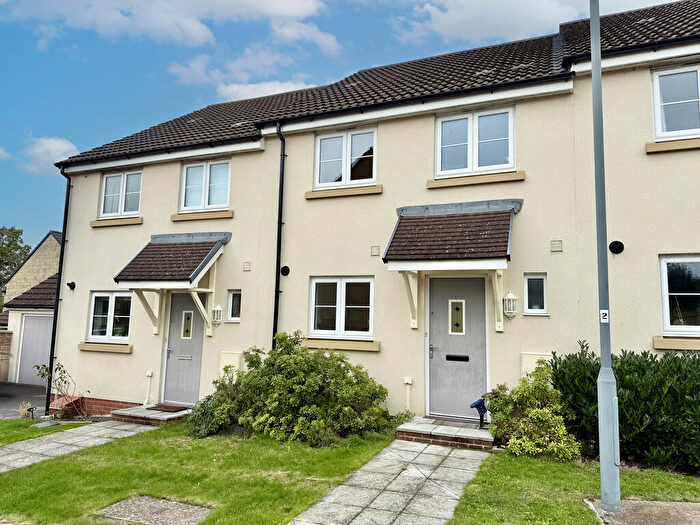
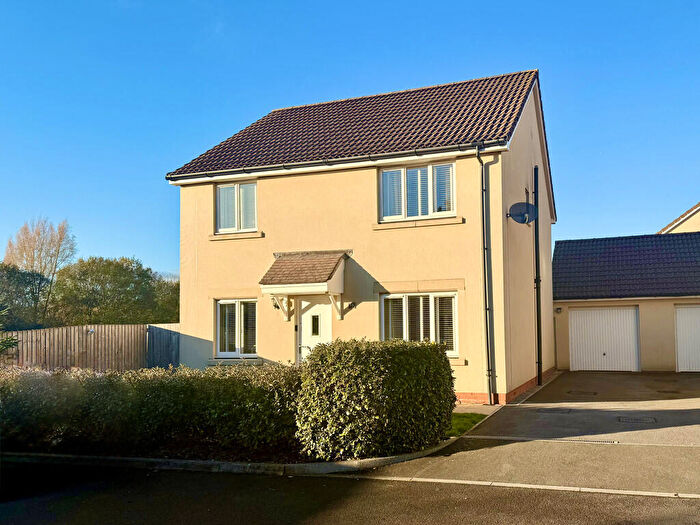
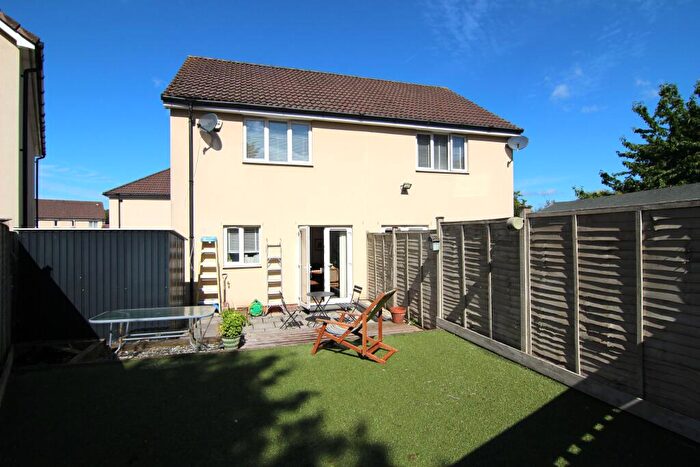
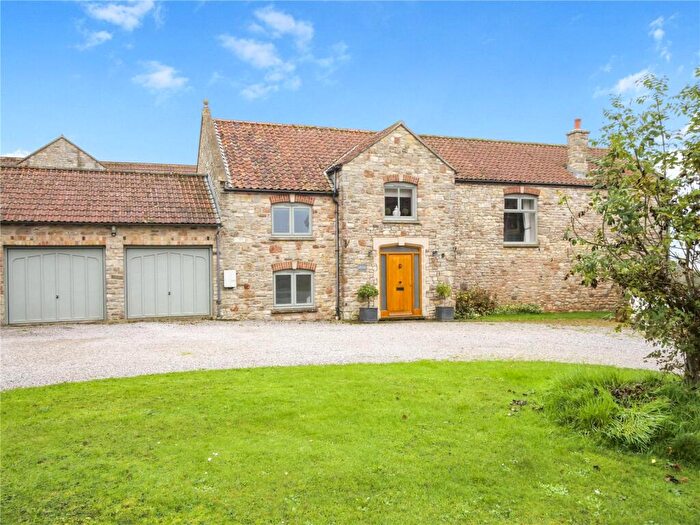
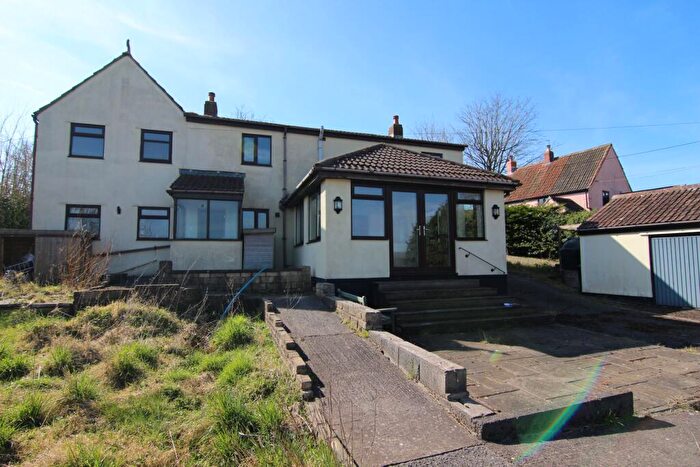
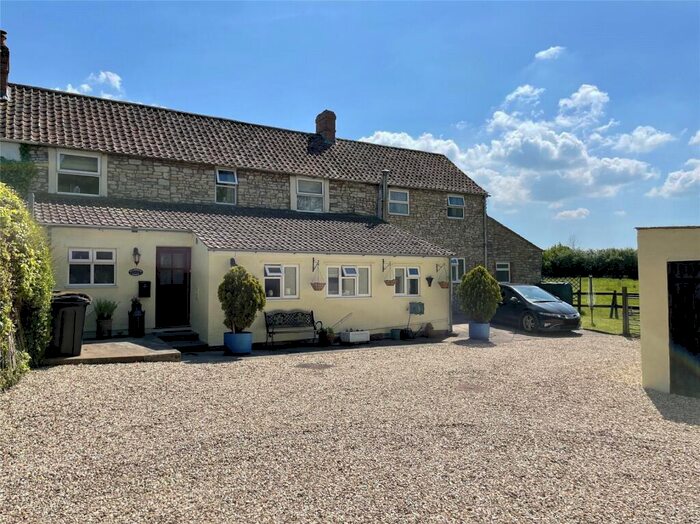
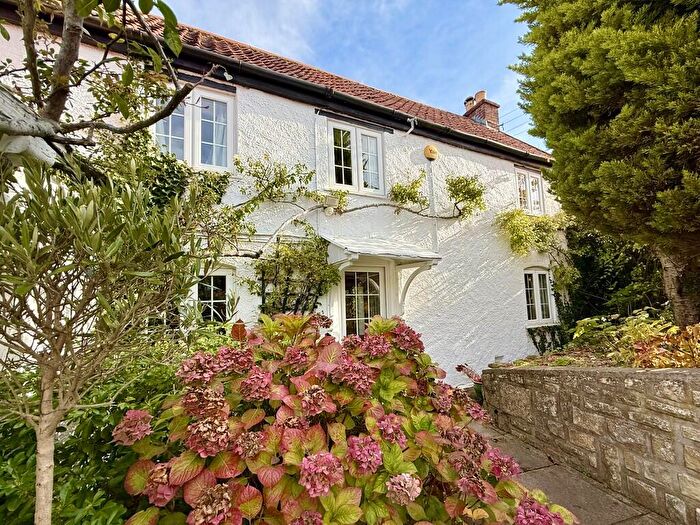
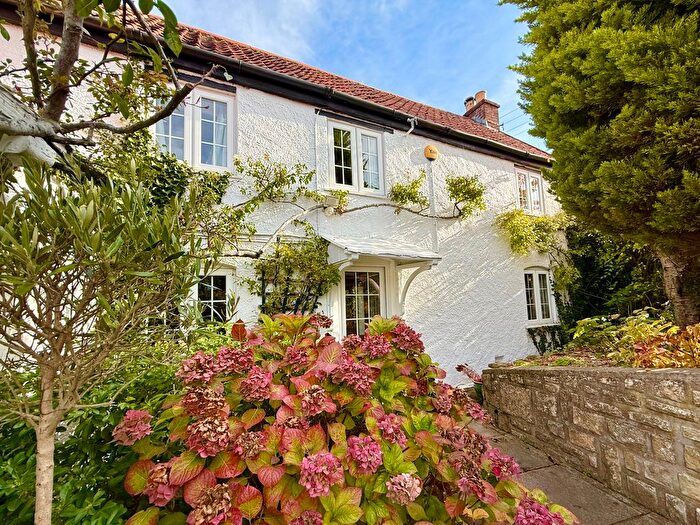
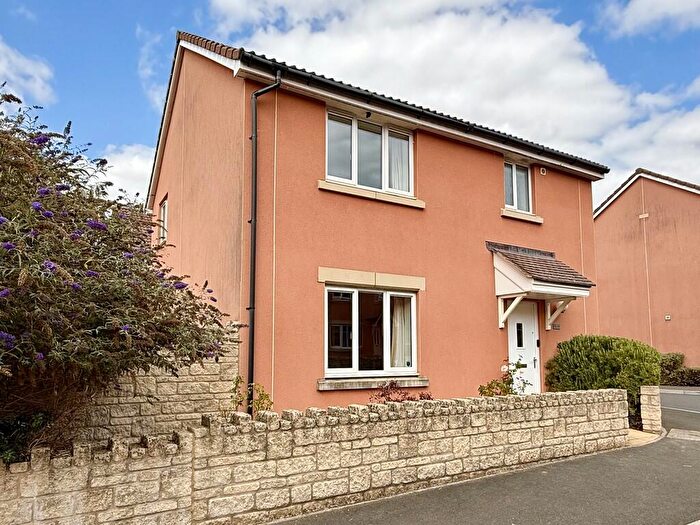
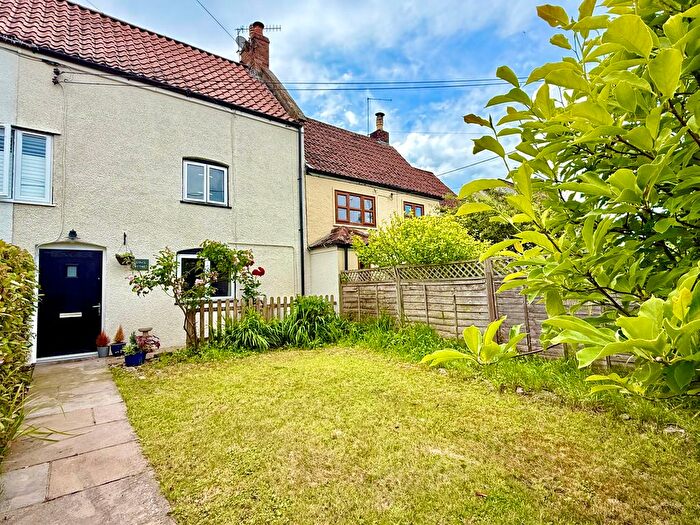
Properties for sale near BS39 5UX, Chapel Cottages
![]()
If you are looking to sell your house, let it out, or receive a property valuation, an expert can help you.
Click the button below to get started.
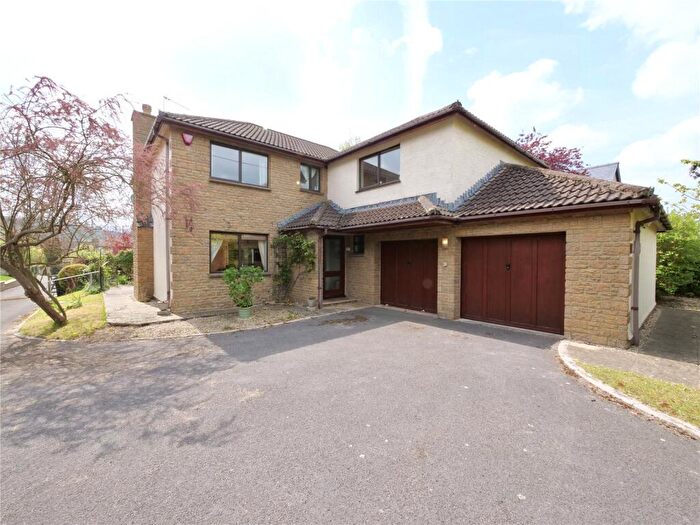
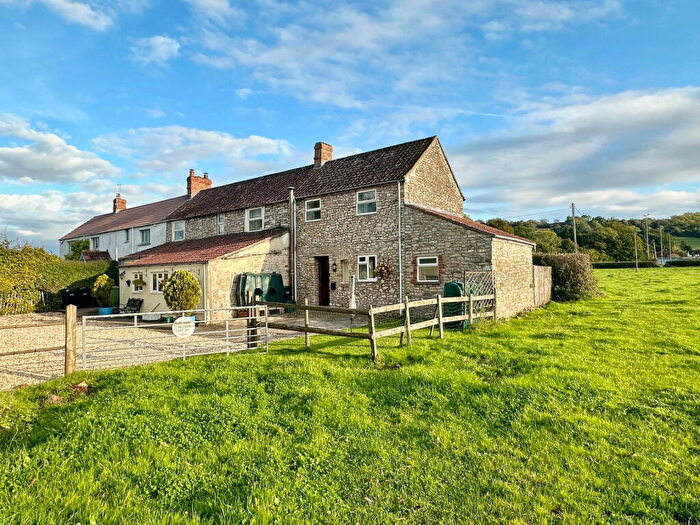
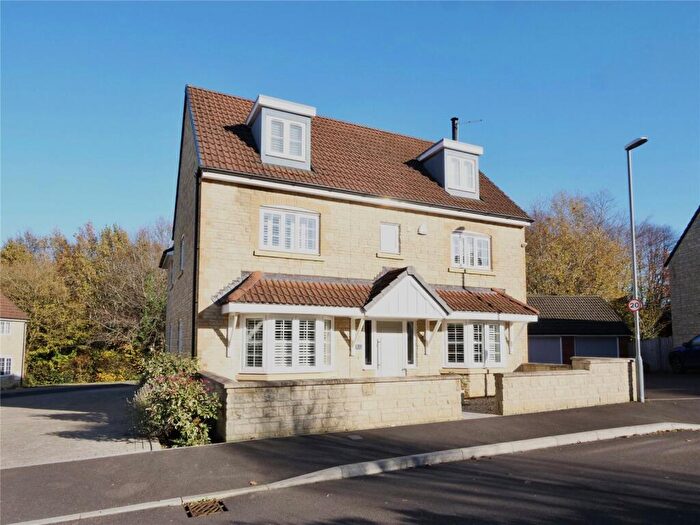
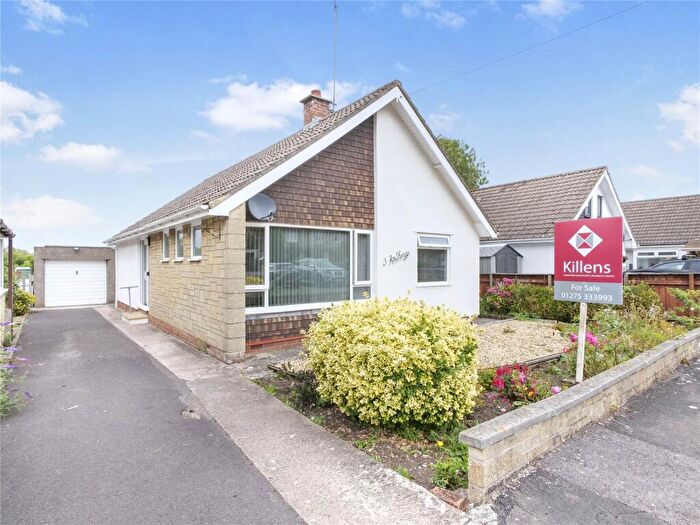
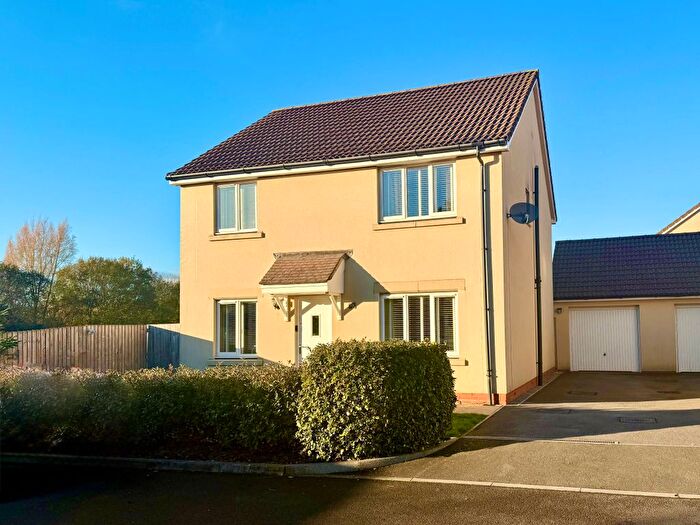
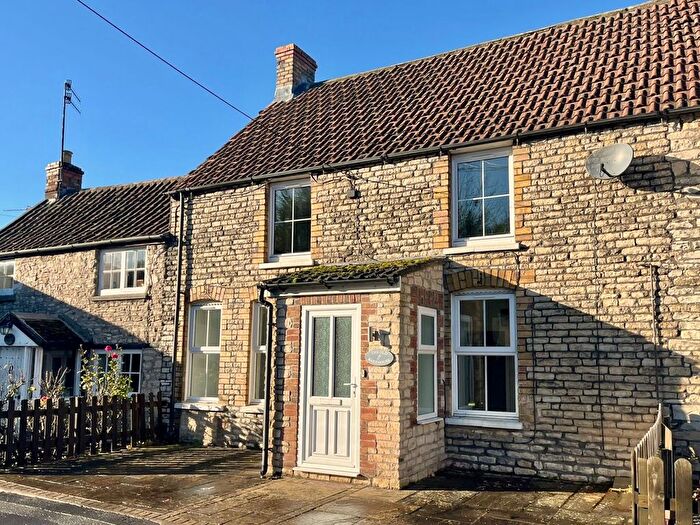
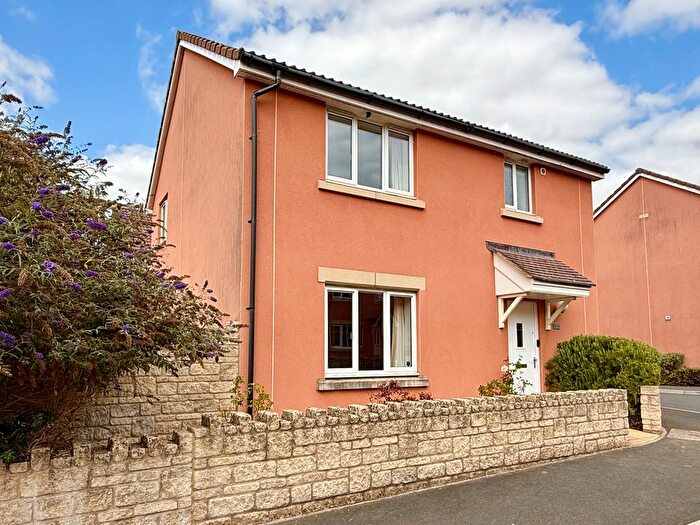
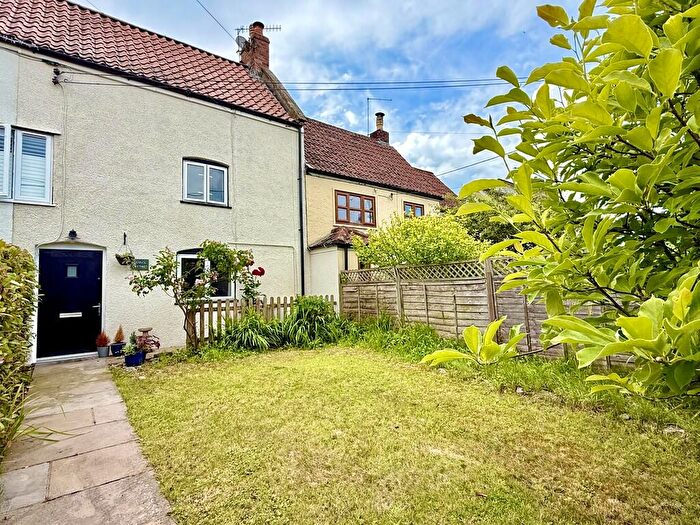
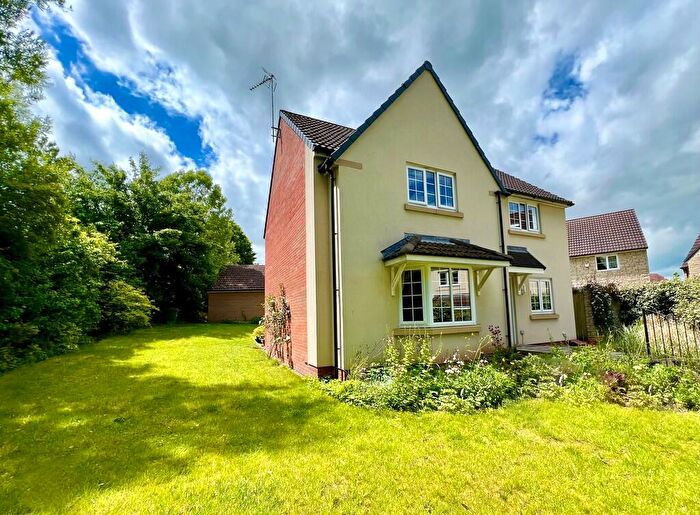
Previously listed properties near BS39 5UX, Chapel Cottages

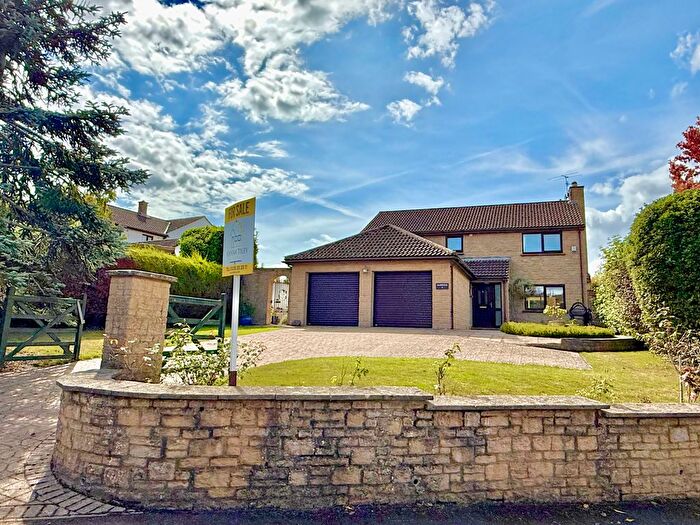
![]()
If you are looking to sell your house, let it out, or receive a property valuation, an expert can help you.
Click the button below to get started.


Price Paid in Chapel Cottages, BS39 5UX, Chew Valley South
CHAPEL COTTAGES 1 Chapel Cottages, BS39 5UX, Chew Valley South Bristol
Property CHAPEL COTTAGES 1 has been sold 2 times. The last time it was sold was in 04/06/2018 and the sold price was £300,000.00.
This is a Terraced House which was sold as a freehold in 04/06/2018
| Date | Price | Property Type | Tenure | Classification |
|---|---|---|---|---|
| 04/06/2018 | £300,000.00 | Terraced House | freehold | Established Building |
| 29/11/1995 | £54,500.00 | Terraced House | freehold | Established Building |
2 Chapel Cottages, BS39 5UX, Chew Valley South Bristol
Property 2 has been sold 2 times. The last time it was sold was in 14/07/2006 and the sold price was £195,000.00.
This terraced house, sold as a freehold on 14/07/2006, is a 58 sqm mid-terrace house with an EPC rating of D.
| Date | Price | Property Type | Tenure | Classification |
|---|---|---|---|---|
| 14/07/2006 | £195,000.00 | Terraced House | freehold | Established Building |
| 23/09/2002 | £102,500.00 | Terraced House | freehold | Established Building |
1 Chapel Cottages The Street Bishop Sutton, BS39 5UX, Chew Valley South Bristol
This is a 82 square meter End-terrace House with an EPC rating of D. Currently, there is no transaction history available for this property.
Transport near BS39 5UX, Chapel Cottages
-
 Parson Street Station
 -
Keynsham Station
-
Bedminster Station
-
Bristol Temple Meads Station
-
Lawrence Hill Station
-
Nailsea and Backwell Station
-
Clifton Down Station
-
Montpelier Station
-
Redland Station
-
Stapleton Road Station
House price paid reports for BS39 5UX, Chapel Cottages
Click on the buttons below to see price paid reports by year or property price:
- Price Paid By Year
Property Price Paid in BS39 5UX, Chapel Cottages by Year
The average sold property price by year was:
| Year | Average Sold Price | Price Change |
Sold Properties
|
|---|---|---|---|
| 2018 | £300,000 | 35% |
1 Property |
| 2006 | £195,000 | 47% |
1 Property |
| 2002 | £102,500 | 47% |
1 Property |
| 1995 | £54,500 | - |
1 Property |