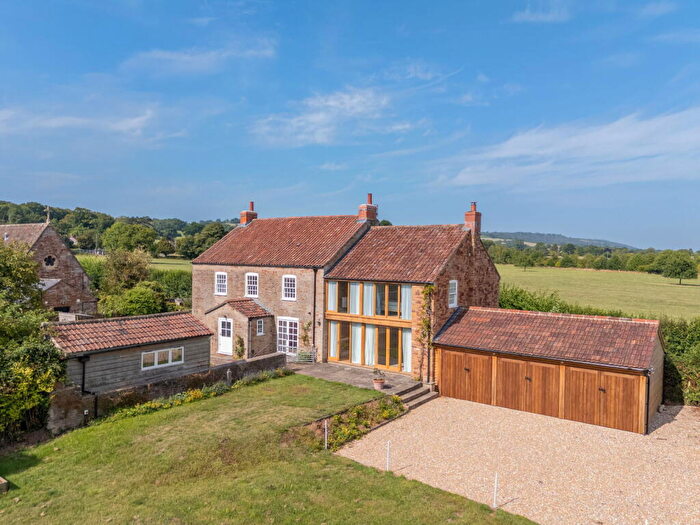
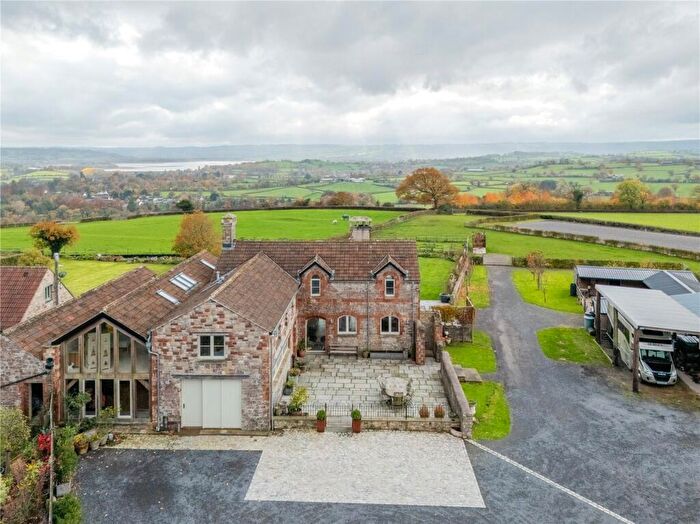
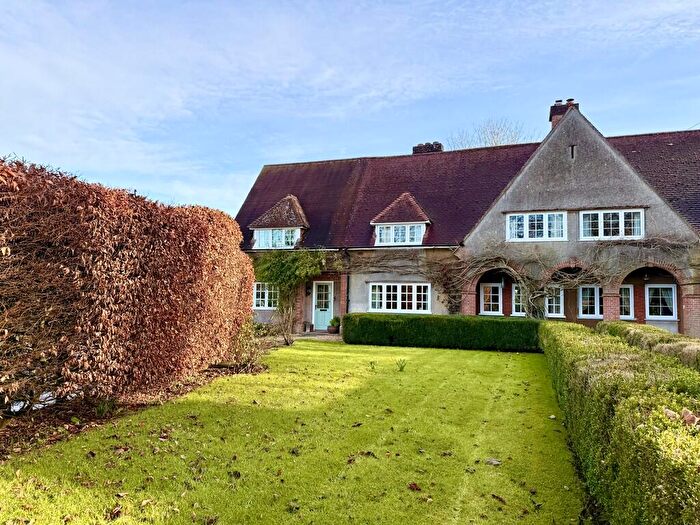
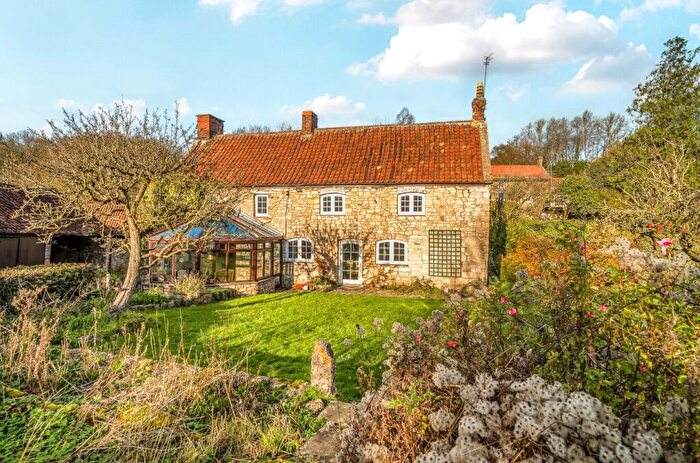
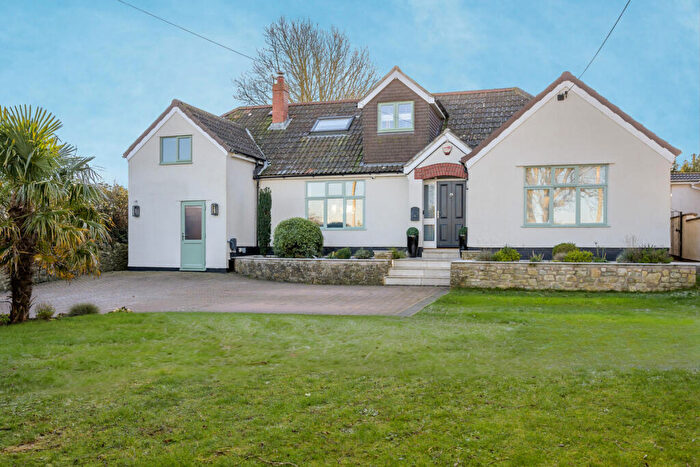
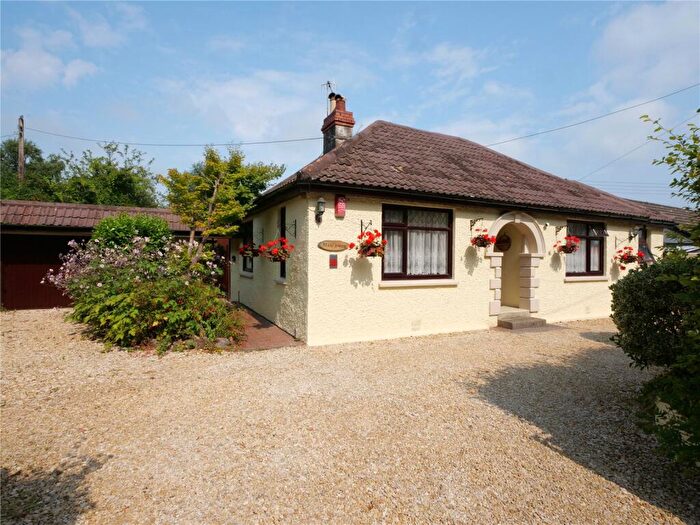
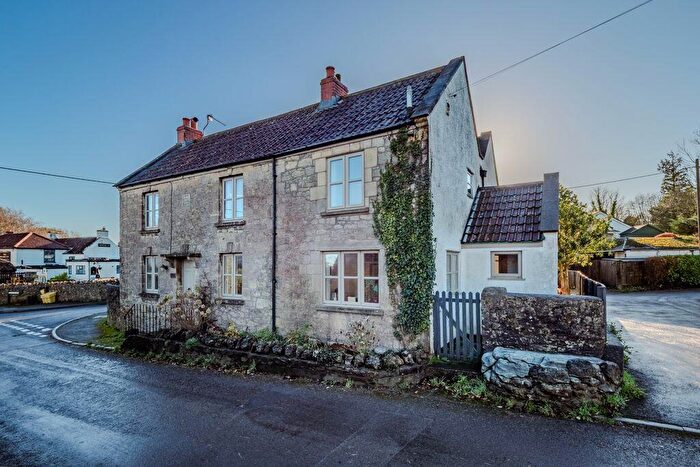
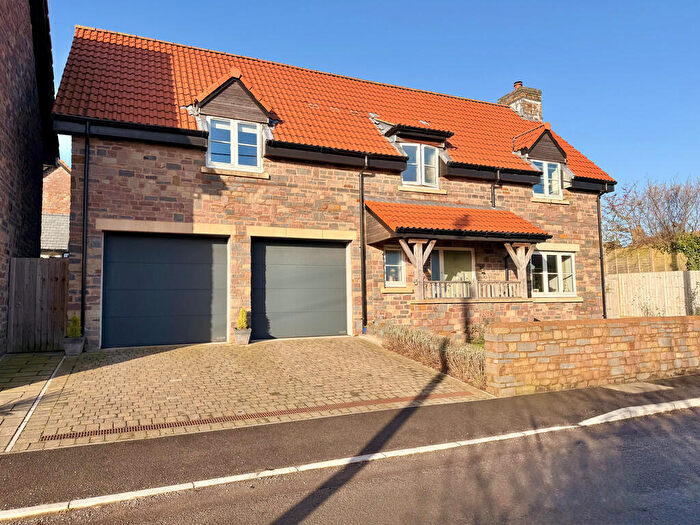
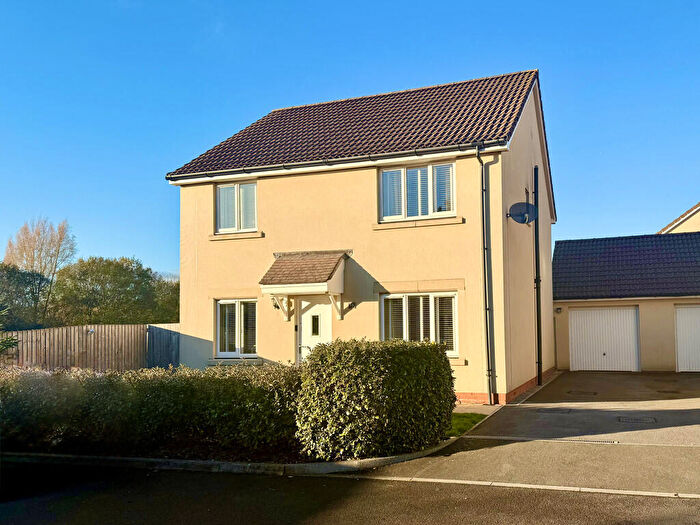
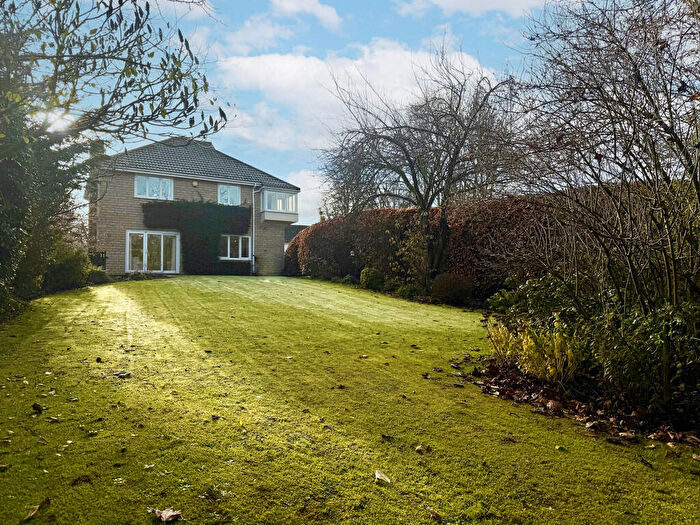
Houses for sale & to rent in Chew Valley South, Bristol
House Prices in Chew Valley South
Properties in Chew Valley South have an average house price of £686,340.00 and had 70 Property Transactions within the last 3 years¹.
Chew Valley South is an area in Bristol, Bath and North East Somerset with 877 households², where the most expensive property was sold for £1,825,000.00.
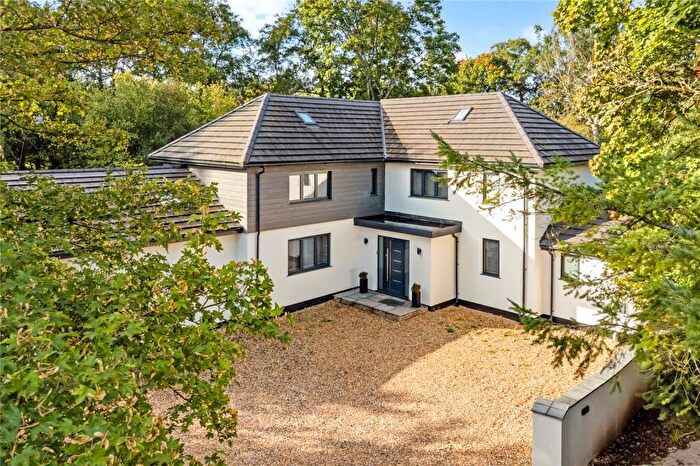
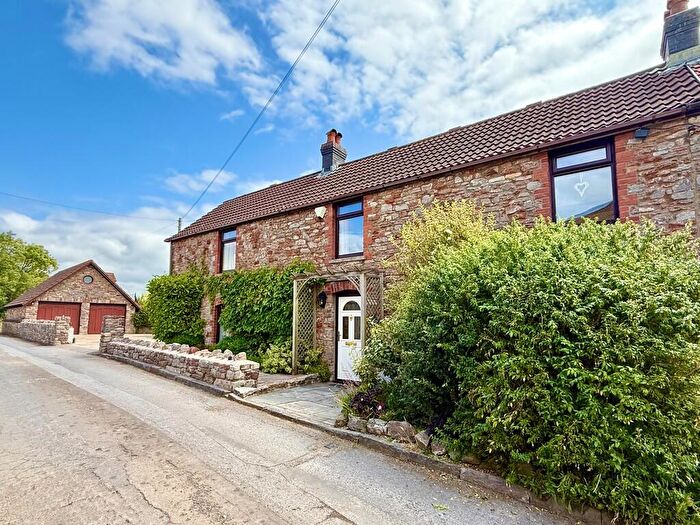
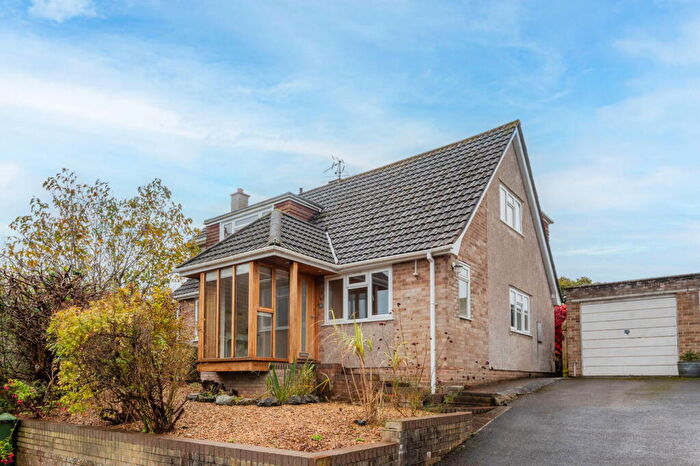
Properties for sale in Chew Valley South
Roads and Postcodes in Chew Valley South
Navigate through our locations to find the location of your next house in Chew Valley South, Bristol for sale or to rent.
| Streets | Postcodes |
|---|---|
| Bickfield Lane | BS40 6NF |
| Bonhill Road | BS39 5TS BS39 5TU |
| Bristol Road | BS40 6NH BS40 6NQ |
| Cappards Road | BS39 5PS |
| Chapel Cottages | BS39 5UX |
| Church Lane | BS39 5UP BS39 5XA |
| Cleeve Hill | BS40 6PE |
| Durnhill | BS40 6JT |
| Frog Lane | BS40 6PW |
| Ham Lane | BS39 5TY BS39 5TZ |
| Hazel Barrow | BS40 6JX |
| Highfield Lane | BS40 6JL BS40 6LA |
| Highland Villas | BS39 5UY |
| Highmead Gardens | BS39 5XB |
| Hillside Gardens | BS39 5XG |
| Innicks Close | BS40 6PL |
| Lakeside Close | BS40 8YT |
| Lovell Drive | BS39 5PT |
| Main Road | BS39 5TP |
| Mendip Villas | BS40 6JG |
| Mill Lane | BS40 6NA |
| Nempnett Street | BS40 8YS |
| Nempnett Thrubwell | BS40 7XD BS40 8YF BS40 8YH BS40 8YJ BS40 8YP BS40 8YQ |
| Northwick Gardens | BS39 5XS |
| Orchard Close | BS39 5XJ |
| Parkfield Gardens | BS39 5XF |
| Rectory Lane | BS40 6JJ BS40 6JP BS40 6JR |
| Redland Lane | BS39 5TW |
| Rushgrove Gardens | BS39 5XE |
| Snatch | BS40 6PT |
| Squire Lane | BS40 6PP BS40 6PQ |
| Stitchings Shord Lane | BS39 5UD |
| Stowey | BS39 4DN BS39 5TH |
| Stowey Bottom | BS39 5TL BS39 5TN |
| Stowey Cottages | BS39 4DL |
| Stowey Crossroads | BS39 5TJ |
| Sutton Hill | BS39 5UN |
| Sutton Hill Road | BS39 5UH BS39 5UR BS39 5UT |
| Sutton Park | BS39 5UQ |
| Sutton Wick | BS39 5XR |
| The Barton | BS40 6JN |
| The Batch | BS40 6JB BS40 7UY |
| The Coombe | BS40 6JD |
| The Reddings | BS40 6AS |
| The Street | BS39 5UU BS39 5UZ BS40 6JA BS40 6JE BS40 6JF BS40 6JH BS40 6JQ BS40 6JW BS40 6PA BS40 6PD BS40 6PJ BS40 6PN |
| The Wrangle | BS40 6LB |
| Top Sutton | BS39 5UW |
| Tuckers Lane | BS40 6PB |
| Ubley Sideling | BS40 6PF |
| Undertown | BS40 6NB |
| Undertown Lane | BS40 6ND |
| Villice Lane | BS40 6LX |
| Wick Road | BS39 5XD BS39 5XH BS39 5XP BS39 5XQ |
| Woodcroft | BS39 5XL BS39 5XN BS39 5XW |
| Yeatman Close | BS39 5PU |
| Yew Tree Close | BS39 5UG |
| Yew Tree Lane | BS40 6JS |
| BS40 5TS BS40 6PX BS40 7XA |
Transport near Chew Valley South
-
Parson Street Station
-
Bedminster Station
-
Nailsea and Backwell Station
-
Keynsham Station
-
Bristol Temple Meads Station
-
Yatton Station
-
Lawrence Hill Station
-
Clifton Down Station
-
Redland Station
-
Montpelier Station
- FAQ
- Price Paid By Year
- Property Type Price
Frequently asked questions about Chew Valley South
What is the average price for a property for sale in Chew Valley South?
The average price for a property for sale in Chew Valley South is £686,340. This amount is 64% higher than the average price in Bristol. There are 760 property listings for sale in Chew Valley South.
What streets have the most expensive properties for sale in Chew Valley South?
The streets with the most expensive properties for sale in Chew Valley South are Nempnett Thrubwell at an average of £1,100,000, The Batch at an average of £905,000 and The Street at an average of £831,930.
What streets have the most affordable properties for sale in Chew Valley South?
The streets with the most affordable properties for sale in Chew Valley South are Wick Road at an average of £340,666, The Barton at an average of £352,000 and Woodcroft at an average of £357,750.
Which train stations are available in or near Chew Valley South?
Some of the train stations available in or near Chew Valley South are Parson Street, Bedminster and Nailsea and Backwell.
Property Price Paid in Chew Valley South by Year
The average sold property price by year was:
| Year | Average Sold Price | Price Change |
Sold Properties
|
|---|---|---|---|
| 2025 | £673,857 | -1% |
14 Properties |
| 2024 | £681,384 | 14% |
19 Properties |
| 2023 | £583,888 | -37% |
18 Properties |
| 2022 | £797,552 | 33% |
19 Properties |
| 2021 | £530,648 | -7% |
39 Properties |
| 2020 | £566,000 | 22% |
32 Properties |
| 2019 | £442,818 | -7% |
29 Properties |
| 2018 | £472,017 | -16% |
29 Properties |
| 2017 | £549,413 | 25% |
26 Properties |
| 2016 | £411,703 | 1% |
31 Properties |
| 2015 | £405,958 | -1% |
38 Properties |
| 2014 | £411,260 | 15% |
43 Properties |
| 2013 | £350,349 | -4% |
20 Properties |
| 2012 | £364,414 | 16% |
24 Properties |
| 2011 | £307,559 | -39% |
21 Properties |
| 2010 | £426,517 | 19% |
28 Properties |
| 2009 | £347,539 | -18% |
30 Properties |
| 2008 | £410,350 | 18% |
20 Properties |
| 2007 | £336,566 | 0,2% |
45 Properties |
| 2006 | £335,952 | -0,3% |
38 Properties |
| 2005 | £336,970 | 4% |
42 Properties |
| 2004 | £322,236 | -13% |
46 Properties |
| 2003 | £364,853 | 23% |
29 Properties |
| 2002 | £282,733 | 20% |
40 Properties |
| 2001 | £225,254 | 15% |
34 Properties |
| 2000 | £190,888 | 13% |
18 Properties |
| 1999 | £165,878 | -4% |
21 Properties |
| 1998 | £172,611 | 7% |
38 Properties |
| 1997 | £159,762 | 17% |
31 Properties |
| 1996 | £132,613 | 23% |
43 Properties |
| 1995 | £102,398 | - |
29 Properties |
Property Price per Property Type in Chew Valley South
Here you can find historic sold price data in order to help with your property search.
The average Property Paid Price for specific property types in the last three years are:
| Property Type | Average Sold Price | Sold Properties |
|---|---|---|
| Semi Detached House | £483,200.00 | 20 Semi Detached Houses |
| Detached House | £854,648.00 | 39 Detached Houses |
| Terraced House | £356,416.00 | 6 Terraced Houses |
| Flat | £582,000.00 | 5 Flats |

