
Houses for sale & to rent in BS39 4JY, Rankers Lane, Farmborough, Bristol
House Prices in BS39 4JY, Rankers Lane, Farmborough
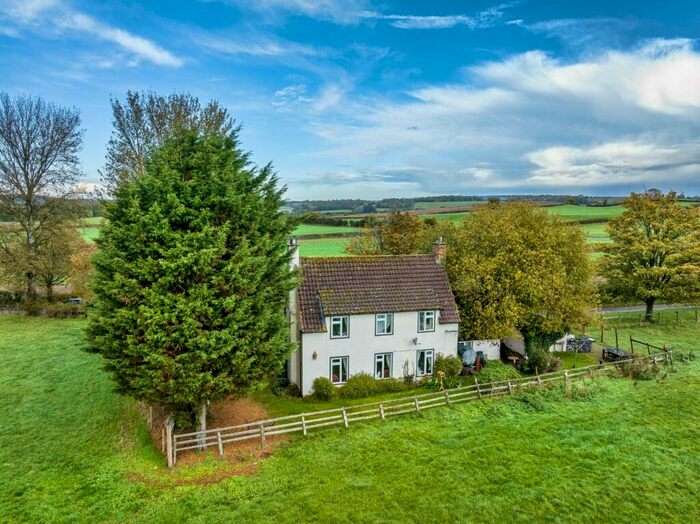
Properties in BS39 4JY have no sales history available within the last 3 years. BS39 4JY is a postcode in Rankers Lane located in Farmborough, an area in Bristol, Bath and North East Somerset, with 3 households².
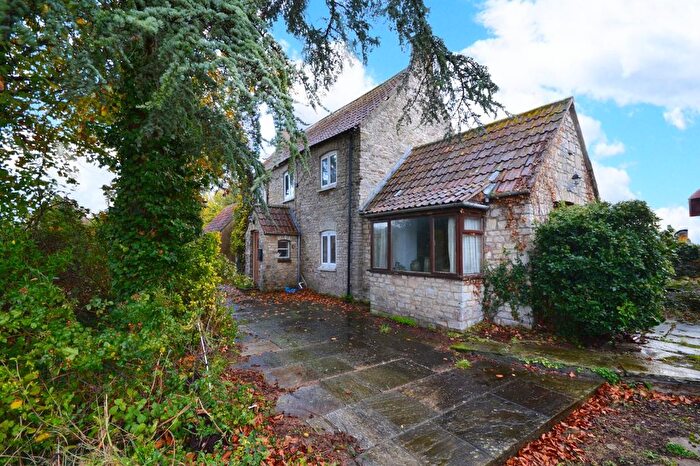
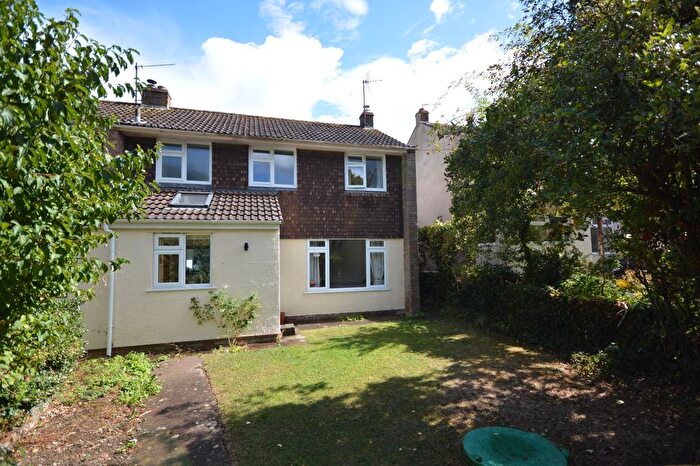
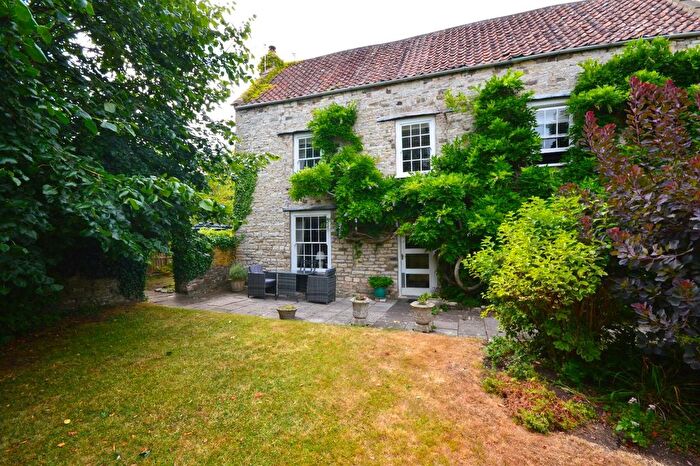
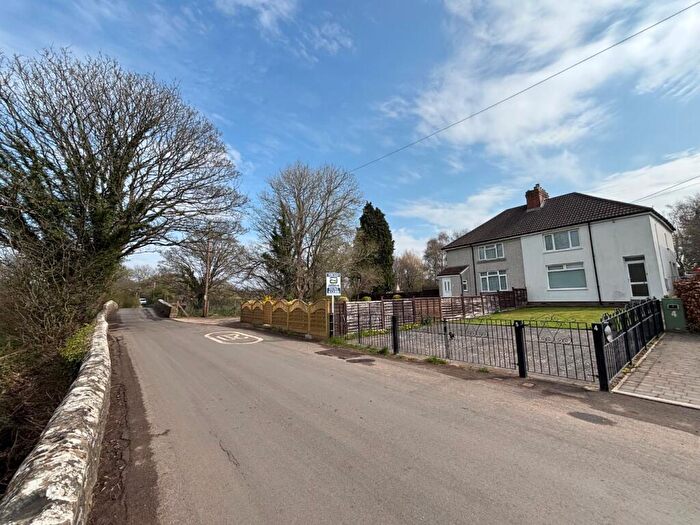
Previously listed properties near BS39 4JY, Rankers Lane
![]()
If you are looking to sell your house, let it out, or receive a property valuation, an expert can help you.
Click the button below to get started.


Price Paid in Rankers Lane, BS39 4JY, Farmborough
BLACKERS MEAD Rankers Lane, BS39 4JY, Farmborough Bristol
Property BLACKERS MEAD has been sold 1 time. The last time it was sold was in 06/08/2019 and the sold price was £800,000.00.
This detached house, sold as a freehold on 06/08/2019, is a 249 sqm detached house with an EPC rating of D.
| Date | Price | Property Type | Tenure | Classification |
|---|---|---|---|---|
| 06/08/2019 | £800,000.00 | Detached House | freehold | Established Building |
CHARNWOOD HOUSE Rankers Lane, BS39 4JY, Farmborough Bristol
Property CHARNWOOD HOUSE has been sold 3 times. The last time it was sold was in 27/06/2013 and the sold price was £1,200,000.00.
This detached house, sold as a freehold on 27/06/2013, is a 309 sqm detached house with an EPC rating of D.
| Date | Price | Property Type | Tenure | Classification |
|---|---|---|---|---|
| 27/06/2013 | £1,200,000.00 | Detached House | freehold | Established Building |
| 30/11/2007 | £945,000.00 | Detached House | freehold | Established Building |
| 31/01/1995 | £205,000.00 | Detached House | freehold | Established Building |
Transport near BS39 4JY, Rankers Lane
-
 Keynsham Station
 -
Oldfield Park Station
-
Bedminster Station
-
Parson Street Station
-
Bristol Temple Meads Station
-
Lawrence Hill Station
-
Bath Spa Station
-
Stapleton Road Station
-
Montpelier Station
-
Redland Station
House price paid reports for BS39 4JY, Rankers Lane
Click on the buttons below to see price paid reports by year or property price:
- Price Paid By Year
Property Price Paid in BS39 4JY, Rankers Lane by Year
The average sold property price by year was:
| Year | Average Sold Price | Price Change |
Sold Properties
|
|---|---|---|---|
| 2019 | £800,000 | -50% |
1 Property |
| 2013 | £1,200,000 | 21% |
1 Property |
| 2007 | £945,000 | 78% |
1 Property |
| 1995 | £205,000 | - |
1 Property |